
Multi-phase-field simulation of austenite peritectic solidification based on a ferrite grain*
2021-01-21 02:08ChaoYang杨超JingWang王静JunshengWang王俊升YuLiu刘瑜GuominHan韩国民HaifengSong宋海峰andHoubingHuang黄厚兵
Chinese Physics B 2021年1期
Chao Yang(杨超), Jing Wang(王静), Junsheng Wang(王俊升), Yu Liu(刘瑜),Guomin Han(韩国民), Haifeng Song(宋海峰),, and Houbing Huang(黄厚兵),†
1School of Materials Science and Engineering,Beijing Institute of Technology,Beijing 100081,China
2Advanced Research Institute of Multidisciplinary Science,Beijing Institute of Technology,Beijing 100081,China
3Laboratory of Computational Physics,Institute of Applied Physics and Computational Mathematics,Beijing 100088,China
4Software Center for High Performance Numerical Simulation,China Academy of Engineering Physics,Beijing 100088,China
Keywords: multi-phase-field simulation,morphology evolution,peritectic solidification,carbon diffusion,Fe-C alloy
1. Introduction
As a typical non-equilibrium process, the peritectic solidification of Fe-C alloy involves the multi-phase interactions between ferrite (δ phase), austenite (γ phase), and liquid (L phase), and the carbon diffusion plays an important role in these non-equilibrium phase transformations.[1–3]The microstructure morphology and the carbon micro-segregation formed during this peritectic solidification can affect the subsequent solid state phase transformation, which in turn influences the material properties. However, the study on mesoscopic Fe-C peritectic solidification is limited on the one hand by the complexity of analyzing the non-equilibrium dynamic system,and on the other hand by the difficulty of hightemperature in situ experiments. The physical model coupled with the multi-phase field and the carbon concentration field can be used to simulate the non-equilibrium process at mesoscopic scale, which provides an approach to understand the dynamic mechanism of morphology and micro-segregation evolution.[4–6]
The multi-phase field model can reveal the interaction mechanism of δ,γ,and L phases by simulating the movement of diffuse interface and the redistribution/diffusion of carbon at the interface region. The peritectic solidification of Fe-C alloy includes three kinds of interfaces,namely,δ–γ,δ–L,and γ–L interfaces, respectively. Based on the Gibbs–Thomson effect,the movement of these interfaces is driven by the local interface curvature and the driving forces of the phase transformations,where the driving forces ΔG include ΔGδ→γ,ΔGL→δ,and ΔGL→γ.The interface curvature effect is an inherent property of the phase-field method,[7]and the driving forces can be calculated by the Kim–Kim–Suzuki(KKS)model.[5,8,9]In addition,the redistribution/diffusion of carbon can be simulated by the diffusion equation,which is solved in conjunction with the interface dynamics equation derived by the multi-phase field. Through the above-mentioned simulation of interface movement and carbon redistribution/diffusion, the peritectic solidification simulation of Fe-C alloy can be achieved.[10–12]
In recent years,experimental methods and numerical simulations are used to study the Fe-C peritectic solidification process. According to in-situ experiment, Yasuda et al.[13]explored the dendrite fragmentation induced by massive-like δ–γ transformation in Fe-C alloy, which illustrated the dendrite arm fragmentation mechanism during the peritectic solidification. Yang et al.[9,14,15]applied the multi-phase field method to study the peritectic solidification of Fe-C alloy based on dendritic and polycrystalline ferrite, which clarified the morphology evolution mechanism. Fan et al.[16]used a cellular automaton model to simulate the peritectic transformation of Fe-C system,compared the simulation results with the experimental measurements,and presented analytical predictions for the growth kinetics of the austenite and the concentration distributions. Although these works partially reveal the kinetic mechanism of the Fe-C peritectic solidification process,a deep understanding of the austenite nucleation and growth process based on ferrite equiaxed crystal grain remains lacking.
In the present work,a multi-phase field and a carbon concentration field are introduced for the numerical simulation of Fe-C peritectic solidification. The nucleation and growth of γ phase is based on the existing δ phase equiaxed grain, and two sets of initial conditions with different thicknesses of primary γ phase are applied to explore the evolution of morphology and carbon segregation. Not only the influence of γ phase nucleation on the subsequent microstructure morphology and carbon distribution is discussed in this article,but also the formation mechanism of liquid phase channels and molten pools is revealed. The present work is useful for understanding the dynamic mechanism of the peritectic solidification of Fe-C alloy.
2. Methods
For the simulation of Fe-C peritectic solidification,multiphase field and carbon concentration filed are necessary for tracking the movement of the diffuse interfaces and calculating the redistribution/diffusion of carbon. The order parameters of the multi-phase field can be marked as φδ,φγ,and φL,which can be considered as the volume fractions of δ, γ, and L phases. As expressed by Eq.(1),the governing equation of those three order parameters is used to calculate the dynamic evolution of the interface and phase distribution, which follows the basic form of the Allen–Cahn equation.[17]Since the sum of the three phase volume fractions is one,equation(2)as a constraint is an important supplement to Eq.(1). In addition,the variable of the carbon concentration field can be marked as C,which can be expressed in the mole fraction.Equation(4)is the governing equation of this concentration field,which is applied to calculate the carbon redistribution/diffusion process.As a dynamic equation of the conserved field, equation (4)follows the form of Cahn–Hilliard equation.
According to the Gibbs–Thomson effect, two key factors determine the interface movement. One is the interface curvature, the other is the driving force of phase transformation.[18,19]The gradient energy terms and the barrier energy term in Eq. (1) are related to the calculation of the local interface curvature,and the driving force term in this phase-field equation introduces the driving force into the interface dynamics process.[5,7]The driving force ΔG in Eq.(1)can be calculated from the local phase composition cα, and the related methods can refer to the parabolic approximation scheme of KKS model.[8,9]The carbon diffusion equation expressed by Eq.(4)is also based on the local phase composition cα. This equation can not only calculate the carbon diffusion in different phases with different kinetic coefficients,but also achieve the simulation of carbon redistribution at the interface region.
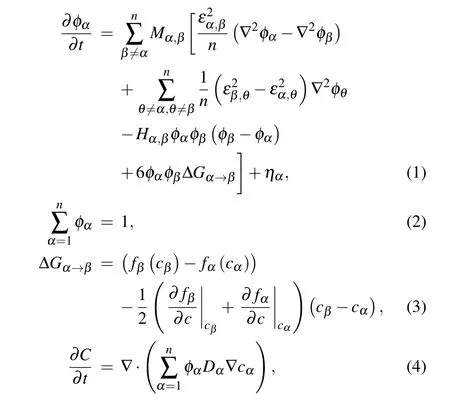
where α,β,θ indicate the different phases and n is the quantity of total phases.Concretely,n=3 and α,β,θ represent the δ,γ,and L phases of the Fe-C system. φ is the order parameter of the phase field. M is the kinetic coefficient of the phase field. ε is the gradient energy coefficient. H is the barrier energy of the double-well function. ΔG is the driving force of phase transformation, which can be calculated from the local order parameter and carbon concentration by KKS model.[9]η is the noise term. fαis the free energy density function of the α phase.cαis the phase composition of carbon in α phase,which is derived from the KKS model.[9]C is the concentration of carbon. Dαis the diffusion coefficient of carbon in α phase.

For the numerical simulation, we apply an explicit finite difference algorithm based on a distributed memory parallel system to solve the above equations, and a Fortran program with MPI (Message Passing Interface) library is designed for the calculation.[20]For each calculation task, 40 parallel threads are called by the parallel system. The memory requirement of each thread is about 100 MB,and it takes about 3 hours of CPU time to complete each calculation task. The mesh scale of the simulation is 2200×2200, and the spatial step size is one-sixth of the interface width of the phase field.The number of time iterations is 36000. The physical parameters used in the simulation have been listed in the previous article.[14,21]
3. Results and discussion
The peritectic solidification of Fe-C alloy involves existing L phase and δ phase,as well as the subsequent γ phase. In order to study the three-phase interactions,a δ phase equiaxed grain is first produced in the L phase, and then the γ phase nucleates on the δ–L interface. As the Fe-C phase diagram shown in Fig.1,the initial mole fraction of carbon in L phase is set as 0.01, and the solidification temperature 1750 K is slightly lower than the peritectic temperature.[22]At this concentration and temperature point, γ phase is the most stable phase. Based on the above initial concentration and constant temperature,the δ phase first grows into an equiaxed grain in the L phase,and the carbon distribution around this equiaxed grain is non-uniform. Due to the solute distribution and diffusion,the carbon concentration is higher at the dendrite gaps and lower at the dendrite tips. And the carbon concentration at the δ–L interface region determines the local driving forces ΔGL→γand ΔGα→γ, which in turn influence the nucleation of the γ phase. For the study of peritectic solidification, the nucleation of γ phase is necessary to be introduced in the simulation.

Fig.1.Phase diagram of peritectic region in Fe-C system.The red,blue,and green lines present the equilibrium concentration of δ–γ phases,δ–L phases,and γ–L phases,respectively. And the dotted lines are the metastable extensions of two-phase equilibrium.
At the δ–L interface region, the driving force from the L phase to γ phase ΔGL→γis calculated to be greater than the driving force from the δ phase to γ phase ΔGα→γ, which makes ΔGL→γa key criterion for the heterogeneous nucleation of γ phase. According to the local distribution of carbon concentration and order parameter,we introduce a nucleation mode to produce γ phase on the surface of the δ phase equiaxed grain,where the thickness of the primary γ phase is proportional to the local driving force ΔGL→γ. The setting details and techniques of this γ phase heterogeneous nucleation can be found in previous articles.[14,15]Although the relative thickness of the primary γ phase depends on the local driving force, the setting of this nucleation mode still requires artificial parameters to determine the absolute thickness. In order to reveal the influence of different thickness of the primary γ phase,two sets of initial conditions are applied in the simulations. In the first case,the maximum thickness of the primary γ phase is six times the interface width of the phase field,and the maximum thickness appears at the tip of the dendrite with a lower carbon concentration. For comparison,the maximum thickness of the primary γ phase in the second case is half of that in the first case. In addition,periodic boundary conditions are used in both sets of simulations.
Based on the aforementioned mode of γ phase nucleation,the simulation reveals the dynamic process of order parameters and carbon concentration at the mesoscopic scale, which respectively represent the evolution of phase morphology and carbon segregation. Figures 2(a) and 2(e) show the initial phase field and concentration field, respectively. Based on the driving force calculated by the local carbon concentration,the γ phase preferentially nucleates at the tips of the dendrites and grows toward the L phase by solidification L →γ,which makes the carbon-rich L phase in the dendrite gaps evolve into liquid phase channels.[23]At the δ–γ interface, the previously formed δ phase transforms into γ phase through peritectic transformation δ →γ,but this process is slower than the solidification of γ phase. In the original secondary dendrite gaps, the δ phase slowly solidifies toward the carbon-rich L phase,and this process L →δ is controlled by the diffusion of solute carbon through the liquid phase channel and the solid phase region. In addition, the peritectic reaction L+δ →γ that occurs at the three-phase coexistence regions is not significant, because the carbon concentration at these regions is generally high. The phase-field evolution shown in Figs.2(a)–2(d) reveals that the γ phase gradually encloses the δ phase and partially blocks the liquid channels, which makes these liquid channels become carbon-rich molten pools. The evolution of the carbon concentration field shown in Figs.2(e)–2(h)reveals the redistribution of carbon at the solid–liquid interface region and the controlling effect of carbon diffusion on the phase transformations. Moreover, this micro-segregation of carbon can be used to analyze the evolution history of peritectic solidification. For example,some liquid phase channels and molten pools that have been solidified can still be traced from the carbon-rich regions, and the original δ phase distribution can be identified from the low-carbon areas.

Fig.2. The dynamic process of phase morphology and carbon segregation. (a)–(d)The evolution of phase field; and(e)–(h)the evolution of carbon concentration. The red, blue, and green regions in (a)–(d) represent the distribution of δ, γ, and L phases, respectively. And the hue from blue to red represents the change in carbon concentration(mole fraction)from 0.0045 to 0.0400,which can be referred to the color scale bar on the right. Panels (a) and (e) show the initial fields of the simulation, and the maximum thickness of the primary γ phase in (a) is six times the interface width of the phase field.

Fig.3. The dynamic process of phase morphology and carbon segregation. The color representation of each phase and the color scale bar of the carbon concentration(mole fraction)are the same as those in Fig.2. As the initial conditions,the maximum thickness of primary γ phase in(a)is three times the interface width of phase field,which is half of that in Fig.2(a).
The initial heterogeneous nucleation of the γ phase can affect the phase morphology and carbon distribution during peritectic solidification. As shown in Fig. 3, the maximum thickness of the primary γ phase is half of that in Fig.2,which means that the initial conditions of Figs. 2(a) and 3(a) are slightly different. Comparing Fig. 2(b) with Fig. 3(b), when the evolution time is 12000 steps,the δ phase cannot be completely enclosed by γ phase in Fig. 3(b) because some secondary dendrites grow up on both sides of the tip of the δ phase primary dendrite. When the evolution time is 24000 steps,the γ phase in Fig.3(c)completely encloses the δ phase equiaxed grain and produces more liquid phase channels than the case in Fig. 2(c). As shown in Figs. 2(d) and 3(d), the contours of the γ–L interface are similar, but the distribution forms of the δ phase and γ phase are different. Compared with Fig. 2(d), the tips of the primary dendrites of δ phase in Fig. 3(d) become flatter, and the total volume of δ phase in Fig. 3(d) is also larger. Moreover, the evolution processes of carbon concentration in Figs.2 and 3 are slightly different.Due to the solidification of the δ phase secondary dendrites shown in Figs.3(b)and 3(f), the carbon content in the newly formed δ phase is lower,which changes the micro-segregation of carbon at a smaller scale and affects the local driving forces and thus the morphology of the peritectic transformation.
In order to present the carbon distribution in different phases, the order parameters and carbon concentration along the directional lines in Figs. 2 and 3 are shown in Fig. 4.Specifically,figures 4(a)and 4(c)correspond to the horizontal lines in Figs.2 and 3,respectively. At the interval(0,780),the δ phase,L phase,and γ phase appear alternately due to crossing the molten pools and the liquid phase channels. Among these three phases, the carbon mole fraction of the L phase is the highest, about 0.035. The difference in carbon content between δ phase and γ phase is small. And this is because the diffusion coefficient of the solid phase is relatively small,making it difficult to achieve carbon redistribution at the δ–γ interface region. The γ–L interface appears at about x=790 in both Figs.4(a)and 4(c),where the solidification of γ phase occurs. The redistribution of carbon during the solidification makes the carbon be enriched in the L phase and diffuse into the deep region of the L phase, resulting in the formation of a stable carbon diffusion zone in the liquid phase close to the γ–L interface. This carbon diffuse zone determines the driving force ΔGL→γat the γ–L interface region,which makes the carbon diffusion a controlling factor for interface movement.
Figures 4(b) and 4(d) correspond to the diagonal lines in Fig. 2 and 3, respectively. These sections do not cross the molten pools and the liquid phase channels, therefore the phase and carbon concentration distribution are simpler than the case in Figs. 4(a) and 4(c). Similarly, there is little difference in carbon concentration between δ phase and γ phase,and there is a diffusion zone close to the γ–L interface at about x/Δx=1130.The carbon concentration in the γ phase changes at about x/Δx=780,because part of the γ phase comes from the L phase by solidification,and the other part comes from the δ phase by peritectic transformation. And it can be concluded that the initial δ–L interface is located at x/Δx=780. In addition, the volume of δ phase in Fig. 4(d) is larger than that in Fig. 4(b), which is also revealed by the phase morphology in Figs.3(d)and 2(d). In Figs.4(b)and 4(d),the point around x/Δx=760 is the position of the original δ–L interface,which is also the position of the initial δ–γ interface when the γ phase nucleates. The carbon partition coefficients of δ–L interface and δ–γ interface are different,which causes the concentration fluctuation at this location.

Fig.4. The order parameters and carbon concentration distribution along the directional lines of Figs.2(d),2(h),3(d),and 3(h). Panels(a)and(b)show the cross sections along the horizontal and diagonal lines in Fig.2,respectively. Panels(c)and(b)show the cross sections in Fig.3,which are at the same position as in Fig.2. In each panel,the red,blue,and green lines present the volume fractions(order parameters)of δ phase,γ phase,and L phase,respectively. And the black line presents the distribution of carbon concentration.
4. Conclusion
In short, a multi-phase field model is implemented to study the peritectic solidification of Fe-C alloy. The simulation is based on the γ phase nucleation on the surface of the existing δ phase equiaxed grain, and the initial carbon distribution around the δ phase grain makes the γ phase preferentially nucleate at the tips of the dendrites. Two different thicknesses of γ phase are used as the initial conditions to reveal the influence of the γ phase nucleation position. The simulation not only shows the interaction of the δ phase,γ phase,and L phase at the mesoscopic scale,but also presents the controlling effect of the carbon diffusion on phase transformations. The formation and evolution mechanism of liquid phase channels and molten pools are clarified in this work, and the different thicknesses of the primary γ phase can affect the final phase morphology and carbon segregation. Therefore, the present work contributes to the understanding of the evolution mechanism of micro-morphology and micro-segregation during Fe-C peritectic solidification.
猜你喜欢
南风(2021年32期)2021-12-31
客联(2021年9期)2021-11-07
婚姻与家庭·婚姻情感版(2021年2期)2021-02-04
应用数学(2020年3期)2020-07-28
青年生活(2019年16期)2019-10-21
环球人物(2018年1期)2018-01-25
河北医科大学学报(2017年8期)2017-08-16
商情(2017年17期)2017-06-10
- Chinese Physics B的其它文章
- Two-dimensional finite element mesh generation algorithm for electromagnetic field calculation*
- Stable water droplets on composite structures formed by embedded water into fully hydroxylated β-cristobalite silica*
- Surface active agents stabilize nanodroplets and enhance haze formation*
- Synchronization mechanism of clapping rhythms in mutual interacting individuals*
- Theoretical study of the hyperfine interaction constants,Land´e g-factors,and electric quadrupole moments for the low-lying states of the 61Niq+(q=11,12,14,and 15)ions*
- Ultrafast photoionization of ions and molecules by orthogonally polarized intense laser pulses: Effects of the time delay*