
Diagnostic Analyses and Numerical Modeling of Explosive Cyclone over Northwestern Pacific on January 11–13, 2012
2022-08-17 05:43WANGGuanlanSUNBaitangSUNYawenandLIPengyuan
WANG Guanlan, SUN Baitang, SUN Yawen, and LI Pengyuan, *
Diagnostic Analyses and Numerical Modeling of Explosive Cyclone over Northwestern Pacific on January 11–13, 2012
WANG Guanlan1), SUN Baitang2), SUN Yawen2), and LI Pengyuan2), *
1) National Meteorological Center, Beijing 100081, China 2) College of Oceanic and Atmospheric Sciences, Ocean University of China, Qingdao 266100, China
In this paper, we use FNL grid data obtained from the National Centers for Environmental Prediction (NCEP) to analyze an explosive cyclone (EC) that occurred over the northwestern Pacific Ocean from January 11 to 13, 2012. To simulate the EC, we used the Weather Research and Forecasting model (WRFV3.5). The cyclone outbreak occurred east of Japan from January 11 to 12 and weakened near the Kamchatka Peninsula on January 13. The analysis results show a distinct frontal structure, in which the high potential vorticity (PV) of the upper troposphere extends downward to the surface, which can facilitate EC development. A low-level jet stream develops with the EC, which can lead to more distinct convergence. The results of sea surface temperature (SST) sensitivity tests suggest that changes in the SST can affect cyclone intensity, but have little effect on its path. When small changes are made to the SST, the air pressure at the cyclonic center responds more distinctly to an increased SST than a decreased SST. The results of our latent heat release test suggest that diabatic heating processes lead to maximum PV values in the lower troposphere. Latent heat is also one of the important factors influencing EC development.
northwestern Pacific; explosive cyclone; diagnostic analyses; SST sensitivity tests; latent heat release test
1 Introduction
In recent years, the frequency of explosive cyclones (ECs) has been increasing in the northwestern Pacific (Iwao, 2012). An EC occurs when the central atmospheric pressure (with a geostrophic adjustment at 60˚N) drops by over 24hPa within 24 hours. In other words, an EC is a rapidly developing cyclone in which the central atmospheric pressure deepens faster than 1hPah−1. Statistics reveal that, on average between 1979 and 1988, explosive extratropical cyclones occurred up to once each year in the coastal waters of the northwestern Pacific (Yi and Ding, 1993). This occurrence frequency has continued in recent years, and ECs are also occurring closer to coastal regions, which have substantially greater impacts on China (Wang, 2013). The investigation of ECs is critical for disaster prevention and mitigation, as the strong winds and short-duration heavy rains of such cyclones critically affect human life and economic productivity.
Recent research on ECs in the northwestern Pacific has made progress with respect to diagnostic analyses and numerical simulation. Studies show that most EC outbreaks occur in front of the upper trough and on the left side of the jet-exit region at 500hPa (Sanders and Gyakum, 1980). The Kuroshio/Kuroshio Extension in the northwestern Pacific is a favorable oceanic environment for EC occurrence (Chen, 1992; Yoshiike and Kawamura, 2009; Iizuka, 2013). Explanations for the development and outbreak of ECs are mainly based on dynamic and baroclinic instability theories (Roebber, 1984; Rogers and Bosart, 1986), and the theory of strong upper force processes being dominated by tropopause folding and downward jet stream momentum-transport (Bleck, 1974; Uccellini, 1985). Studies by Li and Ding (1989) show that favorable large-scale environmental conditions are necessary for EC formation, including potential instability in the atmospheric stratification along the coast, a warm and wet air current on the west side of a subtropical high, and dynamic divergence to the north of the upper jet-stream exit (Li and Ding, 1989). Yoshida and Asuma (2004) reported that cold air intrusion into the Asian continent is conducive to the development of ECs that exhibit strong baroclinic zones in their middle and lower layers (Yoshida and Asuma, 2004). A warm ocean current also plays a key role in the rapid development of ECs (Yoshiike and Kawamura, 2009; Hirata, 2015). Qin(2002) drew seven conclusions, and confirmed that ECs in the northwest Pacific are prone to consecutive onsets and most likely to occur in this area and in China’s offshore waters in March, followed by December and January. In terms of numerical simulation, Guo and Ding (2005) studied ECs using the PSU/NCAR MM5 model and concluded that latent heat release (LHR) causes uplifting of the tropopause and isothermal surface, in which the air current rises and cools at the upper level to form a disturbance trough. This adaptation process creates inertial instability in the upper level, which leads to a stronger cyclone and heavier precipitation, which further amplifies the LHR. This positive feed- back mechanism supports cyclone development (Guo and Ding, 2005). Zhao(2007), who used the MM5 and WRF models to simulate an EC and compared the results, report that the WRF model can better simulate certain EC traits. Heo(2015) studied an EC over the northwestern Pacific using the WRF model and showed that LHR is an important factor in explosive cyclogenesis.
Based on the above papers, in this study, we utilized FNL grid data and the WRFV3.5 atmospheric numerical model to diagnostically analyze and perform an SST sensitivity test on the EC that occurred between January 10 and 13, 2012 to investigate its characteristics.
2 Cyclone Development
At 18:00 UTC on January 10, 2012, the sea level pressure map shows an intensified wind shear in the ocean east of Japan (143˚E, 35˚N), which forms a circulation pattern, before displaying closed isobars. The pressure reduction rate of the cyclonic center at 00:00 UTC on the 11th exceeds 1hPah−1, and the cyclone starts to become explosive. As it gradually moves northeastward, it picks up intensity. At 18:00 UTC on the 12th, the cyclonic center’s pressure reduction rate is less than 1hPah−1, which ends the cyclone’s explosive development. The cyclone’s position is confirmed by the minimum sea level pressure in the FNL data. Fig.1 shows the path of the cyclone throughout its explosive development. At 18:00 UTC on the 10th, the cyclone was over the ocean east of Honshu, Japan (143˚E, 35˚N) before moving rapidly east-northeastward. The cyclone changes its path for the first time at 18:00 UTC on the 11th at (161˚E, 40˚N), moving north- northeastward at a slightly decreased pace. At 00:00 UTC on the 12th, the cyclonic center’s pressure reduction rate reached its maximum before slowing down significantly. At 06:00 UTC on the 12th, the cyclone changed its path for the second time at (164˚E, 48˚N). It turned north-northwestward and moved slowly until gradually weakening south of the Kamchatka Peninsula (161˚E, 52˚N). Fig.2 shows the central pressure and its rate of decrease, from which we can see that between 00:00 and 12:00 UTC on the 11th, the cyclone developed steadily, with a central pressure reduction of approximately 1.6hPah−1. The cyclone developed further at 12:00 UTC on the 11th, with its pressure reducing by about 26.3hPa between that time and 00:00 UTC on the 12th. The air pressure decreased by about 63.9hPa throughout this process. At 00:00 UTC on the 12th, the central pressure reduction rate hit a maximum of 2.7hPah−1. According to Sanders’ classification of EC intensity (Sanders, 1986), the central pressure reduction rate for weak cyclones is 1.0–1.2hPah−1, moderate 1.3–1.8hPah−1, and strong ≥1.8hPah−1. At that point in time, the EC is strong and develops most intensely, with a central pressure reduction rate exceeding 1.8hPah−1. In this study, we also focused on the cyclonic development at 00:00 UTC on the 12th. At 18:00 on the 12th, the cyclone’s central pressure reached a low of 944.9hPa, with a central pressure reduction rate less than 1hPah−1, which ended its explosive development.

Fig.1 Trajectory of the cyclonic center from 00 UTC 11:00 to 06:00 UTC on January 13, 2012, as determined from FNL sea level pressure data. Solid dots indicate the outbreak phase and the dashed dots the non-outbreak phase.

Fig.2 Time series of central pressure (red dashed line, hPa) and its deepening rate (black dashed line,hPah−1).
3 Analysis of Large-Scale Meteorological Environment
The above analysis shows that 00:00 UTC on January 11 marks the beginning of the EC’s development. At 00:00 UTC on the 12th, the EC develops most intensely, with its central pressure deepening to its maximum. The EC’s central pressure is at its lowest at 18:00 UTC on the 12th. We chose these three stages for our analysis as they represent the EC’s entire outbreak process.
At 00:00 UTC on January 11, at 200-hPa geopotential height (Fig.3a), the cyclone was to the left of the upper jet-stream-axis center, which is conducive to overall divergence and cyclonic development. At 500-hPa geopotential height (Fig.3b), there is a trough in the region from Sakhalin to the north of North Korea, which has a cold advection behind it. This advection would further facilitate the development of the downstream cyclone. At 850-hPa geopotential height (Fig.3c), corresponding to 500hPa in front of the upper trough, there is a strong cold advection upstream of the cyclone. A cold advection with decreasing height is favorable to the development of the upper trough and cyclone. The sea-level pressure map (Fig.3d) shows strengthened cyclonic circulation, obvious convergence in the wind field, and stronger uplift, which means that the cyclone will further develop. At 00:00 UTC on the 12th, the cyclone was located on the left side of the jet stream exit at 200-hPa geopotential height (Fig.4a). The left side of the jet stream exit usually exhibits strong divergence. From the divergence map, we can see that at 200hPa, there is a strong divergence area right above the cyclonic center, which is highly conducive to its development. At 500-hPa geopotential height (Fig.4b), the cyclone develops very vigorously and extends upward to the middle troposphere. This area corresponds to a large trough with a cold advection behind it and a strong warm advection in front. According to weather theories, this trough will continue to deepen and move towards the katallobaric zone in front of the trough, which supports cyclone development. At 850-hPa geopotential height (Fig.4c), the cyclonic center corresponded to a low vortex center. There was a strong warm tongue to the southeast of the low vortex, and in front of the trough corresponding to the vortex center, there was still a strong warm advection. The corresponding lower layer of this structure was a strong frontal structure with an isotherm ribbon, crossed contour lines, and strong baroclinity. The sea-level pressure map (Fig.4d) shows the formation of a strong and powerful cyclone system with a cold front corresponding to southwesterly to westerly winds. The warm and wet air currents at low latitudes would be continuously transported to the cyclonic center, providing sufficient impetus for cyclonic development. At 18:00 UTC on the 12th, the cyclonic center moved away from the left side of the jet stream exit at 200-hPa geopotential height (Fig.5a), with significantly weaker divergence.
At 500-hPa geopotential height (Fig.5b), we can see a warm advection behind the trough west of the low vortex center. The trough will weaken and so will the easterly warm advection. As the easterly warm tongue withdraws southward, the low vortex center will be controlled by the cold advection, causing the filling process to gradually weaken. At 850-hPa geopotential height (Fig.5c), there was a weakening cold advection southeastward of the low vortex, which weakened the development of the corresponding easterly upper trough. The isothermal gradient decreased and the corresponding frontal structure also weakened. The sea-level pressure map (Fig.5d) shows the central pressure hitting a low and the wind field conver- gence clearly weakening, with the cyclone’s long-axis exceeding 2500km in diameter. In the early stage of the EC’s development, there was a cyclone between Sakhalin and the Kamchatka Peninsula, which delivered background wind fields of southwesterly air currents and cyclonic wind shears, thereby enabling the final EC. The cyclone between Sakhalin and Kamchatka intensified slightly in the middle to latter stages, which further enabled the explosive cyclonic development. The low wind speed between the two cyclones produced mutual rotation, which affected the path of the EC (Brand, 1970). The first cyclone eventually merged with the EC, which was nearly spent, thus bringing the EC to a faster conclusion.

Fig.3 Weather maps at 00:00 UTC on January 12th, 2012 prepared using FNL data: (a) 200-hPa geopotential height (black solid contours, 300gpm interval) and wind speed (blue dashed contours, 40ms−1 interval); (b) 500-hPa geopotential height (black solid contours, 120gpm interval) and air temperature (red dashed contours, 8℃ interval); (c) 850-hPa geopotential height (black solid contours, 120gpm interval) and air temperature (red dashed contours, 8℃ interval); (d) sea level pressure (solid, 10hPa interval) and surface wind (arrows, ms−1). The location of the cyclonic center is indicated by the solid circle.

Fig.5 As in Fig.3, but for 18:00 UTC on January 12, 2012.
4 Analysis of Cyclone Vertical Structure
To study the temperature–moisture structure at the center of the EC, in this paper, we analyze the moment when the central pressure reduction rate of the EC is at its greatest, and focus on the cyclonic center. The vertical cross-section (Fig.4d) shows the 13 longitudes spanned by the cyclone on both its left and right. We examine the cyclone mainly with respect to its front, equivalent potential temperature, PV, vertical divergence, and wind speed. An analysis of the equivalent potential temperature map (Fig.6a) shows an obvious warm tongue at the cyclonic center at 00:00 UTC on the 12th, similar to the warm core structure in a typhoon. The condensation latent heat produced by the cumulus convection is released into the middle and upper troposphere, causing a buildup of air pressure and stronger divergence in the middle to upper layers. Upper-level divergence and heating reduce the surface air pressure and strengthen surface circulation, which are conducive to EC development. The cold front west of the cyclone, which assumed a quasi-vertical form, approached very near to the cyclonic center. It is evident that the front was developing intensely. As the cold front neared the cyclonic center, the uplift of warm and wet air at the center became stronger and the ground convergence also intensified. As a result, the central pressure reduction rate increased. An analysis of the PV diagram (Fig.6b) reveals a larger PV center in the middle and lower troposphere above the cyclonic center. The center’s vorticity already exceeds 3 PVU. Hoskins(1985) suggested that a downward PV anomaly from the upper troposphere or stratosphere can lead to cyclonic development in the lower troposphere and on the ground. Strong cold air appeared to the west of the cyclone, and the equivalent potential temperature line took on a ‘nose-like’ structure. Coupled with high PV, the intense convection and latent heat released from water-vapor condensation promoted the cyclone’s development. An analysis of the vertical divergence (Fig.6c) shows a strong convergence center in the middle and lower troposphere. The middle and lower layers of the convergence center tilt upwards to the east, and there is a strong divergence center near 650hPa in the middle troposphere. Low strong convergence centers demonstrate strong and low cyclonic circulations with strong ascending movement, which facilitate the cyclone’s development. A divergence center was located in the middle troposphere. From our analysis of the vertical distribution of wind speed (Fig.6d), we can see that at 00:00 UTC on the 12th there was a strong divergence center in the upper troposphere. According to the Dines compensation principle (Dines, 1915), an upper diver- gence center is conducive to the development of lower convergence. At the same time, a strong low-level jetstream was developing, and strong low-level jet streams in the lower troposphere can enhance uplift of the lower layer, thereby benefiting cyclone development.
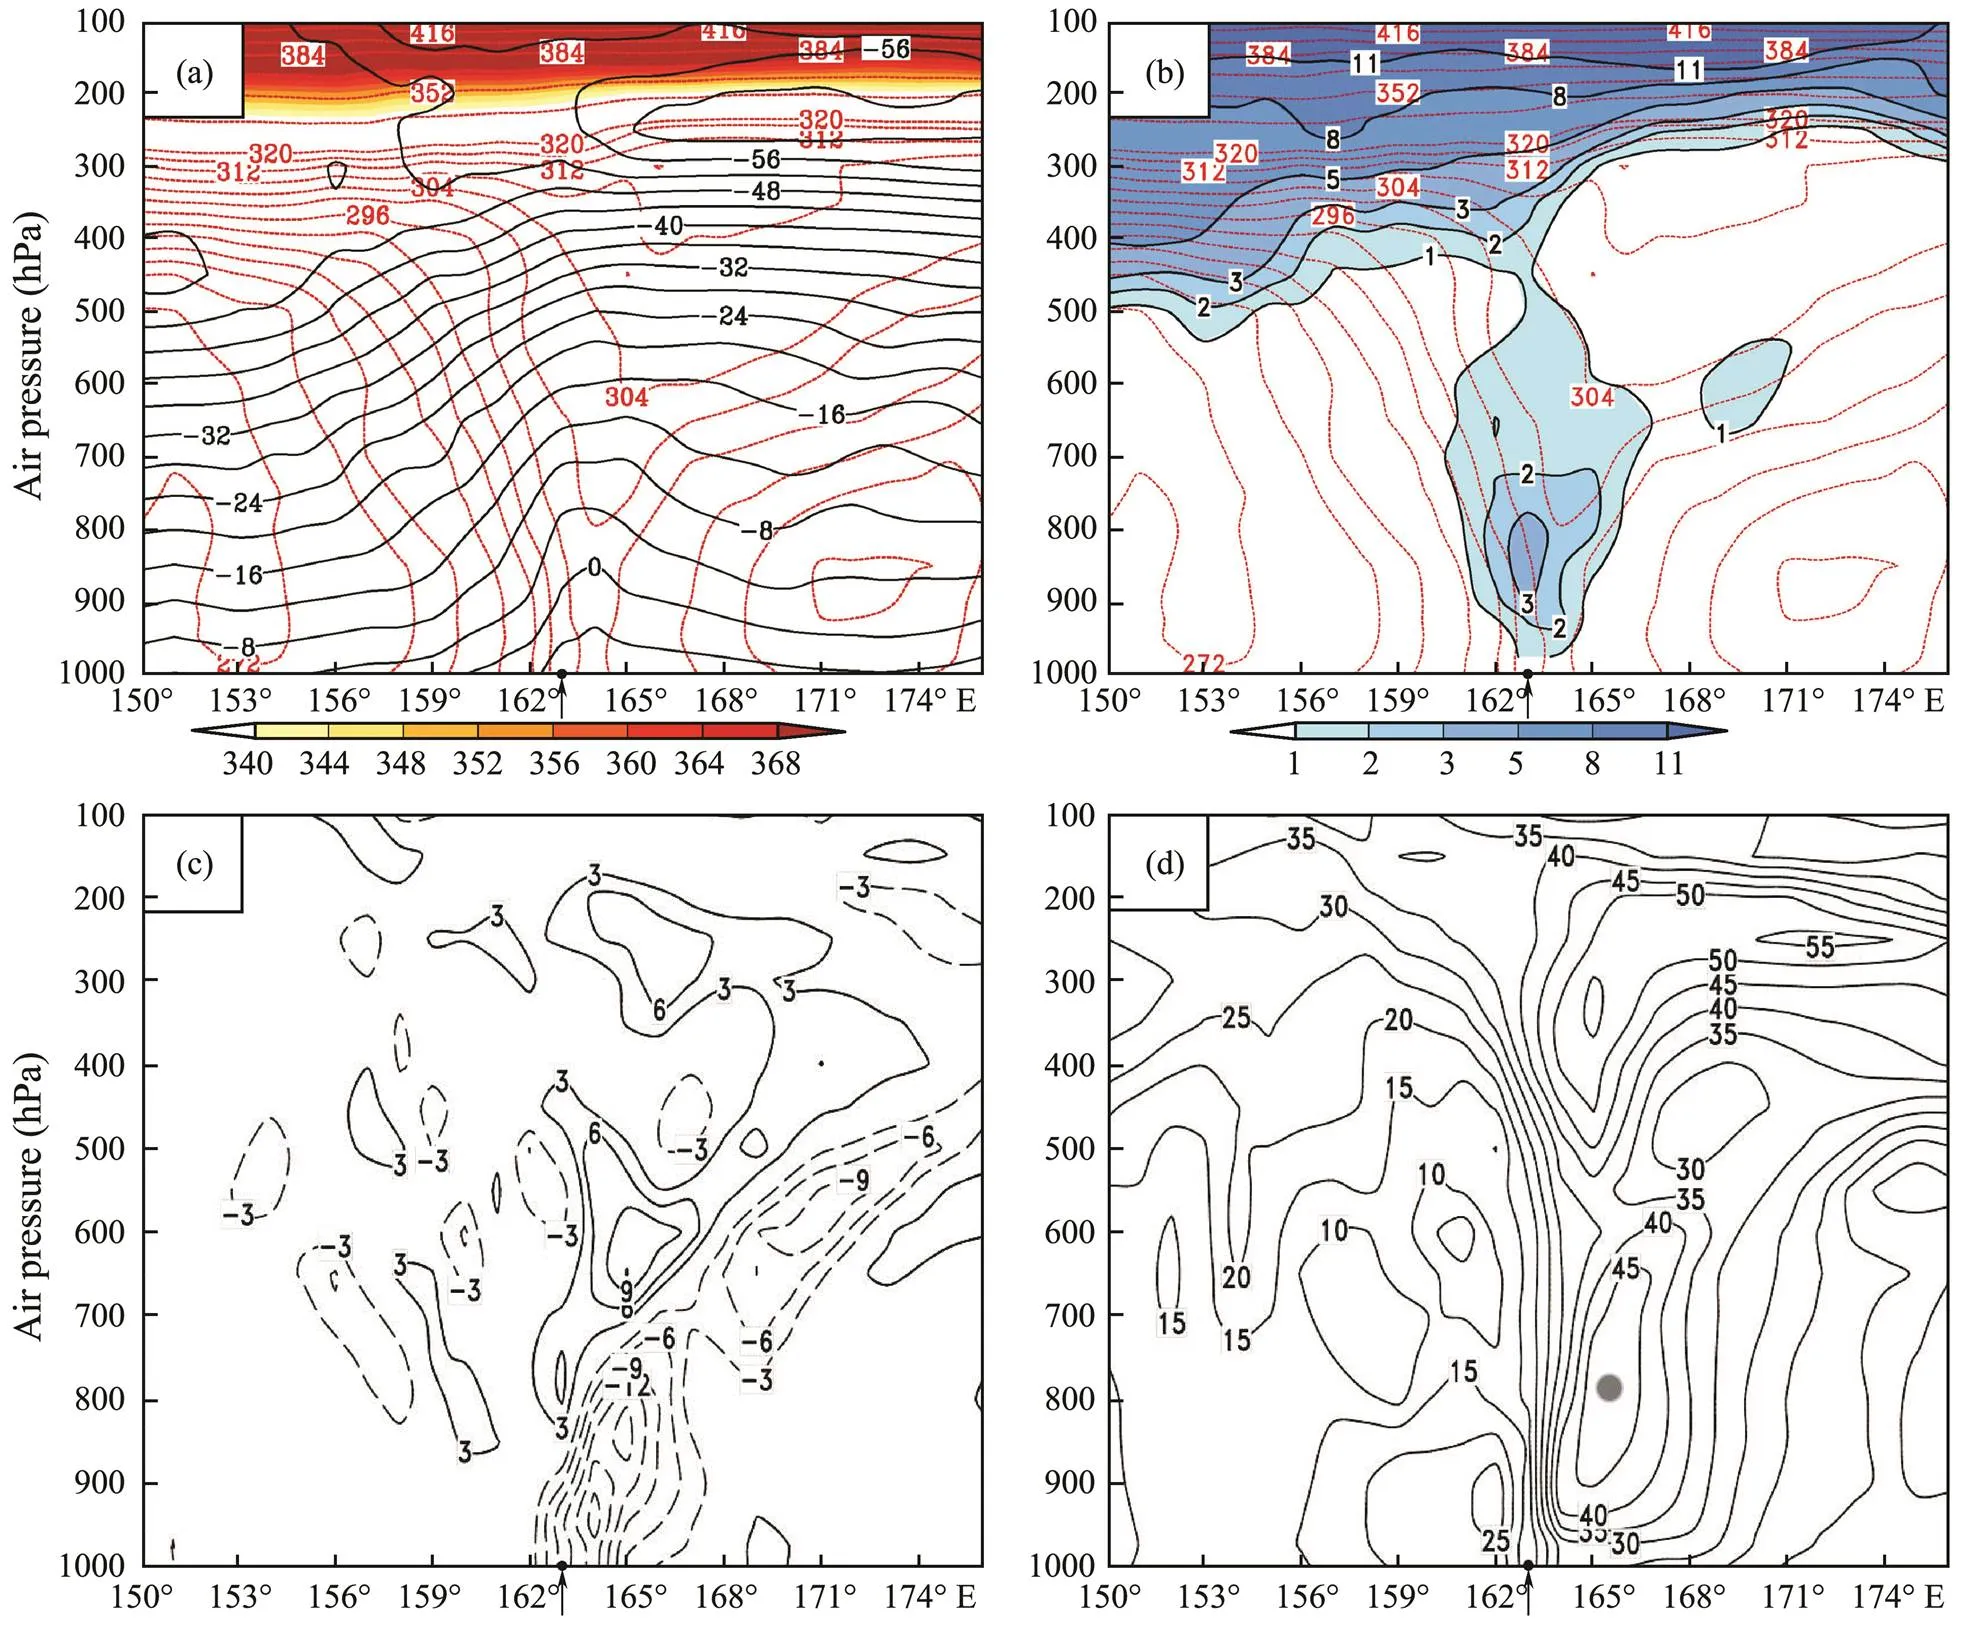
Fig.6 Vertical cross-section analyses along line EF at 00:00 UTC January 12, 2012: (a) Potential temperature (dashed contours, 8K interval) and air temperature (solid contours, 8K interval); (b) potential temperature (dashed contours, 8K interval) and PV (solid contours, 1PVU interval); (c) vertical divergence (10−5s−1 interval); (d) vertical distribution of the wind speed (5ms−1 interval), where the gray solid dot indicates the portion of the axis of the jet stream at the lower troposphere. The location of the cyclonic center is indicated by the solid circle and the arrow.
5 Water Vapor Analysis
According to our analysis of the cloud water content at 00:00 UTC on the 12th (Fig.7a), the cloud water content east and north of the cyclonic center was very high. The analysis of the water vapor flux divergence at 850hPa (Fig.7d) at the same time shows that on the east and north sides of the cyclonic center there was an obvious water vapor convergence zone in the lower troposphere. In conjunction with Fig.7c, it is apparent that a cloud formation was vigorously developing with the better water vapor convergence and high specific humidity, whereas the southwest quadrant exhibits a lower water content and specific humidity. From the vertical distribution of wind speed (Fig.6d), we can see that at 00:00 UTC on the 12th, there was a low-level jet stream in the lower troposphere east of the cyclonic center at about 850hPa. According to the equivalent potential temperature map of wind speed (Fig.7c) at 850hPa at 00:00 UTC on the 12th, there was a narrow low-level jet stream east of the cyclone with a wind speed greater than 40ms−1blowing in a southeasterly direction. This low-level jet stream corresponds to a strong warm current, and a warm tongue developed from south to north on the front. In our analysis of the 850-hPa specific humidity map (Fig.7b), we found a high specific humidity area in the southeast quadrant, while the southeasterly wind continuously provided the cyclonic center with vapor and energy to produce a very clear spiral EC structure. The air at low latitude with a high water vapor content was ‘involved’ with the cyclonic center, which facilitated the cyclone’s development.

Fig.7 Water vapor analyses on 00:00 UTC January 12, 2012. (a) Cloud water (0.5kgm−2 interval); (b) 850-hPa specific humidity (0.01kgkg−1 interval); (c) 850-hPa wind speed (blue shaded areas, 5ms−1 interval) and potential temperature (red dashed contours, 8K interval). The location of the cyclonic center is indicated by the solid circle; (d) 850-hPa water vapor flux divergence (10−6kg(kgs)−1 interval).
6 Numerical Model Simulations
6.1 SST Sensitivity Test
ECs mostly occur over the ocean in winter and spring. Considering the great difference between the sea surface temperature (SST) and land temperature, we conducted an SST sensitivity test to explore the effect of SST on the EC. We used the WRF V3.5 model to simulate this process, the parameter settings of which are shown in Table 1 (Lin, 1983; Dudhia, 1989; Kain and Fritsch, 1990; Mlawer, 1997; Hong, 2006). In the table, FNL data represent the original process. Compared with a fixed SST in the control case, in the experiments, we both increased and decreased the SST by 2℃. Figs.8 and 9 show that the SST significantly affects the air pressure at the cyclonic center, but has little influence on the movement path. Compared with the control experiment, a 2℃ increase in the SST reduces air pressure at the cyclonic center, and a 2℃ decrease in the SST has the opposite effect. Both the control experiment and the SST sensitivity test show lower air pressures at the EC center compared with the air pressure in the FNL reanalysis data. This outcome may be associated with errors produced by the FNL model during interpolation as well as those innate to the model itself. These effects require further detailed study of the model’s physical processes; SST does not influence air pressure at the cyclonic center in a linear fashion. When small changes are made to the SST, the air pressure at the cyclonic center responds more obviously to an increased rather than a decreased SST. Air pressure at the cyclonic center is also more sensitive to SST at higher temperatures. Fig.10 shows the effects of the warm-core structure on SST changes. An increase in SST will produce a stronger warm-tongue concavity, which slightly strengthens the cold front to the west of the cyclonic center at the lower layer of the tropopause. A decrease in SST will cause weakenings in the warm-tongue concavity and cold front to the west of the cyclonic center. Changes in SST will alter the heat budget of the sea surface and the vapor distribution in the lower layer. As the SST increases, the increase in vapor and latent heat is conducive to the baroclinity and circulation at the lower layer, which, in turn, allows the cyclone to develop. Fig.11 shows the PV distribution in the lower tropopause with respect to SST changes, in which we can see that the maximum PV in the lower tropopause increases markedly with increases in the SST, whereas decreasing SST causes a significant reduction in vorticity. The SST increases the latent heat in the middle and lower layers, which enhances the PV and causes more intense cyclonic development.

Table 1 Main parameter settings for WRF model

Fig.8 Trajectories of the cyclonic center provided by the WRF model simulation result. Black solid lines indicate the trajectory of the cyclonic center. Red dashed lines indicate SST minus 2K; green dashed lines indicate SST plus 2K; black dashed lines are the control test. Solid dots indicate the cyclone’s outbreak process and the hollow dots its non-breakout process.

Fig.10 Contrast in warm core structure simulated by WRF model at 00 UTC 12 January 2012. Potential temperature (red dashed contours, 8K interval) and air temperature (black solid contours, 8K interval). (a) Controlled experiment; (b) SST+2K; (C) SST−2K. The location of the cyclone center is indicated by the solid circle and the arrow.
6.2 Latent Heat Release (LHR) Test
As reported by Hoskins (2015), PV is regarded as ‘a major weapon in the armory of atmospheric scientists when viewing data from the real atmosphere or from computer models simulating it’. Campa and Wernli (2012) studied high PV in the layers between 650hPa and 950hPa, which corresponds to the lower-tropospheric part of a PV tower. The authors attributed a high positive PV to a diabatic process. Classic PV dynamics predict that diabatic heating in the middle atmosphere will result in a PV dipole with negative PV anomalies above and positive PV anomalies below (Hoskins and James, 2014). Pang and Fu (2017) studied the sources of high PV in the middle to upper troposphere (500–200hPa), lower troposphere (950–500hPa), and near the surface (below 950hPa), and concluded that only high PV in the lower troposphere is mainly associated with LHR.
The above studies illustrate the close association between high PV in the middle to lower troposphere and non-adiabatic heating. As LHR is an important source of non-adiabatic heating, we studied latent heat to explore why there is a maximum PV in the middle to lower layers and to determine its influence on cyclonic development. The LHR test model domain reveals a horizontal grid resolution of 10 km, with 500×450 grids in the horizontal, 44 full-sigma (σ) levels in the vertical, and an integral time step of 30 seconds. In the parameters of the SST sensitivity test, the cumulus parameterization model was excluded and there was no LHR. The other parameter settings were consistent with those of the SST sensitivity test. Fig.12 shows the effects of PV in the middle to lower layer without releasing any latent heat. Compared with Fig.6b, we can see that the PV in the middle to lower troposphere has weakened noticeably. As such, we can conclude that LHR influences the development of maximum PV in the middle to lower layers. The maximum central pressure of the latent heat sensitivity test decreased at a rate of 2.0hPah−1, which is less than the control experiment rate of 2.9hPah−1. This proves that LHR is an important factor in explosive cyclonic development.
7 Conclusions
In this paper, we conducted diagnostic analyses of the EC outbreak in the northwestern Pacific between January 10 and 13, 2012, as well as sensitivity tests. Our main conclusions are as follows.

Fig.11 Analysis of PV distribution simulated by WRF model at 00 UTC 12 January 2012. Potential temperature (red dashed contours, 8K interval) and PV (blue shaded, 1PVU interval). (a) Controlled experiment; (b) SST+2K; (C) SST−2K. The location of the cyclone center is indicated by the solid circle and the arrow.

Fig.12 Analyses of PV distribution simulated by LHR sensitivity test at 00 UTC 12 January 2012. Potential temperature (red dashed contours, 8K interval) and PV (blue shaded, 1PVU interval). The location of the cyclone center is indicated by the solid circle and the arrow.
The EC started its explosive development east of Japan at 11:00 UTC on January 11, 2012 and moved northeastward. After changing paths twice, the EC arrived at a location south of the Kamchatka Peninsula. The strong frontal and warm core structures near the cyclonic center provided favorable dynamic and thermal conditions for cyclonic development. An EC can develop rapidly when the frontal structure approaches the cyclonic center, and it will weaken when the front departs from the center and gradually occludes. The downward movement of the high potential vortex area in the upper troposphere and stratosphere enhance cyclonic circulation and convergence. Air currents ascending at a tilt give more order to the air inflow and outflow and stabilize the cyclonic structure. The involvement of dry cold air in the middle troposphere is conducive to meso- and micro-scale vertical circulation. Low-level jet streams destabilize the middle and lower troposphere, uplift the convergence, and supply adequate water vapor and energy to the cyclonic center.
Previous studies have rarely revealed the role of SST in the evolution of ECs. In this study, we demonstrated that SST plays an important role in EC evolution. In particular, a warmer ocean surface (SST+2K test) tends to intensify the EC. The SST sensitivity test results show that neither SST+2K of SST−2K have much effect on the EC’s path, whereas they both have a great effect in changing the air pressure of the cyclone center and the PV in the lower troposphere. In addition, the EC is more sensitive to a warmer ocean surface (SST+2K test) than it is to a cooler ocean surface (SST−2K) during its period of explosive development. Changes in the SST alter the latent and sensible heat distributions of the sea surface, which affect the warm tongue in the lower troposphere. Increases in SST will greatly expand the high vorticity area in the middle to lower troposphere.
Previous work on LHR’s effect on the evolution of ECs in terms of PV have suggested that LHR plays an important role in the evolution of ECs. Our study results are consistent with this conclusion. Without a LHR, there is no large PV anomaly in the lower troposphere.
Acknowledgements
This study is supported by the National Key R&D Program of China (Nos. 2017YFC1404100 and 2017YFC1404101), the National Natural Science Foundation of China (Nos. 41305086, 41775042 and 41275049).
Bleck, R., 1974. Short-range prediction in isentropic coordinates with filtered and unfiltered numerical models., 102 (12): 813-829.
Brand, S., 1970. Interaction of binary tropical cyclones of the western North Pacific Ocean., 9 (3): 433-441.
Campa, J., and Wernli, H., 2012. A PV perspective on the vertical structure of mature midlatitude cyclones in the Northern Hemisphere., 69: 725-740, DOI: 10.1175/JAS-D-11-050.1.
Chen, S. J., Kuo, Y. H., Zhang, P. Z., and Bai, Q. F., 1992. Climatology of explosive cyclones off the East Asian coast., 120 (12): 3029-3035.
Dines, W. H., 1915. Circulation and temperature of the atmosphere., 43 (11): 551-556.
Dudhia, J., 1989. Numerical study of convection observed during the winter monsoon experiment using a mesoscale two-dimensional model., 46 (20): 3077-3107.
Guo, D. M., and Ding, Z. Y., 2005. Numerical studies on the relationship between latent heat and inertial stability and the development of explosive cyclones., 28 (6): 794-800.
Heo, K. Y., Seo, Y. W., Ha, K. J., Park, K. S., Kim, J., Choi, J. W., Jun, K., and Jeong, J. Y., 2015. Development mechanisms of an explosive cyclone over East Sea on 3–4 April 2012., 70: 30-46, DOI: 10.1016/j.dynatmoce.2015.03.001.
Hirata, H., Kawamura, R., Kato, M., and Shinoda, T., 2015, Influential role of moisture supply from the Kuroshio/Kuroshio Extension in the rapid development of an extratropical cyclone., 143: 4126-4144, DOI: 10.1175/MWR-D-15-0016.1.
Hong, S. Y., Noh, Y., and Dudhia, J., 2006. A new vertical diffusion package with an explicit treatment of entrainment processes., 134 (9): 2318-2341.
Hoskins, B. J., 2015. Potential vorticity and the PV perspective., 32: 2-9, DOI: 10.1007/s00376-014-0007-8.
Hoskins, B. J., and James, I. N., 2014., Wiley-Blackwell, New Jersey, 432pp.
Hoskins, B. J., McIntyre, M. E., and Robertson, A. W., 1985. On the use and significance of isentropic PV maps., 111 (470): 877-946.
Iizuka, S., Shiota, M., and Kawamura, R., 2013. Influence of the monsoon variability and sea surface temperature front on the explosive cyclone activity in the vicinity of Japan during northern winter., 9 (4): 1-4.
Iwao, K., Inatsu, M., and Kimoto, M., 2012. Recent changes in explosively developing extratropical cyclones over the winter northwestern Pacific., 25: 7282-7296, DOI: 10.1175/JCLI-D-11-00373.1.
Kain, J. S., and Fritsch, J. M., 1990. A one-dimensional entraining/detraining plume model and its application inconvective parameterization., 47 (23): 2784-2802.
Li, C. Q., and Ding, Y. H., 1989. A diagnostic study of an explosively deepening oceanic cyclone over the Northwest Pacific Ocean., 47 (2): 180-190(in Chinese with English abstract).
Lin, Y. L., Farley, R. D., and Orville, H. D., 1983. Bulk parameterization of the snow field in a cloud model., 22 (6): 1065-1092.
Mlawer, E. J., Taubman, S. J., Brown, P. D., Iacono, M. J., and Clough, S. A., 1997. Radiative transfer for inhomogeneous atmospheres: RRTM, a validated correlated-k model for the longwave., 102 (D14): 16663-16682.
Pang, H. J., and Fu, G., 2017. Case study of potential vorticity tower in three explosive cyclones over Eastern Asia.,74 (5): 1445-1454, DOI: 10.1175/JAS-D-15-0330.1.
Qin, Z. H., Li, Y. P., and Huang, L. W., 2002. Climatology of the extratropical cyclones over the East China Sea and the West Pacific., 24 (S1): 105-1110 (in Chinese with English abstract).
Roebber, P. J., 1984. Statistical analysis and updated climatology of explosive cyclones., 112 (8): 1577-1589.
Rogers, E., and Bosart, L. F., 1986. An investigation of explosively deepening oceanic cyclones., 114 (4): 702-718.
Sanders, F., 1986. Explosive cyclogenesis in the west-central North Atlantic Ocean, 1981–84. Part I: Composite structure and mean behavior., 114 (10): 1781-1794.
Sanders, F., and Gyakum, J. R., 1980. Synoptic-dynamic climatology of the ‘bomb’., 108 (10): 1589-1606.
Uccellini, L. W., Keyser, D., Brill, K. F., and Wash, C. H., 1985. The Presidents’ Day cyclone of 18–19 February 1979: Influence of upstream trough amplification and associated tropopause folding on rapid cyclogenesis., 113 (6): 962-988.
Wang, S., 2013. Analyses and numerical modeling of an explosive extratropical cyclone over the Northwestern Pacific. Master thesis.(in Chinese with English abstract).
Yi, Q. J., and Ding, Y. H., 1993. Climatology of the explosive cyclogenesis over East Asia and the West Pacific., 17 (3): 302-309(in Chinese with English abstract).
Yoshida, A., and Asuma, Y., 2004. Structures and environment of explosively developing extratropical cyclones in the northwestern Pacific region., 132 (5): 1121-1142.
Yoshiike, S., and Kawamura, R., 2009. Influence of wintertime large-scale circulation on the explosively developing cyclones over the western North Pacific and their downstream effects., 114: D13110, DOI: 10.1029/2009JD011820.
Zhao, H., Yang, X. L., Xing, J. Y., and Zhou, L. X., 2007. The analysis of a Yellow Sea cyclone with WRF and MM5., 24 (2): 1-8 (in Chinese with English abstract).
April 25, 2018;
June 19, 2018;
July 20, 2018
© Ocean University of China, Science Press and Springer-Verlag GmbH Germany 2022
. Tel: 0086-532-66781305
E-mail: pengyuanli@ouc.edu.cn
(Edited by Xie Jun)
 Journal of Ocean University of China2022年4期
- Journal of Ocean University of China的其它文章
- The Role of Bottom Currents on the Morphological Development Around a Drowned Carbonate Platform, NW South China Sea
- Controls on the Gas Hydrate Occurrence in Lower Slope to Basin-Floor, Northeastern Bay of Bengal
- Effective Elastic Thickness of the Lithosphere in the Mariana Subduction Zone and Surrounding Regions and Its Implications for Their Tectonics
- Geophysical Evidence for Carbonate Platform Periphery Gravity Flows in the Xisha Islands, South China Sea
- Seismic Characteristics and Hydrocarbon Accumulation Associated with Mud Diapir Structures in a Superimposed Basin in the Southern South China Sea Margin
- Simulation and Analysis of Back Siltation in a Navigation Channel Using MIKE 21