
Designing a P2-type cathode material with Li in both Na and transition metal layers for Na-ion batteries
2022-09-24 08:04JianxiangGao高健翔KaiSun孙凯HaoGuo郭浩ZhengyaoLi李正耀JianlinWang王建林XiaobaiMa马小柏XuedongBai白雪东andDongfengChen陈东风
Chinese Physics B 2022年9期
Jianxiang Gao(高健翔) Kai Sun(孙凯) Hao Guo(郭浩) Zhengyao Li(李正耀)Jianlin Wang(王建林) Xiaobai Ma(马小柏) Xuedong Bai(白雪东) and Dongfeng Chen(陈东风)
1China Institute of Atomic Energy,Beijing 102413,China
2State Key Laboratory for Surface Physics,Institute of Physics,Chinese Academy of Sciences,Beijing 100190,China
Keywords: Na0.7Ni0.35Mn0.65O2,Li-doping,P2-type cathode,Na-ion batteries
1. Introduction
The rapid development and widespread applications of Li-ion batteries(LIBs)have caused the increasing demand and cost of lithium resources. Na-ion batteries (NIBs), due to the high abundance and uniform distribution of Na sources,are considered as an appealing alternative to Li-ion batteries (LIBs), especially on applications of large-scale energy storage.[1-3]The cathode materials with various structures,including layered transition metal oxides,[4-9]Na super ionic conductors(NASICON),[10,11]prussian blue analogues,[12-15]and organic compounds,[16]etc., have been synthesized and investigated. Among these materials, layered transitionmetal oxides (NaxTMO2, TM = transition metal) are one of the most promising candidates for commercial application due to their feasible preparation process and high theoretical capacity.[17,18]According to the coordination environments of Na and stacking modes of oxygen, NaxTMO2have been mainly classified into P2 and O3 types, proposed by Delmas.[19]“P” and “O” represent that Na+ions are coordinated in prismatic and octahedral environments, respectively,while the number“2”or“3”refers to the repeated layers in an unit cell. Compared with the O3-type structure, Na ions can migrate between neighboring prismatic sites directly in the P2-type structure, which results in a lower diffusion barrier and therefore enhanced rate performance.[20,21]
However, the P2-type structures suffer from the complicated phase transition and Na+/vacancy ordering, leading to step-like voltage curves, capacity decay, and poor cycling life.[22,23]For example, although P2-Na2/3Ni1/3Mn2/3O2delivers a high-operation voltage and high capacity, it still has problems such as the severe capacity fading by the P2-O2 phase transition when charging to above 4.0 V.[24,25]To improve the cycling stability, element doping (Cu, Ti, Mg, F,etc.),[26-30]and surface coating[31]have been proven to be effective strategies. Previous reports show that Li-doping can stabilize the structure by suppressing the Jahn-Teller effect of Mn3+and delaying the detrimental phase transitions.[32,33]Considering that the ionic radius of Li+(0.76 ˚A)is similar to that of Ni2+(0.69 ˚A),the Li-ions doped in layered NaxTMO2tends to occupy the TM layers.[34,35]In addition, with increasing the amount of Li, extra diffraction peaks at~18°and~41°appear, which can be assigned to the monoclinic Li2MnO3component (C2/m) or the rhombohedral O3-type structure(R¯3m).[36,37]
In this work, we have successfully synthesized the phase-pure samples of Li-free Na0.7Ni0.35Mn0.65O2(Li0),Na0.75[Li0.05Ni0.3Mn0.65]O2with Li-doping in the TM layers(Li5),and Na0.7Li0.05[Li0.05Ni0.3Mn0.65]O2with Li-doping in both the Na and TM layers simultaneously (Li10). The xray diffraction results show that Li ions locate at the TM layers in the Li5 sample and both the TM layers and Na layers in the Li10 sample. The electrochemical performance results demonstrate that the rate and cycle performance are improved after Li doping. In the voltage range of 2.0-4.0 V,the capacity of Li-free Li0 electrode is only~39 mAh/g at 10 C,while the Li-doped Li5 and Li10 electrodes can display the capacities of about 65 and 64 mAh/g at 10 C, respectively. The Li0, Li5,and Li10 electrodes deliver the capacity retentions of 76.5%,81.7%,and 88.5%after 300 cycles in the voltage range of 2.0-4.0 V, respectively, indicating the enhanced cycling stability after Li-doping.
2. Experiment
2.1. Material synthesis
Na0.7Ni0.35Mn0.65O2(Li0), Na0.75[Li0.05Ni0.3Mn0.65]O2(Li5), and Na0.7Li0.05[Li0.05Ni0.3Mn0.65]O2(Li10) samples were synthesized by a solid-state method using Na2CO3(99%), Li2CO3(99%), NiO(99%), and MnO2(98%)as precursors. The raw materials were mixed and ground in an agate mortar for 25 min and pressed into a pellet under a pressure of 12 MPa. Then these pellets were fired at 950°C for 15 h in muffle furnace under air and cooled to room temperature naturally.
2.2. Structure characterization
X-ray diffraction (XRD) patterns were collected on an x-ray diffractometer (D8 Bruker) using CuKαradiation by measuring the diffraction angle (2θ) range of 10°-70°. The refinements of XRD data were performed with FullProf software using the Rietveld method.[38]The morphology and microstructure were investigated by a scanning electron microscope(SEM,Gemini 300)and a high-resolution transmission electron microscope(HRTEM,FEI Tecnai F20).
2.3. Electrochemical measurement
These working electrodes were prepared by spreading the slurry of the active materials, acetylene black and the polyvinylidene fluoride (PVDF) binder with a weight ratio of 8:1:1 on Al foil. Then these electrodes were dried at 120°C under vacuum for 10 h. The coin-type cells(CR2032)were assembled with Na foil as the counter electrode, 1.0 M NaClO4/propylene carbonate (PC) with 5% fluoroethylene carbonate (FEC) in volume as electrolyte and a glass fiber(GF/D)as the separator in an argon-filled glove box. The electrochemical testing on different voltage ranges was carried out using a Neware CT-4000 battery test system.
3. Results and discussion
The crystal structures of the Na0.7Li0.05[Li0.05Ni0.3Mn0.65]O2 (Li10), Na0.75[Li0.05Ni0.3Mn0.65]O2(Li5), and Na0.7Ni0.35Mn0.65O2(Li0) were initially characterized using x-ray diffraction (XRD). As shown in Fig. 1(a), all the samples can be indexed to the P2-type structure (space group ofP63/mmc) without any second phase. The influence of higher Li content on the crystal structure was also investigated. The Na0.66Li0.09[Li0.05Ni0.3Mn0.65]O2and Na0.68Li0.07[Li0.05Ni0.3Mn0.65]O2samples with higher Li content show the extra weak diffraction peak at around 18°in Fig.S1,which can be assigned to the monoclinic Li2MnO3component(C2/m),consistent with the previous reports.[36,37]Therefore, the three pure P2-phase samples of Li0, Li5 and Li10 are mainly studied in this work. The XRD patterns of the Li0,Li5 and Li10 are further refined based on the Rietveld method. It can be seen in Figs. 1(b)-1(d) that the refinement results are well in agreement with the observed data.

Fig.1. (a)XRD patterns of the Li10,Li5,and Li10 samples. Refined XRD patterns and the SEM images of(b)Li0,(c)Li5,and(d)Li0.
The corresponding lattice parameters, atomic occupancies and isotropic displacement parameters are presented in Tables S1-S3. Figure 2 exhibits the reconstructed crystal structure of the Li0, Li5, and Li10 samples according to the XRD refinements. For all the samples, Ni2+ions and Mn4+ions locate at the 2a(0,0,0) site, while the Na ions locate at the two prismatic sites in the Na layer(2b(0,0,0.25)site and 2d(0.6667,0.3333,0.25)site). The Li ions locate at 2asites in the TM layers in the Li5 material host, while the Li ions locate at both the TM layers and Na layers simultaneously in the Li10 material host.
As shown in Table 1, Li doping has little impact on the lattice parametera, which is consistent with the previous report.[39]This may be related to the similar sizes of Li+(0.76 ˚A) and Ni2+(0.69 ˚A), because the lattice parameterarepresents the atomic distance in theabplane.On the contrary,the lattice parametercreduces significantly after Li doping.The reduced Na shielding effect by a higher Na/Li content in Li5 and Li10 compared with Li0 can account for the reduction in lattice parameterc.[40]

Fig.2. Reconstructed crystal structures of(a)Li0,(b)Li5,and(c)Li10 materials.

Table 1. Lattice parameters obtained by using Rietveld refinements.
The morphologies of Li0, Li5, and Li10 samples were investigated by scanning electron microscopy(SEM).As presented in Figs. 1(b)-1(d), the as-prepared samples are composed of blocky-shaped particles and the distribution of particle size is in the range of 2-6µm. The high-resolution transmission electron microscopy (HRTEM) image of the Li10 sample in Fig.3(a)reveals that the interplanar spacing of lattice fringes is~0.250 nm,which matches well with the(100)plane of the P2-type structure. Selected-area electron diffraction (SAED) was applied to obtain the specific structural information of Li10 in Fig. 3(b). The bright spots can be indexed to the representative reflections of the P2-type structure viewed along the [001] axis. Figures 3(c)-3(g) show the energy-dispersive spectroscopy (EDS) mapping of Li10,which indicate that Na,Ni,Mn and O elements are uniformly distributed in the Li10 material.

Fig.3. Characterization of the as-prepared Li10 material. (a)HRTEM image, (b)SAED pattern, and(c)-(g)TEM-EDS mapping results for the selected elements.
The electrochemical performances of Li0, Li5, and Li10 electrodes were investigated by galvanostatic charge/discharge tests. Figures 4(a)-4(c)show the first three charge-discharge profiles of these electrodes in the voltage range of 1.5-4.2 V versus Na+/Na at a rate of 0.1 C. The Li0 electrode shows several voltage plateaus, which are closely related to the P2-O2 phase transition and Na+/vacancy ordering.[22,25]It can be observed that Li5 and Li10 electrodes exhibit the smoother charge/discharge curves, indicating the suppressed phase transition and Na+/vacancy ordering, similar to the reported Na1.0Li0.2Ni0.25Mn0.7O2[41]and Na0.8[Li0.12Ni0.22Mn0.66]O2.[33]Figure 4(d) shows the cycle performances of Li0, Li5 and Li10 electrodes at 0.5 C in the voltage range of 1.5-4.2 V. The results demonstrate that Li doping can improve the capacity retention from 46.9%of Li0 to 70.0%of Li5 and 80.7%of Li10. The improvement of capacity retention can be attributed to the stabilized structure by Li doping.[32,42]
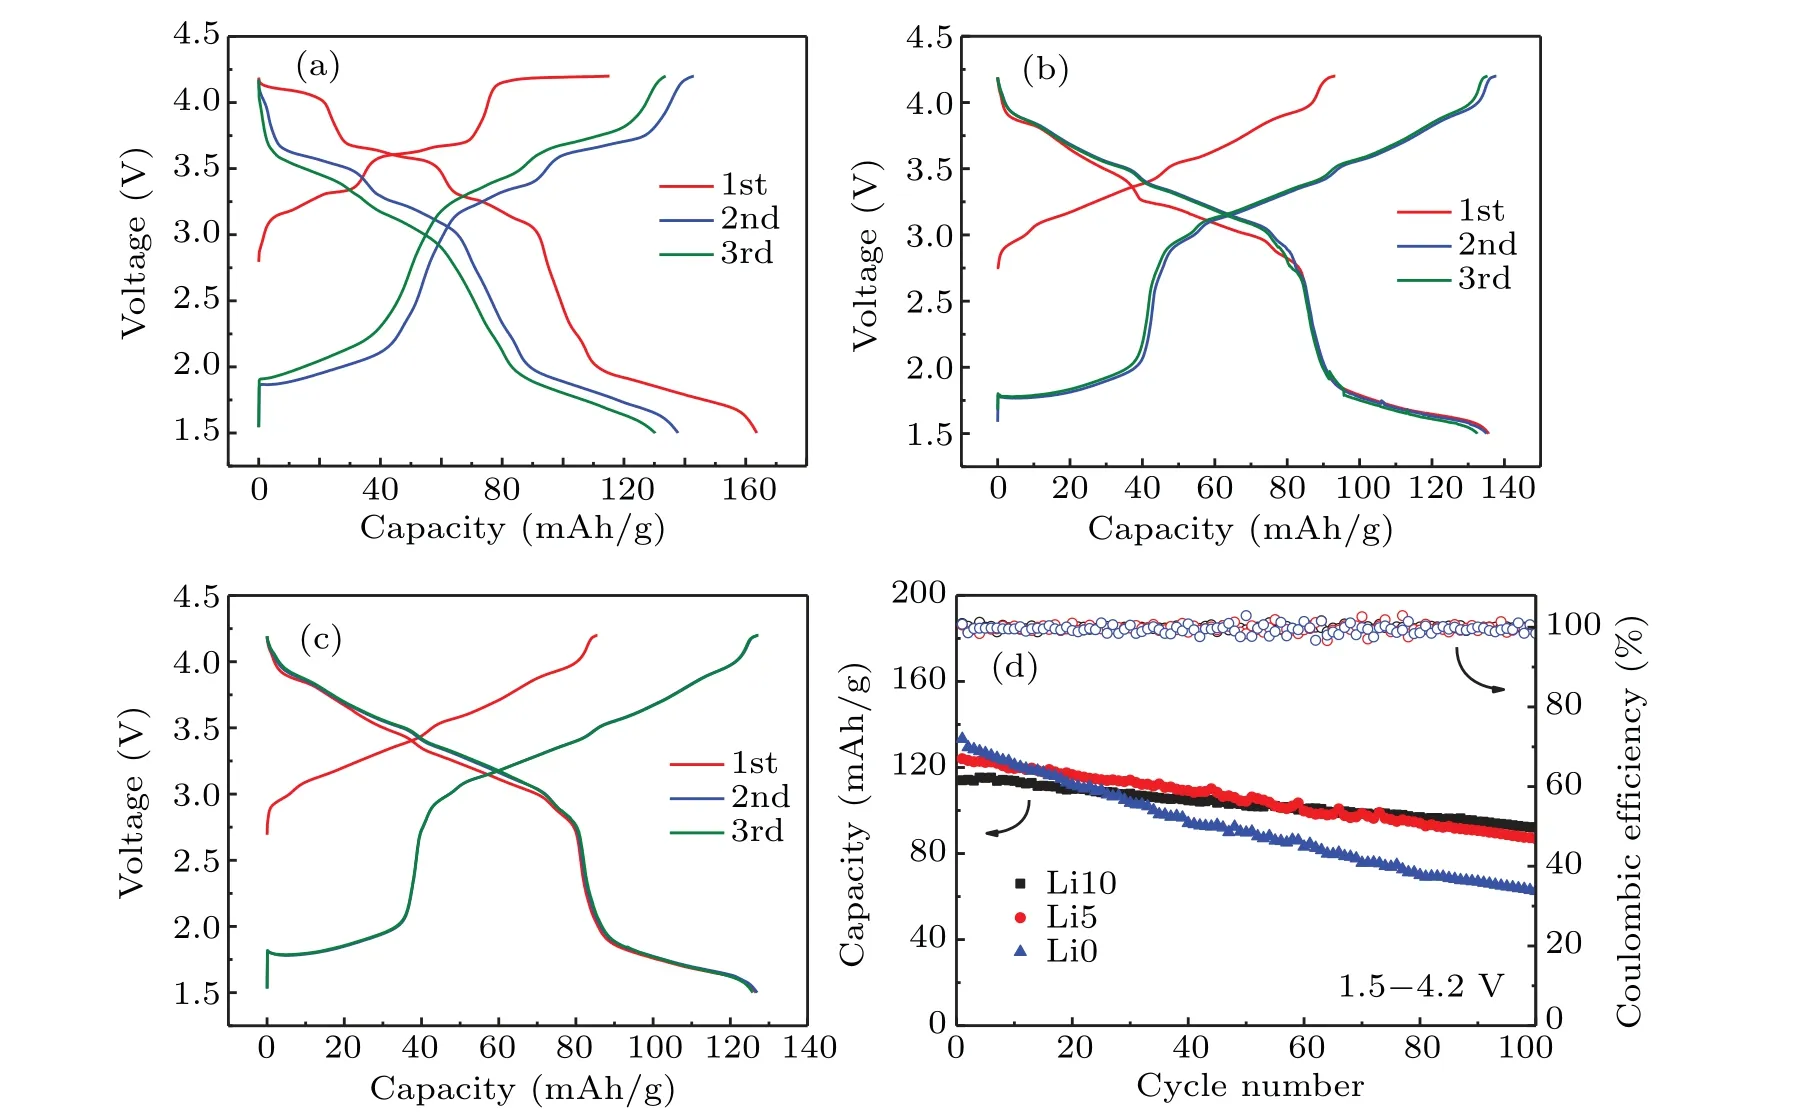
Fig.4.Charge-discharge profiles of(a)Li0,(b)Li5,and(c)Li10 at 0.1 C in the voltage range of 1.5-4.2 V vs.Na+/Na.(d)Cycle performances of the Li0,Li5,and Li10 electrodes at 0.5 C after 100 cycles in the voltage range of 1.5-4.2 V.
To investigate the influence of Li-doping in different voltage ranges, the cycle performance was studied in the voltage ranges of 1.5-4.0 V,2.0-4.2 V,and 2.0-4.0 V,and the results are shown in Fig.S2 in the supporting information.The capacity retention of Li0,Li5,and Li10 electrodes in various voltage ranges are presented in Table 2. It can be found that the cycle performances in different voltage ranges are improved after Li doping. For example, the capacity retention of Li0 is 91.4%in the voltage range of 2.0-4.0 V, which increases to 95.2%of Li5 and 97.1%of Li10,respectively. Previous reports have proved that the Mn4+/Mn3+redox causes the structure instability due to the Jahn-Teller effect of Mn3+when the voltage is lower than 2.0 V.[22,24]On the other hand,the P2-type cathodes always undergo the detrimental P2-O2 phase transformation with a large volume change upon charging to over 4.0 V,causing the severe capacity fading.[25,43]The study indicates that the electrodes exhibit the best cycle performance in the voltage range of 2.0-4.0 V.[42,44]
Figure 5(a)exhibits the long-term cycle performances of Li0, Li5, and Li10 electrodes at 0.5 C in the voltage range of 2.0-4.0 V. The capacity retentions of Li0, Li5, and Li10 electrodes after 300 cycles are 76.5%, 81.7%, and 88.5%.The Li10 electrode with Li doping in both the Na and TM layers simultaneously exhibits the best cycling stability. Figure 5(b)further compares the rate performances of these electrodes at different current densities in the voltage range of 2.0-4.0 V.The capacities of Li0 electrode are 93, 89, 81, 60, and 39 mAh/g at the rates of 0.1,0.5,2,5,and 10 C,respectively.Interestingly, the Li10 electrode delivers the capacities of 92,89,84,75,and 64 mAh/g,respectively,which are almost equal to those of Li5 electrode. These results demonstrate that Li doping can improve cycling stability and rate performance.

Table 2. The capacity retention of Li0, Li5, and Li10 electrodes at 0.5 C after 100 cycles in different voltage ranges.

Fig.5. (a)Cycle performances of the Li10, Li5, and Li0 electrodes at 0.5 C after 300 cycles in the voltage range of 2.0-4.0 V. (b) Rate performances of the Li0, Li5, and Li10 electrodes in the voltage range of 2.0-4.0 V at various rates.

Fig.6. Ex situ XRD patterns of Li10 at different charge/discharge states: (a)the enlargement parts of the(002)peak, (b)the whole patterns between 10° and 70°,(c)the corresponding charge/discharge profiles during the ex situ XRD tests.
To investigate the influence of Li doping on structure evolution during the charge and discharge process, theex situXRD patterns of Li10 electrode at different voltages are collected.As demonstrated in Fig.6,the(002)diffraction peak of Li10 electrode shifts continually to lower angle upon charging,corresponding to the expansion of the interlayer distance. In the subsequent discharging course, the(002)diffraction peak when discharged to 1.5 V shifts to an angle higher than pristine state due to extra sodium intercalated into electrode. It is noteworthy that there is not any new peaks appearing in the whole charging and discharging course, indicating that the P2-type structure is maintained well without the common P2-O2 phase transition.[25]This solid-solution reaction contributes to the excellent cycle retention and good rate performance. HRTEM is also used to analyze the microstructure changes after cycling. As shown in Fig. S3(a) in the supporting information,it can be observed that the HRTEM image of Li0 electrode charged at 4.2 V shows the dislocation. This phenomenon is absent in the HRTEM image of the Li-doped Li10 electrode in Fig.S3(b),which is helpful for improving cycling stability.Theseex situXRD and HRTEM results prove that Li doping can suppress the P2-O2 phase transition and enhance structure stability,thus improving cycling stability.
4. Conclusion
In summary,a series of Li0,Li5,and Li10 cathode materials are synthesized by a solid-state method. The XRD results show that Li ions can incorporate in both the Na and transition metal layers. Electrochemical measurement results demonstrate that Li doping can largely improve the cycle and rate performance. The Li-doped Li5 andLi10 electrodes deliver 65 and 64 mAh/g at the high rate of 10 C,while Li-free Li0 electrode only delivers 39 mAh/g at 10 C in the voltage range of 2.0-4.0 V. The Li10 electrode exhibits the excellent cycling stability in the voltage range of 2.0-4.0 V with the capacity retention of 88.5% after 300 cycles, higher than those of Li0 and Li5 electrodes.Ex situXRD and HRTEM results show that P2-phase maintains well after Li doping, thus enabling improved electrochemical performances. It can be concluded that incorporating Li into both the Na and transition metal layers of P2-type cathodes is a useful strategy for designing highperformance cathode materials in Na-ion batteries.
Acknowledgements
Project supported by the National Natural Science Foundation of China(Grant Nos.12105372 and 51991344),President’s Foundation of China Institute of Atomic Energy(Grant No.16YZ202212000201),and Chinese Academy of Sciences(Grant No.XDB33000000).
猜你喜欢
关东学刊(2022年5期)2022-10-21
Chinese Physics B(2022年4期)2022-04-12
小学生必读(低年级版)(2021年5期)2021-08-14
女报(2021年4期)2021-05-06
汽车观察(2021年11期)2021-04-24
小哥白尼(军事科学)(2020年3期)2020-07-27
车迷(2019年10期)2019-06-24
散文诗(2017年15期)2018-01-19
校园英语·下旬(2017年10期)2017-09-27
太空探索(2016年8期)2016-07-10
- Chinese Physics B的其它文章
- Characterizing entanglement in non-Hermitian chaotic systems via out-of-time ordered correlators
- Steering quantum nonlocalities of quantum dot system suffering from decoherence
- Probabilistic quantum teleportation of shared quantum secret
- Spin–orbit coupling adjusting topological superfluid of mass-imbalanced Fermi gas
- Improvement of a continuous-variable measurement-device-independent quantum key distribution system via quantum scissors
- An overview of quantum error mitigation formulas