
Parametric decay instabilities of lower hybrid waves on CFETR
2022-09-24 08:00TaotaoZhou周涛涛NongXiang项农ChunyunGan甘春芸GuozhangJia贾国章andJialeChen陈佳乐
Chinese Physics B 2022年9期
Taotao Zhou(周涛涛) Nong Xiang(项农) Chunyun Gan(甘春芸)Guozhang Jia(贾国章) and Jiale Chen(陈佳乐)
1Institute of Plasma Physics,Hefei Institutes of Physical Science,Chinese Academy of Sciences,Hefei 230031,China
2University of Science and Technology of China,Hefei 230026,China
3Centre of Magnetic Fusion Theory,Chinese Academy of Sciences,Hefei 230031,China
Keywords: lower hybrid,parametric instability,CFETR
1. Introduction
In order to maintain the steady-state operation in a tokamak,a substantial net toroidal plasma current is required.[1,2]Besides the bootstrap current, additional currents should be driven for the flexible control of the current profile.[3]The lower hybrid current drive (LHCD) system has been widely adopted in tokamak due to its high efficiency since the first successful demonstration in the PLT tokamak.[4]Recently,it also became a candidate for sustaining plasma current in operation scenarios of China Fusion Engineering Test Reactor (CFETR), a future bridging device between ITER and DEMO.[5,6]However,in some pioneering LHCD experiments with high densities(ne>0.8×10²⁰m-3),sudden loss of fast electrons and current drive efficiency was detected,[7-9]which may also happen on CFETR with higher densities. The phenomenon results from the power depletion at the plasma edge induced by the nonlinear effects of the injected lower-hybrid(LH)wave.[10]One of the most promising mechanisms is the parameter instability(PI).[11]
The PI process describes that a pump wave delivers its energy to two child waves when the pump power exceeds its nonlinear threshold.[10]It has been widely studied since 1970s when it was used to explain the power coupling failure in the LH heating experiments.[12-15]By solving the Vlasov equation under a dipole electric field approximation near the LH frequency, the nonlinear dispersion relation describing the PI process was first established by Porkolab.[16]Based on the results of the dispersion relation and other contemporaneous approaches, various possible decay channels were discussed in different parameter limits.[17]For the LHCD experiments in tokamaks, only two of the decay channels are found to be important.[11]One refers to the child-mode combination of a low-frequency ion cyclotron quasi-mode (ICQM) and an LH sideband with a small frequency shift. It is a possible reason for the observed non-monotonic envelope in the frequency spectra.[18,19]The other is the combination of an ion sound quasi-mode (ISQM) and an LH sideband, which causes the frequency broadening.[10]In the critical work of Cesarioet al.,[20]the ISQM-type PI was also found to be able to affect the LH deposition process through the spectral broadening on the parallel refractive indexn‖.
Since an increased temperature or a decreased density was found to be able to reduce PIs of the two decay channels,[21,22]inspiring progress has been made in recovering the LHCD efficiency by mitigating PI in recent high-density experiments. Frascati Tokamak Upgrade (FTU) is the first tokamak achieving high-efficiency LHCD in a line-averaged density of 1.5×10²⁰m-3with PIs suppressed through increasing the edgeTe.[23]In EAST,the LHCD efficiency is recovered by decreasing edge density with strong wall lithiation.[24]In experiments of Alactor-C Mod, efficient LHCD was realized with reduced density shoulders.[25,26]

Fig. 1. The ne-Te distribution of SOL plasma in Alactor-C Mod,[25]CFETR,[28] DEMO,[27] EAST,[30] FTU,[23] ITER,[27] and JET.[29]These SOL ne-Te lines start from the antenna grill and end up at their own separatrix.
To learn the nature of PI in CFETR or other situations with unforeseen parameter sets, understanding the parameter dependence is crucial. Besides a lowerneand a higherTe, a lower PI has also been found to be related to a higher magnetic fieldB0, a higher pump frequencyω0, and a higher ion mass based on numerical parameter scanning.[21,22]However,it is still hard to apply the existing conclusion to CFETR as the change of the parameter regime can also affect the parameter dependence. For example,the ICQM growth rate for JET-like parameters increases linearly withne,[22,31]while for FT parameters it increases withneat a weakening speed.[11]For the density range in the edge regions of JET, EAST and C-Mod, the ISQM growth rate decreases withneat low densities (<2.0×10¹⁸m-3) but increases at high densities.[22]As for the dependence onn‖of the child mode, the growth rate increases withn‖at a low density (2.5×10¹⁷m-3), but decreases at a high density (1.0×10¹⁸m-3).[29]Therefore,analytical analysis is required for determining the division of parameter regimes. As will be seen in this paper, a key parameter dividing the regimes will be found by analyzing the dispersion relation of the low-frequency mode. The characteristic of each regime will be studied, as well as some possible new decay channels and parameter dependence.
The rest of the paper is organized as follows. The nonlinear dispersion relation we solved is introduced in Section 2.In Section 3,the PI decay channels and parameter dependence in different parameter limits are discussed by analyzing the PI growth rates, while the numerical solutions are also given to verify the validity. In Section 4, the analytical formula is further applied to investigate the PIs on CFETR. Finally, the summary is presented in Section 5.
2. Physical model
The widely used nonlinear dispersion relation,derived by Porkolab in the electrostatic framework with full-kinetic ions and drift-kinetic electrons,[16,18]is applied in this paper to describe the PI process of an LH pump. Here, a homogeneous and collisionless plasma is considered with a magnetic fieldB0in thezdirection of Cartesian coordinates. For simplicity, the density and temperature of ions and electrons can be assumed to be the same (ni≃ne,Ti≃Te). An LH eigenmode (ω0,k0) with a high amplitude electric fieldE0oscillates in the plasma as the pump wave,whereω0is the angular frequency andk0is the wave number. The pump wave decays into a low-frequency mode (ω,k) and an LH sideband(ω1,k1)or(ω2,k2),where the selection rulesω1,2=ω ∓ω0,k1,2=k ∓k0are satisfied. When the LH sideband(ω1,k1)is resonant, the sideband(ω2,k2)becomes non-resonant and its contribution is negligible as compared to the resonant one.[32]The dispersion relation based on the above assumptions takes the form
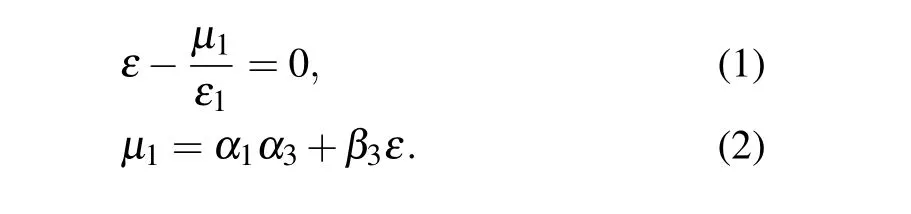
Here,εis the linear dispersion relation of the low-frequency mode and takes the form

withωcebeing the electron cyclotron frequency.
The coupling coefficientα1corresponds to the pumpsideband quasi-linear coupling, whileα3andβ3denote the quasi-linear and nonlinear coupling,respectively,between the pump and low-frequency mode.[17,31]These coefficients are

3. PI in different parameter regimes
3.1. Key parameter determining the characteristics of PI


The left and right exponential terms in the square bracket correspond to ISQM withωr≈kzvtiand ICQM withωr≈ωci+kzvti, respectively. Here, the ISQM term is in the order of 1, and the ICQM term is in the order ofλi, suggesting that the ISQM is much stronger than ICQM in this limit.
由于受到传统观念的影响,以往在进行矿山资源的开采时本着“先开发、后治理”的原则,久而久之,造成了矿山地质环境的严重恶化。为了改变这一现状,需要加强对矿山地质环境保护与治理工作的研究,不断完善监测方案,积极拓宽资金渠道,针对地质环境破坏状况采取可行、合理的综合性保护与治理措施。
Forλi≥1,the Im(κi)can be derived using the expression ofκifrom Brambilla,[34]

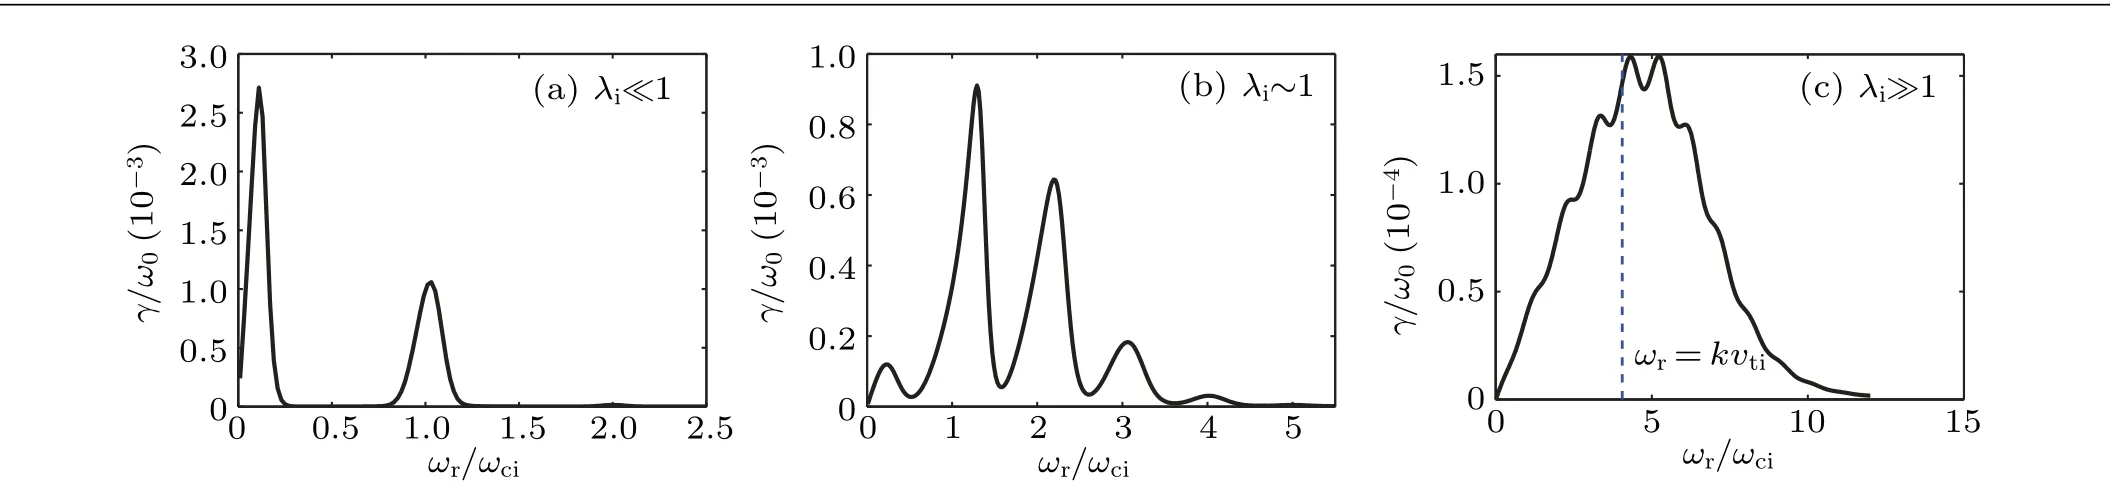
Fig. 2. Normalized numerical growth rate γ/ω0 (black solid lines) versus the normalized real frequency of the low frequency mode ωr/ωci with typical parameter sets for different λi limits: (a)λi=0.024;(b)λi=0.99,kzρi=0.26;(c)λi=8.0,kzρi=0.6. The blue dashed line in(c)notes the peak location derived from Eq.(15).
To understand these expressions in different limits ofλimore intuitively,especially the unclear decay channel implied by Eq. (15), numerical studies are also performed by solving Eq. (1). The detailed solving process for accessing the numerical PI growth rates in this paper follows Ref. [22]. Figure 2 shows theωrspectra of the numerical PI growth rates under three differentλilimits. For the case ofλi≪1 shown by Fig. 2(a), two unstable regions are found. They locate atωr≪ωciandωr≈ωci, which obviously correspond to the ISQM and ICQM, respectively. ISQM here is much stronger than ICQM.In Fig.2(b)(λi~1),up to 4 unstable modes are found, which are actually ISQM and ICQM harmonics. ICQMs here are much stronger than ISQM. In Fig. 2(c), whenλi≫1 andkzρiapproaches 1, the ICQM harmonics can be still observed from the peaks nearωr≈nωci. Compared with Fig.2(b),these ICQMs overlap seriously,and look rather like a single peak with maximum value atωr=kvti.In this sense,the decay channel seems to be a special form of the ICQMs. From the analysis of Eqs. (14) and (15), it should also be noticed that the ion damping has changed from the cyclotron damping to the Landau damping during the overlapping. Therefore,we should regard the peak as a new decay channel driven by the nonlinear ion Landau damping(NILD)rather than the simple overlapping of the ICQMs.

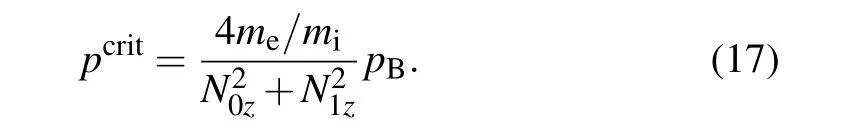
wherepB=B20/2µ0is the magnetic pressure(µ0is the permeability of the free space).
Essentially,it is the plasma pressurepdetermining the PI decay channels,andpwill be the key parameter in the following discussion on PI parameter dependence. To give a clear division of different pressure regimes, a critical pressurepcritis defined usingλi=1,and
The dependence on pressure can then be concluded as follows.Whenp ≪pcrit, it is the low-pressure regime and there are only ISQM and fundamental ICQM.Whenp ≫pcrit,it is the high-pressure regime and the NILD decay channel takes effect. For the intermediate regime, i.e.,p~pcrit, decay channels of multiple ICQM harmonics are found.
3.2. Low-pressure regime
As mentioned in the last subsection, ISQM and fundamental ICQM are the main decay channels of this regime. By substituting the corresponding characteristic real frequencies(ωr=kzvtifor ISQM,ωr=ωci+kzvtifor ICQM)into Eqs.(10)and(13),we can obtain the analytical growth rates of the two decay channels. For clarity and direct use,they are written in explicit forms with respect to the parameters.
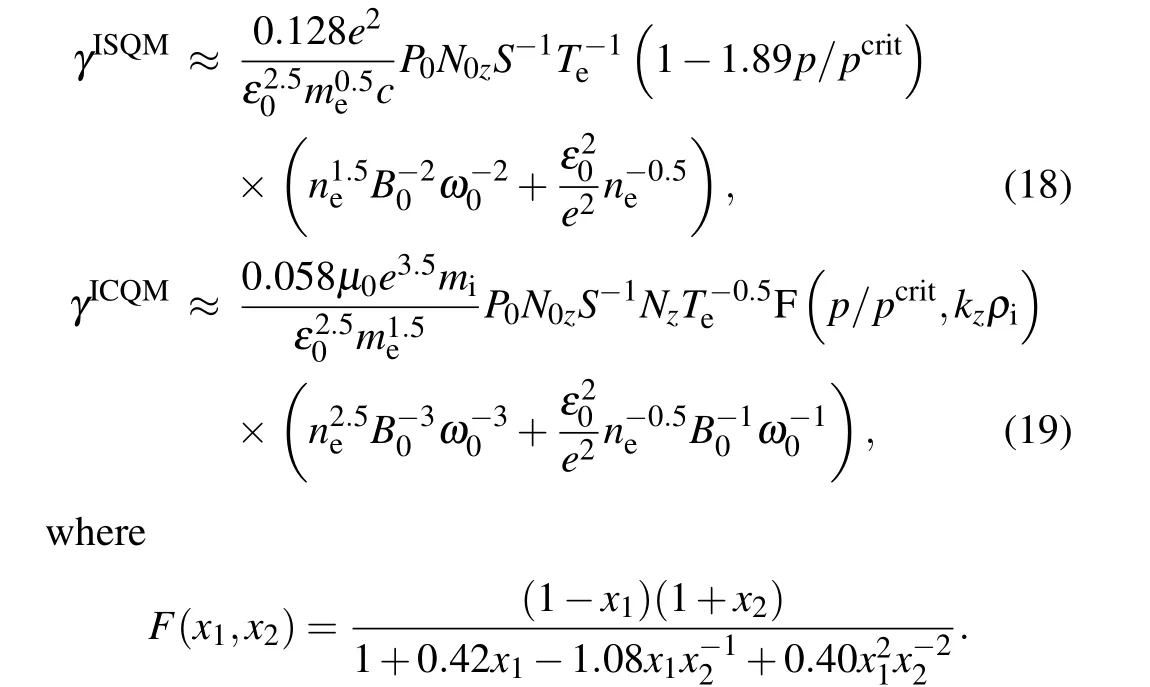
The terms in the first bracket of Eqs. (18) and (19) result from the susceptibility terms,which depend heavily on the pressure. According to Eq. (18), a higher pressure can stabilize ISQM.SinceFin Eq.(19)is an increasing function with respect top/pcrit, higher pressure may lead to higher ICQM growth rate. In the low-pressure limit,clear parameter dependence can be obtained by rewriting Eqs. (18) and (19) to the lowest order ofp/pcrit.


Fig.3. The trends of ISQM and ICQM growth rates(purple dashed lines)on ne[(a),(c)]and Te[(b),(d)]predicted by Eqs.(20)and(21). Here p/pcrit is in the range of 0.01-0.2, a typical value for the low-pressure regime. In(a)and(c), the ^ne is the normalized to the critical densityB0ω0 to show whether the range is in the low density or high density limit. Here, the effects of both density limits are included since ^ne is 0.15-1.8. As verification, the corresponding numerical parameter dependence of ISQM and ICQM growth rates (black solid lines) is also plotted. For better comparison,the constants of the analytical lines(C in the legends)are chosen as the mean values of the numerical lines.

In a qualitative aspect, the dependence in this regime agrees well with the published works.[21,22]Quantitatively,the present results can additionally show the sensitivities to the parameter through their powers in the equations. For example,ISQM is more sensitive toTethan ICQM in both density limits. In the high density limit,ISQM also increases withne,but with a rather slower speed than ICQM.
In Fig. 3, the dependence of growth rates predicted by Eqs. (20) and (21) onneandTeare plotted, together with the corresponding numerical growth rates as verification. The numerical growth rate of a decay channel indicates the peak growth rate of the corresponding unstable region similar to that shown in Fig.2. Consequently,most of the numerical growth rates agree with the analytical trends. In Fig.3(a),the analytical trend of ISQM grows slightly slower than the numerical growth rate because the finite effect of the term 1-1.89p/pcritin Eq.(18)not included.
3.3. High-pressure regime
In the high density regime,only the NILD decay channel can be found. As illustrated in Eq.(13),the ion susceptibility here is independent ofp/pcrit. The characteristic frequency of NILD isωr=1.17kzvti, where susceptibility term reaches its maximum value. Therefore, the growth rate of NILD can be derived as

The expression can also be used for quick estimation on growth rate like Eqs. (18) and (19). In the high density limit for the high pressure,the parameter dependence is

It can be easily seen that the parameter dependence of NILD is the same as the ISQM in the low-pressure limit, because both of their susceptibility terms are almost irrelevant to the ion cyclotron motion and then contribute nothing to the dependence. For ISQM,only the ion motion parallel toB0is considered.For NILD,the ions move approximately in a straight line within a wavelength of the low-frequency mode as it is much shorter than the Larmor radius.
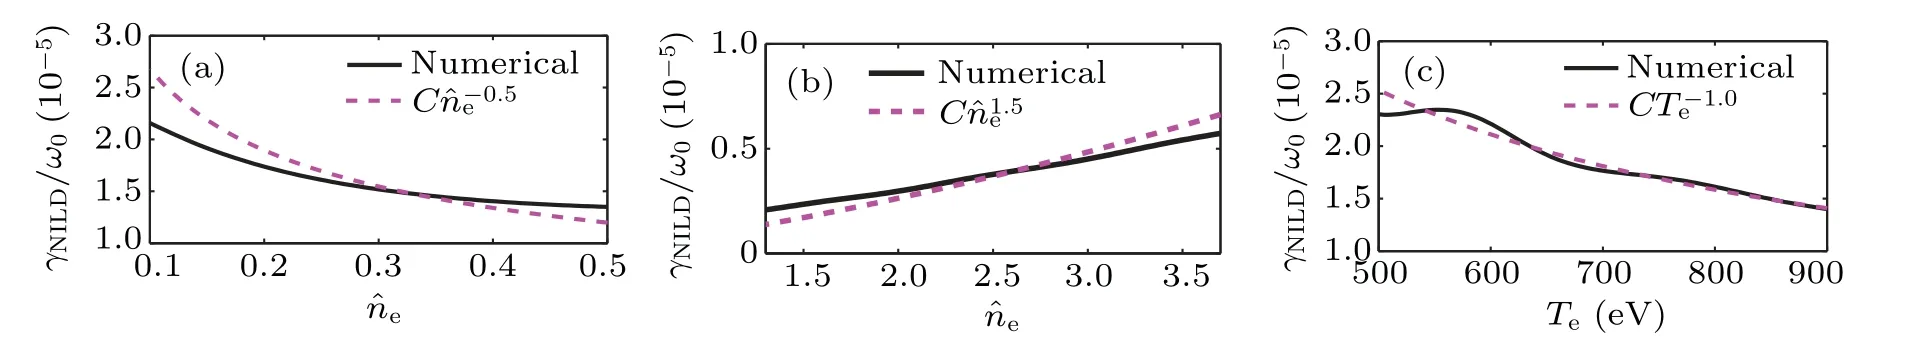
Fig.4. Similar to Fig.3,the analytical trends(purple dashed lines)on ne and Te predicted by Eqs.(27)and(28),compared with the corresponding numerical NILD growth rates(black lines).Here,p/pcrit is in the range of 6-20;kzρi is in the range of 0.6-1.9,typical for the high-pressure regime. [(a),(b)]Dependence on ne in the low and high density limits,respectively. (c)Dependence on Te.
For the high-pressure regime, the trend predictions from Eqs. (27) and (28) are also compared with the numerical parameter dependence in Fig. 4. It can be seen that the trends agree with the numerical results,except for some subtle jitters on the numerical lines in Fig.4(c). The jitters are attributed to insufficient overlapping of the ICQM harmonics as shown by Fig.2(c). They will vanish whenTefurther rises.
3.4. Intermediate regime

The dependences onneandB0shown in Eq. (30) are quite different from the present knowledge. Under the effect ofE0zcoupling term, an increasingneor a decreasingB0no longer strengthens the growth rates of the ICQMs but decreases them instead. Actually, such a trend holds in a very finite parameter range. As the density increases further, the effect of theE0⊥×B0term will take in charge,and the dependences onneandB0are then recovered as described by Eq.(31).

Fig. 5. The susceptibility term Imversus λi. Here, κi is in a complete form of Eq.(12),kzρi is fixed at a typical value of 0.3.

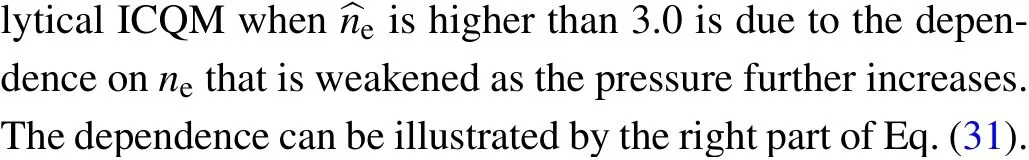

Fig.6. Similar to Fig.3, the analytical trends of ICQM and its secondary harmonic(ICQM2)predicted by the middle parts of Eqs.(30)and(31)are shown as purple dashed lines,while the relevant numerical growth rates are shown as black solid lines for comparison. All the scans are performed around p/pcrit =1 for ICQM, and p/pcrit =2 for ICQM2, referring to the parameter range of the intermediate regime. The positions with the critical pressure pcrit (2pcrit for ICQM2) are labeled with blue dot-dashed lines. The dependence on ne in the low density limit is shown in(a)and(d),while in the high density limit shown in(b)and(e). [(c),(f)]The trends on Te.

Table 1. Summary of the parameter dependence of PI growth rates in different density limits and pressure regimes.

In the next section, the theory is applied in PI estimation for the typical profile of CFETR hybrid scenario. The radial profile will be divided into regimes representing different dominant decay channels and parameter dependence. To observe the validity of the analytical descriptions, numerical growth rates will also be calculated by scanning with pointby-point parameters.
4. PIs in the hybrid scenario of CFETR
4.1. Division of pressure regimes on the CFETR profile
Here,a typical set of CFETR edge parameters is studied.The density and temperature distributions along the radial direction are shown in Fig.7(a). These data are extracted from a set of typical CFETR edge data for the hybrid scenario,which is provided by Chenet al.[28]The toroidal magnetic field at the plasma core isBt=6.5 T, and the magnetic field at the lowfield-side edge is around 5 T.As for the ions,pure deuterium gas is used for the numerical setup(mi/me=3672). Following the last section, the density and temperature of ions are assumed the same as electrons. A 4.6 GHz 10 MW LH pump is injected into the plasma with a nominaln0zat 1.7.[36]The antenna cross section is set perpendicular to the radial axis. Its areaSis assumed to be 1 m2.

Fig.7. (a)The plasma density(blue solid line)and temperature(green dashed line)distribution near the separatrix at the outer mid-plane. The radial position xs is the distance from the separatrix. Negative values of xs are inside the separatrix. (b)The radial profile of the normalized pressure p/pcrit and the division of the pressure regimes.The green area is the low-pressure regime,while the yellow area refers to the intermediate regime and the red area is the high-pressure regime. The blue dot-dashed line corresponds to the critical pressure. The red dashed line marks where the values of E0⊥×B0 term and E0z term are equal,ne=B0ω0,and neither of them could be neglected in the vicinity.
Considering a smooth convective growth in the inhomogeneous plasma,[29,37]the parallel refractive index of the sidebandn1zis chosen as a low value of 3. Then in Fig.7(b),the corresponding pressure distribution of CFETR in shown. It can be seen that the critical pressure locates just near the separatrix. Hence, the outer part of the SOL corresponds to the low-pressure regime. The region ofxs=-1~3 cm belongs to the intermediate regime,while the high-pressure regime distributes inside the separatrix.

Fig.9. The growth rates versus xs,showing the comparison between the numerical growth rates extracted from Fig.8 and the corresponding analytical approximations. (a)Comparison between the numerical ISQM growth rate and Eq.(18). (b)Numerical ICQM growth rate compared with Eq.(19). (c)Numerical NILD growth rate compared with Eq.(26).
4.2. Growth rates as functions of radial positions
In Fig.8, numerical growth rates of various decay channels are shown as a function ofxs. We can see that from the outside of the separatrix to the inside of the separatrix, the most unstable decay channel changes in the order of ISQM,ICQM,ICQM2,and finally NILD.ISQM is the strongest decay channel at the far edge ofxs>4.5 cm, while ICQM dominates at most parts of the SOL (xs=0~4.5 cm). The ICQM2 dominates within a centimeter inside the separatrix(xs=-1~0 cm),and NILD becomes the major decay channel atxs=-4~-1 cm. The radial distributions of the dominant decay channels agree with the division of the parameter regimes shown in Fig. 7(b). Among the shown decay channels, the ICQM has the maximum growth rate near the position where thepcritlocates. The maximum growth rate is 1.6×10⁻³ω0,which is a value slightly lower than the growth rates found in conventional tokamaks,[24,25,29]implying that comparable PI can also be found in a CFETR-like plasma edge.

Fig. 8. The distribution of the numerical growth rates on the radial profile for different decay channels, including ISQM(black dot-dash),ICQM (blue solid), ICQM2 (brown dot-dash) and NILD (red-solid).The growth rate of a decay channel is the maximum growth rate scanning the vicinity of the characteristic frequency.
Notice that Eqs. (18), (19) and (26) are explicit expressions of growth rates,which can be used for PI estimation by directly substituting the parameters. In Fig.9, the applicability of these equations are checked by comparing their results on the profile with the numerical ones which have been shown in Fig. 8. In Figs. 9(a) and 9(b), the analytical growth rates of ISQM and ICQM in the low-pressure regime are checked.It can be found that Eqs. (18) and (19) agree well with the numerical black line atxs>3 cm, and fail whenxsis lower than 3 cm. Similarly, in Fig. 9(c), the NILD growth rate in the high-pressure regime is checked. It is almost valid at-4 cm<xs<-1 cm,and fails elsewhere. The disagreement atxs<-4 cm is attributed to electron absorption in highTe,which is not included in the analytical growth rates.
4.3. Effects of Nz,B0,and ω0

Fig.10. The division of the parameter regimes and the corresponding numerical growth rates affected by[(a),(d)]a higher N1z at 6,[(b),(e)]a higher B0 at 9 T and[(c),(f)]a higher ω0 at 8 GHz. Parameters used here are the same as those in Fig.7 except the changed one. The gray zones found in(a)refer to stable regions where the sidebands are strongly damped by electrons.

In Figs.10(d)-10(f),the radial distribution of the numerical growth rates is plotted correspondingly. The distribution of dominant decay channels almost follows the division of parameter regime shown in Figs. 10(a)-10(c). Furthermore,comparing the numerical results in Fig. 10 with the original results in Fig. 8, we can see that the change in the numerical growth rates also follows the analytical predictions. Since the ISQM growth rate in the low-pressure regime can hardly be affected by neitherNzandB0norω0, their results in all subfigures are almost unchanged. According to Eq. (21), ICQM growth rate in the low-pressure regime increases withNzand decreases withB0andω0. Correspondingly, it is stronger in Fig.10(d)and stabilized in Figs.10(e)and 10(f).
5. Discussion and conclusions
PI is a ubiquitous phenomenon found in LHCD process near plasma edge with low electron temperature. For a reactor level tokamak like CFETR, the onset of PI may be a serious issue affecting the LHCD efficiency as it has higher edge densities and higher pump LH power. In this paper,the nonlinear dispersion relation is analytically and numerically solved to understand the PI effects in CFETR and in further wide parameter ranges.
By analyzing the susceptibility terms of the PI growth rate, the pressure is found to be an important parameter determining the PI decay channels. In the low-pressure regime,ISQM is the dominant decay channel. It decreases rapidly with pressure and is eventually overtaken by the ICQM and its harmonics in the intermediate regime. In the high-pressure regime,only NILD decay channel is found.
Explicit forms of PI parameter dependence in each pressure regime are obtained by further analysis, which has been summarized in Table 1. The parameter dependence found in the low-pressure regime shows a good agreement with the published work.[21,22]In the intermediate regime,ICQMs display a quite different dependence from that in the low pressure due to the cyclotron motion of ions. For example, they may stop from increasing withneand even decrease if the density is low enough. In the high-pressure regime,where the perpendicular ion orbit is almost a straight line just like the parallel motion,the parameter dependence recovers to the same as ISQM.
PIs in CFETR are investigated by applying the above analytical results to a typical set of parameters of the hybrid scenario. Numerical calculations are also performed to verify and replenish the analytical conclusions. Along such anne-Tecoupled profile,all the three pressure regimes are found successively. The ISQM-dominant low-pressure regime occupies the outer half of SOL, while the inner half of SOL and the separatrix belong to the intermediate regime. The highpressure regime occupies the region several centimeters inside the separatrix. As a result, the fundamental ICQM in the intermediate regime is the most unstable PI decay channel of the profile, with a maximum growth rate comparable to the maximum growth rates in conventional tokamaks. Increasing parameters likeB0orω0can help reduce the dominant ICQMtype PI and the low growth rate of NILD,but has little effect on ISQM-type PI.
Through this work, the present understanding of PI parameter dependence is rearranged in the clue of pressure. For investigating PI in a certain position, we can now understand its decay channel and parameter dependence just by determining which pressure regime it locates.Sensitivities of parameter dependence are now clarified through the analytical expressions. For example,in the past,we only knew that the PI decays with an increasingTe. Now we realize that for ICQM,the growth rate decays fastest withTein the intermediate regime and slowest in the low-pressure regime. This work also shows some situations with unforeseen parameter dependence. For instance, if the density of the intermediate regime is sufficiently low, the ICQM growth rate may stop from increasing withneand even decrease.
It should be noticed that the additional effects on sidebands such as plasma inhomogeneity and finite pump width may strongly limit the growth of sideband with highN1zor aδ1nearπ/2, whereδ1is the angle betweenk0⊥andk1⊥.[37,38]These effects are not considered here because this paper mainly focuses on the analysis of the PI growth rate.Since a rather traditional version of PI model is used for the simplicity of the analysis, effects mentioned in the recent PI models such as collision and electromagnetic pumps could not be included.[39,40]The former can inhibit PIs near the antenna mouth, while the latter reduces PIs at high densities. In the future,more efforts on these issues will be made to refine the present results.
Appendix A:Derivation to an explicit form of the PI growth rate

To give an explicit form ofγNL, the coefficients ofµ1,shown as Eqs.(7)-(9),aresimplifiedto

To make the parameter dependence ofγNLmore clear,we transform the pump potentialφ0into a realistic parameter such as the pump powerP0. The relation between them is approximately

where the angleδ1has been set asπ/2 to seek the maximum growth rate.
Acknowledgements
Project supported by the National Key Research and Development Program of China (Grant Nos. 2017YFE0300406 and 2019YFE00308050) and the National Natural Science Foundation of China (Grant Nos. 11975272, 12175274,12005258, and 11705236). We sincerely appreciate the data support from the CFETR physics team.
猜你喜欢
今日农业(2022年16期)2022-09-22
建材发展导向(2022年14期)2022-08-19
河北地质(2021年2期)2021-08-21
神剑(2021年3期)2021-08-14
昆钢科技(2021年2期)2021-07-22
矿产勘查(2020年7期)2020-12-25
人大建设(2018年7期)2018-09-19
当代陕西(2018年12期)2018-08-04
法制博览(2017年1期)2017-02-14
现代营销·学苑版(2016年12期)2017-01-23

- Chinese Physics B的其它文章
- Characterizing entanglement in non-Hermitian chaotic systems via out-of-time ordered correlators
- Steering quantum nonlocalities of quantum dot system suffering from decoherence
- Probabilistic quantum teleportation of shared quantum secret
- Spin–orbit coupling adjusting topological superfluid of mass-imbalanced Fermi gas
- Improvement of a continuous-variable measurement-device-independent quantum key distribution system via quantum scissors
- An overview of quantum error mitigation formulas