
Comparing simulated and experimental spectral line splitting in visible spectroscopy diagnostics in the HL-2A tokamak
2023-03-06 01:48JingWU吴静YongqinDU杜永勤PengCHEN陈鹏HangyuZHOU周航宇YumeiHOU侯玉梅andLiemingYAO姚列明
Plasma Science and Technology 2023年2期
Jing WU (吴静),Yongqin DU (杜永勤),Peng CHEN (陈鹏),Hangyu ZHOU(周航宇),Yumei HOU(侯玉梅) and Lieming YAO(姚列明)
1 University of Electronic Science and Technology of China,Chengdu 610054,People’s Republic of China
2 Southwestern Institute of Physics,Chengdu 610041,People’s Republic of China
Abstract We established the passive-visible spectroscopy diagnostics(P-VSD)and active-VSD(A-VSD)spectral splitting models for the HL-2A tokamak.Spectral splitting due to the influence of electromagnetic fields on the spectra in VSD is studied.Zeeman splitting induced by the magnetic field (B)is used to distinguish reflected light overlap in the divertor for P-VSD.Stark splitting caused by the Lorentz electric field(ELorentz)from the neutral beam injection particle’s interaction with the magnetic field (Vbeam×B) is used to measure the safety factor q profile for A-VSD.We give a comparison and error analysis by fitting the experimental spectra with the simulation results.The distinguishing of edge (scrape-off layer and divertor) hydrogen/deuterium spectral lines and the q profile derived from the spectra provides a reference for HL-2M VSD.
Keywords: visible spectroscopy diagnostics,stark splitting,Zeeman splitting,wavelength broaden
1.Introduction
Visible spectroscopy diagnostics(VSD)is used to monitor the densities of hydrogen/deuterium (H/D) and impurities (carbon C and tungsten W) in the core and edge (divertor and scrape-off layer (SOL)) regions of fusion reactors,thereby ensuring their safe operation.The acquisition of these parameters is essential for the low-confinement-mode(L mode)to high-confinement-mode (H mode) transition and fuel cycle studies.The concentration of impurities in the core region causes plasma disruption with subsequent severe thermal and current quenching.The physics parameter of the effective charge number(Zeff)derived from VSD is used to monitor the impurity concentrations [1].
In general,physical parameters can be obtained by making suitable fits to VSD spectra [2,3],e.g.,impurity densities,transport coefficient,transport flux,effective charge numberZeff,temperatureTi,plasma rotation velocityV,plasma current densityJ,safety factorq,magnetic field fluctuation (ΔB),as well as deuterium/tritium (nD/nT) and hydrogen/deuterium (nH/nD) fuel ratios.These physical quantities help us understand the physical mechanism of fusion plasma confinement.VSD also plays a significant role in plasma control systems (PCSs),and it is mainly used in plasma disruption and edge local mode (ELM) studies [4-8].VSD measures physics parameters in the core bulk plasma(0 <r/a<0.65),edge plasma (0.65 <r/a< 0.95),SOL and the divertor regions,whereris the radial coordinate,ais the minor radius andr/ais the normalized minor radius.The magnetic confinement for fusion requires feedback that relies on VSD.
Spectral overlapping can be an issue and challenge for VSD.In particular,reflected or stray light from the vacuum chamber’s walls can affect the reliability of SOL and divertor diagnostic results.The stray light from the SOL and divertor regions rather than the neutral beam-based active spectra is captured in the P-VSD system.Since the reflected light in the neutral beam region has a high Doppler wavelength shift,it can be effectively excluded in P-VSD spectra analysis.The spectra of H/D,He3/He4,W and neutral beam injection(NBI) with different energies (the full energyE,the half energyE/2,the one-third energyE/3,and maybe the oneeighteenth energyE/18) sometimes overlap with each other and are indistinguishable[9-12].Reducing or eliminating the reflected stray light has become essential to VSD.The intensity of reflected light can be higher than the light that needs diagnosing,therefore affecting the diagnostic system’s signal-to-noise ratio (SNR) and resulting in a diagnostics system error.
Another issue for A-VSD takes the form of spectral structures emitted after CX collisions between slowed-down fast ions that originated in the NBI systems and neutral H or D atoms injected by the same or another NBI system.A further issue to be handled and analyzed is line broadening and splitting due to the Lorentz electric field ELorentz,an electric field induced in beam atoms by the Vbeam×B effect.It should be noted that the spectral splitting caused by the motional Stark effect (MSE) is from E = Vbeam× B + Er.The relative magnitude of the Lorentz electric field EL= Vbeam× B is derived from the D+ion generated by the collision of neutral particles with the plasma during the NBI process.The rotational motion of the D+ion in the bulk plasma generates a radial electric field Er.According to Charge eXchange Recombination Spectroscopy (CXRS)diagnostics,HL-2A has a plasma toroidal rotation velocity ofVτ≈104m s-1at the edge and 105m s-1in the core and a poloidal upper limit rotation velocity ofVp≈104m s-1.The beam energy is 22.5 keV amu-1for H,considered the full energy,with four ion sources turned on.Thus,the beam particle’s velocity is Vbeam≈106m s-1(not considering special relativistic effects).According to the angle γ betweenVbeamandBτ,approximately equal to 127.8 degrees,we calculated the sinγ ≈0.8.Thus,the ratio of the ELorentzto the Eris estimated to be about 10 to 100.
As a result,the spectral splitting model did not account for the Lorentz electric field generated by the plasma rotation.In subsequent sections,we use ELto represent the Lorentz electric field generated by NBI.However,if the plasma performance is enhanced,we must account for the radial electric field Ergenerated by bulk plasma ions’ rotational motion.
Spectral line splitting has been studied and qualified for VSD in many devices.For instance,Balmer line spectra(Dα,Hα,Dβ,Hβ,Dγ,Hγ) in the SOL and divertor showed strong Zeeman splitting in the TEXTOR tokamak [13].Zeeman splitting was studied in the TEXTOR tokamak for ion temperatures of 0.5-1.0 eV and magnetic fields B from 1 to 1.5 T using edge passive and active charge-exchange(P-CXRS and A-CXRS) diagnostics [14,15].The Zeeman splitting of Dα656.10 nm and Hα656.28 nm in the KSTAR tokamak showed that the internal magnetic field could be determined by analyzing the circularly polarized spectral lines emitted by the plasma impurities [16].The Abel inversion method was used to calculate the radial magnetic fieldBr,the magnetic field pitch angle and the boundary impurity densitiesnz[17-22]from the Zeeman splitting polarization characteristics of Hα(656.28 nm) based on calibrated light intensity[23-27].
FIDAsim [28,29],TRANSP [30]and SOS [31,32]codes are usually introduced to simulate the visible spectra caused by a diagnostics neutral beam (DNB).This study observes spectra measured from the midplane horizontal and vertical top windows from the line-of-sight (LOS).Based on the SOS code and the ADAS database [31-33],this study models the Stark and Zeeman spectral splitting in P-VSD and A-VSD of beam emission spectra (BES) and MSE.
In this work,the ion temperatureTiand densityni,the electron temperatureTeand densityneprofile,the crosssection between particles 〈Qi,j〉,and the central wavelength(λ) models are introduced into the simulation and experimental spectral reconstruction model.We used the magnetic field-induced Zeeman splitting spectra to distinguish the H/D spectra from different regions (divertor and SOL) and discriminated the reflected light mixed with the diagnostic spectra.Spectra were distinguished due to different magnetic fields with special Zeeman splitting characters.We set a spectral model for H/D with a warm component (<50 eV)and a cold one(<3 eV)in the divertor and SOL.The spectral reconstruction was performed using simulation and experimental MSE spectra[34-39],and then the safety factorqwas calculated from the Lorentz angle from the reconstructed MSE spectral curve.
2.Simulation and experimental set-up
2.1.Diagnostic layout
Figure 1 shows the HL-2A geometry of the diagnostic LOS schematic model.The LOS and electric/magnetic field(E/B)angle affect the Stark and Zeeman splittingIπ/Iσratio.Figure 1(a) shows the side view of the HL-2A vertical observation schematic for P-VSD,which can monitor the helium (He),tungsten (W) and H/D densities in the downwards divertor.When looking at the downwards divertor,the LOS inevitably receives reflected light from the SOL region,which should be excluded.It is also subjected to a significant stray light from the nearby (upper divertor).The first mirror(FM) generally penetrates the diagnostics port plug,equivalent to attaching a lens hood to avoid nearby stray light,avoiding being affected by stray light from the upper divertor.A shutter is used before the FM to avoid being sputtering and deposition by the plasma.Figure 1(b)shows the side view of the midplane window of the inner-wall LOS for P-VSD.The LOS spread lines change in theZ-direction (up and down).This diagnostic port plug window also integrates CXRS,BES,MSE and fast-ion Dαdiagnostics (FIDA) of A-VSD in HL-2A,as shown in figure 1(d).
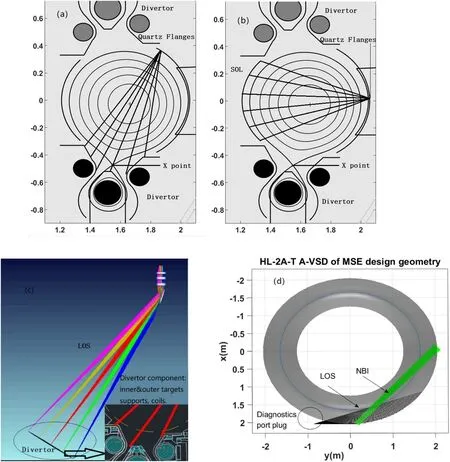
Figure 1.(a)Side view of the P-VSD vertical observation LOS schematic used to diagnose the divertor region.(b)Side view of the P-VSD midplane window LOS layout used to diagnose the SOL inner-wall region.(c)Optical light path simulation of the divertor region from a top vertical view using Zemax software.(d) Top view of the midplane window observation LOS for A-VSD.
Figure 1(c)presents the Zemax simulation by the vertical LOS.The dark horizontal line at the bottom of the figure represents the focused image plate,which includes the components facing the lower divertor,covering the magnetic field zero point (X-point) of the lower divertor,inner target board,demo board,external target board,cassette box and C-sharp block complex components.It should be noted that the focus position difference between various components is not considered in the image plane.The spatial position of various components needs to be clarified to ensure that the image plane has a slight position difference between different components.Figure 1(d) shows the top view of the HL-2A midplane window observation LOS for A-VSD.The LOS spread lines change in theX-Yplane(eτanderdirection).The spatial distribution’s top view of the cross-section area is presented,providing the angle between the LOS and NBI.The green beamline represents the NBI neutral beamline and the black shading is LOS.
2.2.Spectral simulation model
2.2.1.Atomic spectroscopy model.NBI can heat the plasma core region efficiently since the neutral particles can traverse through the magnetic field.However,a fraction of beam particles,D0,is ionized by charge-exchange collisions and becomes trapped,as shown in equation (1),where An+represents plasma ions.Active spectral diagnostics CXRS,BES and MSE are developed during the collision between neutral particles and bulk plasma.Now,since the collision cross-section,〈Qi,j〉,between beam particles and bulk plasma impurities decreases with beam energy in the range of 50-100 keV amu-1for hydrogen,here,istands for a neutral beam particle andjstands for impurities (He,C,W); using a beam with such energies would result in reduced SNR.Therefore,a suitable energy DNB (<50 keV amu-1,for H)was developed [40,41].The CX process is shown in equation (1),where the intensity of the spectra is given in equation(2).We can calculate the plasma temperatureTifrom the Doppler wavelength broadening λdas shown in equation (3),and the Doppler wavelength shifts Δλ from the beam velocity Vbeamand the angle β between the LOS and the NBI from equation (4).
whereIcxis the intensity of the CXRS,nzis the impurity density,nbis the neutral beam density,neis the electron density,Tiis the ion temperature,Zeffis the effective charge number,Eis the beam energy,Qcxis the charge-exchange collision cross-section between neutral particles and bulk plasma impurities,dsis the light from the cross-sectional area integration,λdis the Doppler wavelength broadening,cis the light speed in the vacuum,and β is the angle between the LOS and the NBI,which can be obtained from the geometry of the VSD layout.
BES emissions originate from interactions between neutral beam particles (H/D) and plasma electrons,and plasma impurities (see equation (5)).The spectral intensities of BES can be determined by the formula (6).
where D means the neutral deuterium particles and Z means the bulk plasma impurities.IBESis the intensity of the beam emission spectra andQBESis the BES collision cross-section coefficient.
The light from BES emissions can be analyzed in several ways.For instance,when using fast light detectors and bandpass filters,microsecond(ms)scale turbulent fluctuations can be investigated [42].In contrast,when emission spectra are collected using,for instance,a spectrometer and a CCD camera,then the MSE structures can be extracted and analyzed to determine magnetic field quantities.Indeed,each energy component produces spectral line splitting due to the interaction of the beam atoms with the magnetic field.Moreover,the fractions of the beam energy species (E,E/2,E/3 and maybeE/18) can be determined from such spectra by the intensities of the different energy components(E,E/2,E/3 and sometimesE/18) [43].In this work,we model the spectra of each component to find parameter settings,like the energy ratio for spectral line splitting.NBI is accompanied by a neutral cloud (halo)along its injection path.The diagnostic port plug window in the midplane is behind the NBI,as seen in figure 1(d),so spectra are red-shifted in wavelength,and FIDA spectra overlap with the MSE spectra in HL-2A.An accurate MSE spectral splitting model relies on well-modelled FIDA spectra.In HL-2A,the FIDA spectra are much lower in intensity than the MSE spectra and there are passive contributions from the edge (PCX-edge).Establishing an accurate MSE spectral splitting model is also essential for FIDA spectra analysis.
The Lorentz electric fieldELdue to the NBI can be calculated from the neutral beam particle velocity and magnetic field interaction,as shown in equation (7).We use equations(8)and(9)to calculate the spectral splitting Δλ due to the Stark and Zeeman effect.
where ELis the Lorentz electric field due to NBI injection,Vbeamis the neutral particles’velocity,B is the magnetic field,including the toroidalBτand the poloidalBp,Δλ is the spectral line wavelength splitting,his the Planck constant,eis the electron charge,meis the electron mass,λ is the centre wavelength of the spectral,gis the Lande factor,andMis the magnetic quantum number.The angle between the LOS and theELdetermine the splitting spectral intensity ratio betweenIπandIσ,which can be used to calculate the safety factorq,as shown in equations(10)and(11).We reconstruct the splitting spectral caused byELand calculate theqwith the spatial profile.
whereIπis the intensity of the π component in the Stark splitting,Iσis the σ component,θ is the angle between the LOS and theEL,and the correction factorTfis the π to σ transmission ratio for the optical chain system.We assumeTf= 1.0 here,which means that the diagnostic system has the same sensitivity forIπandIσpolarized light.Note that this value introduces diagnostic system errors,especially when introducing the first mirror,which we describe in detail in section 3.2.θ0is the angle between the LOS andELwithout the poloidal magnetic fieldBp,andq=aBτ/RBp,the pitch angle of the magnetic field α = arctan (Bp/Bτ).Appendix A shows the safety factorqcalculation process.
Magnetic fields give rise to spectral Zeeman splitting in P-VSD.Since the magnetic field strengths in the divertor,Bdivetor,and at the wall,Bwall,are different,light from the SOL can be distinguished from light from the divertor by analyzing the Zeeman splitting.Figure 2 shows the Zeeman splitting testing versus different temperatures (T) and magnetic fields(B).The Zeeman splitting is more significant in the edge region with a lower temperature (Bt≈2.8 T under theTi≈0.6-1.2 eV).The result shows that lower temperature and higher magnetic fields are beneficial to distinguishing the Zeeman splitting.

Figure 2. (a) Zeeman splitting at different temperatures 0.078125-5 eV.The temperature of 0.078125 eV is approximately the HL-2A vacuum vessel baking temperature of 300 K.(b)Zeeman splitting at different magnetic field strengths 0.7-2.8 T.
2.2.2.HL-2A parameter profile.The HL-2A tokamak has a major radiusR= 1.65 m,a minor radiusa=0.4 m,a toroidal magnetic fieldBτ= 2.8 T,plasma currentIp= 480 kA,electron densityne=(1-3.5) × 1019m-3,NBI duration time 500 ms,heating power of LHCD 2 MW,ECRH 3 MW,ICRH 1 MW and NBI 1-2 MW,and the angle between the midplate window and the NBI is about 52.1 degrees.An optical grating of 1800 grooves per mm is used for the spectral analysis,and an optical fibre system is installed on a spectrometer that can transmit the light to the electronmultiplying CCD (DU888,1024 × 400 pixels) camera.The simulation parameters are consistent with the experimental parameters [31],where the CCD quantum efficiency is 90%,F#= 2.8,optical throughput is 0.1,integration time is 12.5 ms,slit height and width are 0.2 mm,optical grating dispersion is 0.115 A per pixel,CCD pixel area is 16 μm×16 μm,ion and electron temperaturesTiandTeare 1.0 keV,toroidal rotational velocityVτ= -120 km s-1(the negative sign means that the particle is moving away from the observer and the wavelength redshifts),and poloidal rotational velocity isVp= 0-20 km s-1inr/a= 0.0.The NBI power is 22.5 keV amu-1for H,the beam (D) divergence is 15 mrad and the currentIbeam=8 A.Due to the resolution of the HL-2A poloidal diagnostics layout,the poloidal rotation velocityVpcannot be accurately measured in the core region.Based on the experimental results ofVpin the edge of HL-2A [44]and other tokamak devices [45],the initial value of the poloidal rotation velocityVpon the plasma magnetic axis is set to the range from 0 to 20 km s-1.Note that this parameter can be adjusted according to experimental results.
Figure 3 shows the relationship between the physics parameters and normalized minor radiusr/a.Figure 3(a)gives theIπ/Iσratio profile in the MSE spectra simulation,which reaches a minimum peak atr/a≈0.5.Figure 3(b)gives the spectra Lorentz split profile versusr/a.This value increases with ther/aand is nearly stable at the edge regionr/a≈0.8.Equations(7)and(8)show that Δλstarksplitting is sensitive toVbeam,Band λ0.Since the beam velocityVbeamis constant for each energy component and does not vary with penetration depth into the plasma,λ0is constant,andBis lower at ther/a= 1.0 than that atr/a= 0.0,then the angle betweenVbeamandB(EL= Vbeam× B),might account for the increasing Lorentz split.The E and B are perpendicular to each other,and the neutral beam particle velocity direction V can be obtained according to the injection angle of the NBI(disregarding the spread of the velocity vectors representing the injected neutral beam).The observation angle β between the LOS and Vbeamcan be calculated according to figure 1(d).Therefore,by calculating the angle θ between LOS and E using theIπ/Iσratio from equation (10),we can calculate the angle between Vbeamand the magnetic field B.The geometric relationship of the angles can be obtained from appendix A.
Figure 3(c) gives the BES doppler shift versusr/a.Doppler wavelength shift (full beam energyE) results from wavelength shift caused by relative motion to the observer.We can see from formula (4) thatVbeamand λ0= 656.3 nm are constant,and the angle β can be calculated according to the observer’s LOS layout and Vbeam.We can see that the Doppler wavelength shift Δλ,which is significant in the core,gradually decreases as the normalized minor radius (r/a)increases.Figure 3(d) gives the different NBI (halo) energy attenuation profiles.The NBI attenuation for different energy components (designed power fraction forE(68%),E/2(19%) andE/3 (13%)) is also given in figures 3(d) and (e).The neutral beam particles interact with the bulk plasma ions(charge-exchange process),and the ionization density of the neutral beam increases,so the neutral beam density gradually increases asr/adecreases.The deeper into the core region,the more substantial neutral beam density attenuation,which reduces the neutral beam heating effect in the core.
It should be noted here that in figure 3(d),the region ofr/a>0.95 is the NBI position,so the density of the particle beam dropped.Figure 3(e) gives the 2D profiles of the NBI attenuation process with the density profile,and the left axis shows the divergence in the perpendicular direction.Figure 3(f) is the NBI-halo attenuation 2D profile.

Figure 3.Relationship between the physics parameters versus normalized minor radius r/a:(a)Iπ/Iσ ratio,(b)spectra Lorentz split,(c)BES emission doppler shift,(d) the attenuation of the NBI with the halo,(e) HL-2A beam attenuation 2D profile,and (f) 2D HL-2A haloattenuation profile.
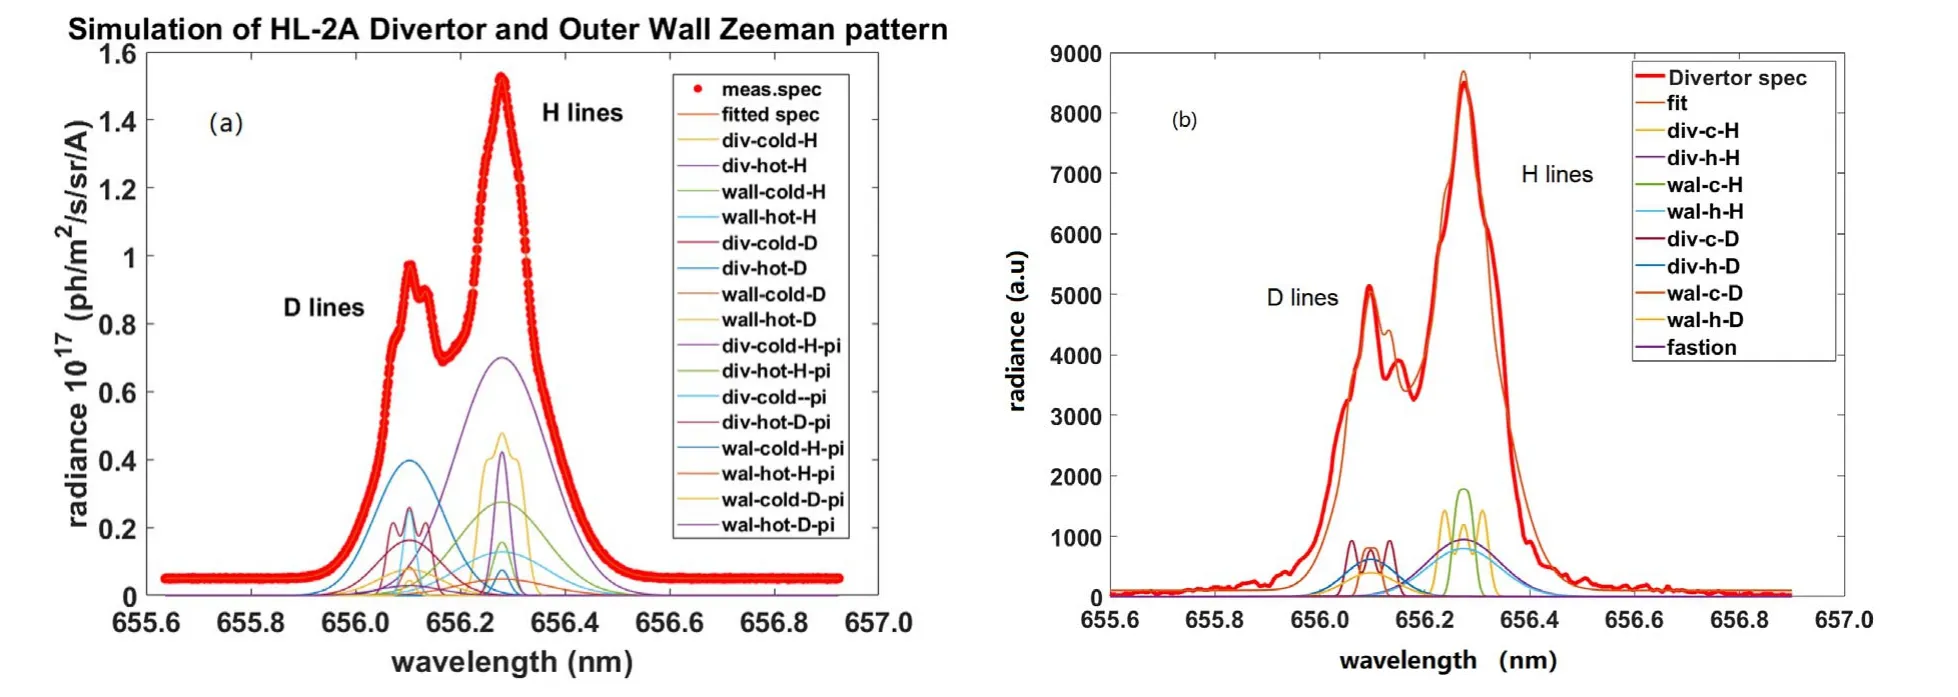
Figure 4.(a) Simulated HL-2A divertor and SOL H/D spectral lines in P-VSD.Zeeman splitting of the H/D spectra and the overall edge spectral profiles are established in the divertor and wall regions with different splitting components (Iπ and Iσ) according to temperatures(warm and cold),respectively.(b)Experimental HL-2A divertor H/D spectral lines in P-VSD.The reconstructed Zeeman splitting spectral line profiles of the experimental and simulation results are nearly consistent.
3.Results and discussion
3.1.Zeeman splitting in P-VSD
The Zeeman splitting model is adopted to resolve the overlapping issue of the divertor and SOL’s reflected spectra.The SOL has a different magnetic field from the divertor.In the case of the LOS that looks downwards towards the divertor(P-VSD)in figure 1(a),reflected light comes mainly from the inner-wall (SOL).Using the Zeeman splitting model,we simulated the Zeeman splitting in the SOL and divertor regions with differentBwallandBdivertor.Different magnetic fields help distinguish the signal and reflected light.Zeeman splitting helps identify reflected light and thus provides a reference for edge P-VSD.It should be noted that the light in the divertor region is directly observed.The plasma velocity in this region is small,so there is a slight wavelength Doppler blue wing due to the observed divertor region where the plasma may be close to the viewpoint.
Given that the Doppler broadening of passive spectral lines (ΔλDoppler< 0.214 nm for Balmer Hαand Dα) is small due to the low temperature (<50 eV),the Zeeman splitting can be detected in the experimental spectra with better resolution.The temperature in the edge assumes a warm component (50 eV) and cold component (<3 eV) [46,47].The edge spectral line parameters (wavelength broadening,wavelength shift,wavelength splitting and spectra intensity)in the divertor and SOL are modelled.Spectral reconstructions can be obtained for different particle compositions (H/D),different positions (divertor,SOL) and different temperature (cold and warm components) models.
The principle of distinguishing between different sources of reflected light is as follows: for different magnetic fields,light from the wall has a different Zeeman splitting from that from the divertor.The light from the divertor and the innerwall reflection are marked as ‘div’ and ‘wall’.H 656.28 nm and D 656.10 nm spectral lines in the divertor and inner wall(SOL) are used to calculate the H/D ratio.According to the Zeeman splitting models,we established theIπandIσof the cold and warm components in the divertor and wall regions.
In this model,the Gaussian curve spectra are added together to form the total spectral curve,and its profile is compared with the experimental spectral curve so that the mean square error is minimized to meet the fitting accuracy.In figure 4(a),we choose a magnetic field of the divertorBin the range of 1.6-2.0 T,a edge hot component temperature of 15 eV and a cold component temperature of 0.3 eV,with Hα/Dαspectral lines.The red legend ‘meas.spec’ curve means the sum spectra from the hot,cold,D,H,divertor and SOL components.The left lines are the spectral lines of D 656.10 nm,and the right lines are H 656.28 nm.Figure 4(b)shows the experimental spectral reconstruction in the downward divertor of P-VSD.The experimental fitting model contains cold and warm components,divertor and wall regions,and H/D spectral lines with Zeeman splitting.They are superimposed by setting Gaussian curves to simulate different polarization components to form the sum spectral curve.The reconstructed sum curve is compared with the experimental one to minimize the mean square error.The following plasma parameters were obtained in this simulation:Bdiv≈1.8 T,Bwall≈0.675 T,H/D ratio in the wall =5.039 and H/D ratio in the divertor = 1.632.
It should be noted that the FIDA spectra are also included in the experimental spectra,which are mainly from the NBI heating,and the ion cyclotron resonance heating in HL-2A,as shown in figures 4(b) and 5(b).The HL-2A FIDA spectra intensity is much lower than MSE and the passive spectra(PCX in edge),so the FIDA is not considered in the simulation.Spectral splitting provides a reference for distinguishing the collected light from the divertor and the reflection light from the wall(SOL),as shown in figure 4.The relative errors are from the divertor magnetic field (0.3%),inner-wall magnetic field (5%) and hydrogen-deuterium ratio(2.9%) in the simulation.The results verify the spectral splitting model for experimental spectra reconstruction.
3.2.Stark splitting in A-VSD
The MSE diagnostic spectra are from interactions between neutral beam particles (H/D),plasma electrons and plasma impurities.It has a higher velocity related to the beam energy and thus has a significant Doppler wavelength shift.Since the observation LOS is back from the NBI,the particles are away from the observer.Thus,the observed spectra show a Doppler red wing in HL-2A (wavelength redshift,long-wavelength shift).
Figure 5(a)shows the HL-2A MSE spectral simulation inr/a= 0.95.The models have included the PCX and the spectra at three energies (E,E/2,E/3).TheIπ/Iσratio for different polarization in the Stark splitting is due toEL.Figure 5(b) gives the experimental reconstruction of MSE spectra for #19680 track 9 (r/a≈0.7),in which all spectral models used the Gaussian curve but gave variable parameters for splitting spectra models: centre wavelength (λ),spectral intensity (Iλ) and Doppler wavelength shift (λd).We need to superimpose all spectral lines to ensure that the difference between the sum of Gauss curves and the experimental curve is the smallest to meet the best fitting requirements and minimize the mean square error.
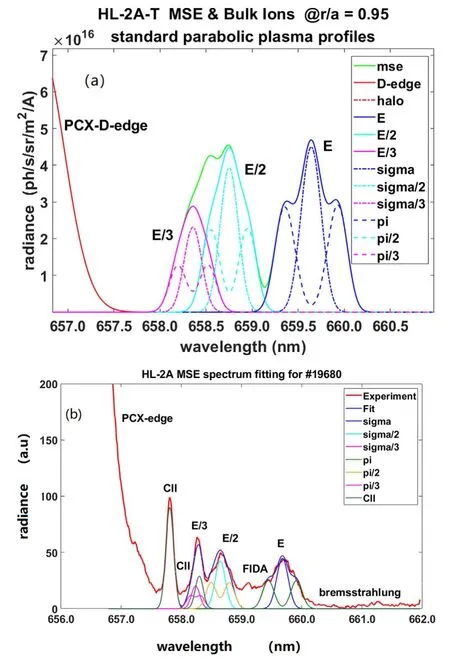
Figure 5. (a) HL-2A spectral simulation of MSE in r/a = 0.95.Simulation of the spectra (MSE) of neutral beam ions in the magnetic field by Stark spectral splitting.The model includes three energy components(E,E/2,E/3)splitting spectra,different splitting components (Iπ and Iσ),halo spectra,and edge passive charge exchange spectra (PCX).(b) Experimental reconstruction of MSE spectra splitting for #19680 track 9 (r/a ≈0.7).Combining the experimental D+,CII,FIDA and bremsstrahlung spectral lines,we reconstructed HL-2A experimental spectra with the MSE spectral model developed in the simulation.
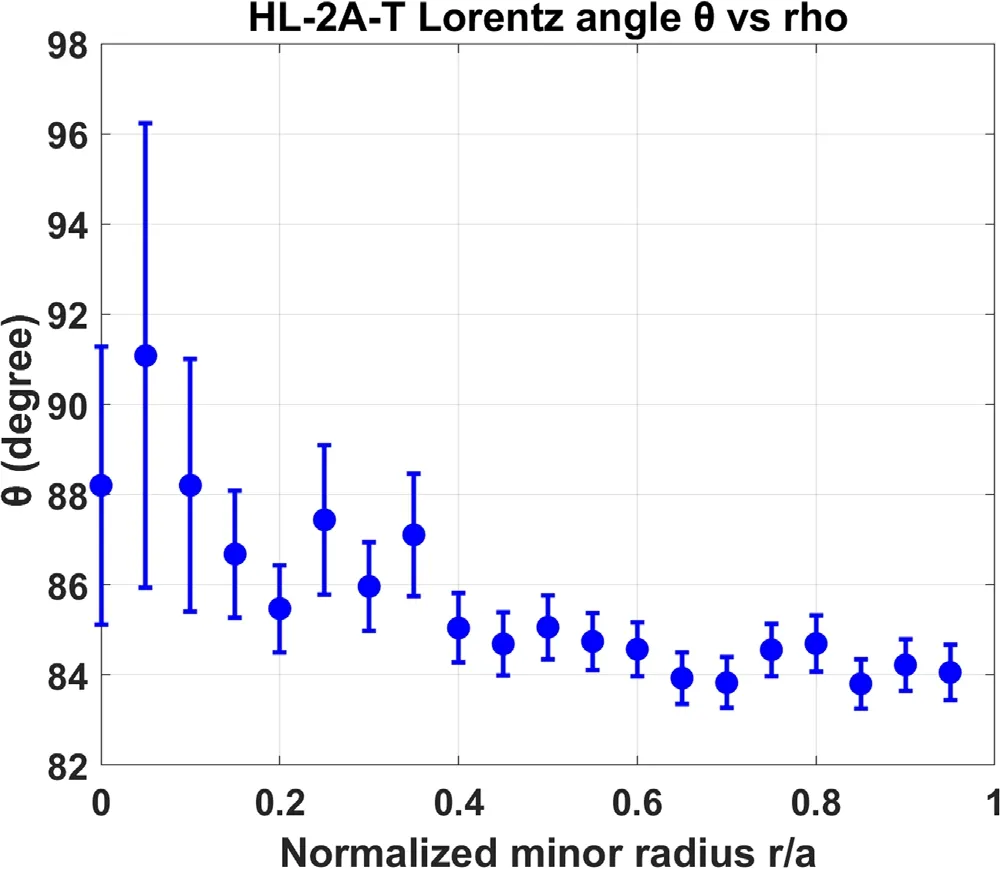
Figure 6.Simulation of HL-2A-T Lorentz angle θ versus normalized minor radius r/a with a simulation error bar.The pitch angle α=π/2-θ shows that the maximum pitch angle is 6°on the edge and 2°in the r/a = 0.
Spectra line emissions from carbon,CII (657.8 nm and 658.2 nm),FIDA spectra and bremsstrahlung radiation also appear in the experimental spectra,which were collected during discharge #19680 of HL-2A.The bremsstrahlung radiation originates in the bulk plasma due to the deceleration of electrons.Its wavelength profile,which is a continuum,is determined by electron densityne= (1-3.5) × 1019m-3in HL-2A,electron temperatureTe,and theZeffof the plasma(Zeffis effective charge number and it provides a measure of impurity content in the plasma) [48].The intensity of bremsstrahlung is much lower than the spectral intensity of MSE and edge PCX,which has little effect on the MSE results.We did not account for bremsstrahlung spectra in the MSE.However,it cannot be ignored when the electron density increases,for example,as at ITER.
The simulation code used the following monotonic fitting function for the HL-2A positive shear scenarioqprofile:q(r/a) =q(on axis) + [q(boundary) -q(on axis)] × (r/a)2[31,32].Theqprofile is given an initial set of parametersq(on axis)andq(boundary) by the MSE core and edge diagnostics results.Note that due to the high SNR of the core,the error is small,but due to the stray light in the edge area and the angle of the LOS,the diagnostic error is significant,and we find suitable initial setting parameters,especially forq(boundary) value.From the MSE diagnostic experiment results,we set initialq(0) to 1 andq(a)to 3.
The MSE spectra simulation model is illustrated in appendix B.Collisional radiative Marchuk MSE level population modelling gives the relative intensity ratio for the simulatedqprofile[49].The relative intensity ratios included:Iσ1/Iσ0,Iπ2/Iπ3,Iπ4/Iπ3,and theIπ-total/Iσ-total,which have a close relationship withneandEcollision.The simulation code SOS can give theneradial profile,and theEcollisioncan be derived fromENBI.References[31,32]give the modelling for the component’s intensity.We compare Lorentz angle θ and the total MSE spectra with the experimental one,update theq(0) andq(a) initial settings,and scan the best function curve that simulates theqprofile.Figure 6 gives the simulation of HL-2A-T Lorentz angle θ versus normalized minor radiusr/a,and figure 7 gives the simulationqprofile compared with the experimental #19680 one.
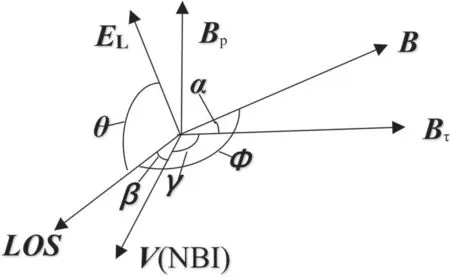
Figure A1. MSE diagnostics spatial and physical vector diagram.
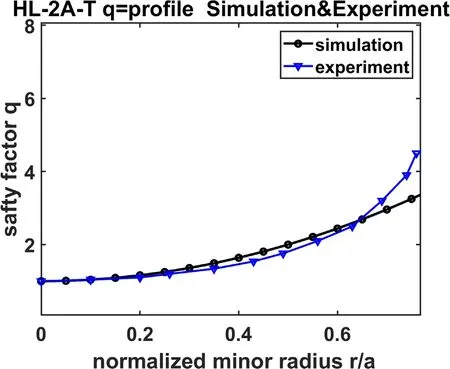
Figure 7. HL-2A experimental reconstruction of the safe factor q profile from the MSE spectra of #19680 compared with simulation results.
Theqprofile for #19680 in the radial position (0.0 <r/a<0.75) and the comparison with simulation results are given in figure 7.The relative errors between the experimental and simulation results are small for 0.0 <r/a<0.25 but increase gradually for 0.25 <r/a<0.75.A lower relative error is achieved in the core region because the MSE spectra have more significant Doppler shifts,which helps to distinguish MSE spectra from the edge.The LOS for the experimental MSE spectra is affected by reflection and stray light on the edge,where the spectra are integrated and have more than one reflection and stray light,which means the spectra overlap in the edge region.We tried to utilize the Zeeman splitting models to improve the accuracy of diagnostics in the edge region.However,using the Zeeman splitting model in the core region is challenging because the low spectral splitting line resolution due to the high plasma temperature induced significant Doppler broadening enhancement in the core region,as discussed in section 2.Zeeman splitting can reduce the effect of reflected light on the edge for P-VSD.
Another source of systematic error is from theIπ/Iσratio measurement.We assume that the diagnostic system has the same sensitivity for π and σ polarized light,Tf= 1 in equation (10).However,this assumption causes a system error[50].The reason is that a first mirror(FM)is introduced for HL-2A MSE diagnostics and adopts aluminium(Al)as the substrate with silver (Ag) reflection film.We measured all diagnostic channels’ MSE optical chain transmittance with a He-Ne laser (650 nm)R> 95%.The error mainly originates from the FM in the MSE optical chain.Since the FM is subjected to the sputtering deposition of plasma ions in a plasma environment,films or defects will be generated,resulting in a polarized lightIπ/Iσratio change.A comparison with the measured line ratio suggests that the reflectivity of the aluminium mirror was reduced by about 24% for σ components relative to π components in pulse#19949 on the JET [51].Measuring the change of the polarization light reflection by the FM to determine its influence on the HL-2Aqprofile is essential work for the future.
4.Conclusions
We have studied the Lorentz electric (EL) and magnetic (B)fields’influence on the VSD in the HL-2A tokamak.Spectral Stark splitting in MSE diagnostics during NBI provides an accurate physical model for the diagnostics of safety factorqin A-VSD,and the Zeeman splitting solves the influence of reflected light on P-VSD in the divertor to promote diagnostic accuracy.P-VSD primarily monitors the divertor region,but the reflected SOL region Balmer Hα(656.10 nm) and Dα(656.28 nm) spectra,which undergo different spectral Zeeman splitting and slight Doppler broadening and shift,have an impact.A-VSD concentrates on Doppler-shifted beam emissions,including bremsstrahlung,fast-ion loss emissions,MSE and impurity emission (CII) spectra.
The Zeeman effect caused visible spectral splitting in a magnetic field(B),and reconstruction spectra fitting has been studied in this work.The non-negligible reflected light from the wall(SOL)influenced the diagnostic results.We modelled the divertor and inner-wall spectra to reconstruct the spectra of different components.The relative errors of simulation and experimental results are from the divertor magnetic field(0.3%),inner-wall magnetic field (5%) and hydrogen-deuterium ratio (2.9%).The results related to the H/D ratio are consistent,which verifies the accuracy of our spectral splitting model.
The results of theqprofile obtained from simulation and experiment show that the MSE model with spectral Stark splitting verifies the spectral reconstruction in the experiment.However,the simulation code did not add bremsstrahlung,FIDA and CII spectra.The relative errors of the experimental and simulated results gradually increase in the region of 0.25 <r/a<0.75.The spectra at the edge are easily affected by reflection and stray light,which increases the experimental diagnostics error.A lower relative error is achieved in the core region because the MSE spectra have more significant Doppler shifts,which helps to distinguish such structures from passive edge structures (PCX).The results obtained by the simulation and experiment diagnostics are compared,verifying the model’s reliability and providing a reference for the future diagnostics of VSD in HL-2M.
Acknowledgments
This work is supported by the National Key Research and Development Program of China (No.2019YFE03020004)and National Natural Science Foundation of China (No.12175228).
Appendix A
The solution derives the safety factorqfrom MSE diagnostics spatial and physical vector diagram.
Angle definitions:
α is the angle between B and Bτ;
β is the angle between LOS and V(NBI);
γ is the angle between V(NBI) and Bτ;
θ is the angle between LOS and EL;
Φ is the angle between LOS and B;
The relationship between the angles:
where ELand B are perpendicular to each other.LOS,V(NBI)and Bτare in the midplane,and the Bpis in the vertical direction.
So,we have:
where pitch angle α = arctan (Bp/Bτ).
In HL-2A,β ≈52.1°,and γ ≈ 127.8°in the diagnostics layout,as shown in figure 1(d),so β+γ ≈ 180°,equations (A1) and (A2) can be written as:
So,we have:
where θ0is the angle without the poloidal magnetic field Bp.In figure A1,V(NBI)andBτare both in the midplane,and the EL0(ELwithout Bp) is in the vertical direction,so the angle between LOS and EL0is θ0= π/2.From equation (A6),the θ0= π/2,while α = 0.
Appendix B
Collisional radiative Marchuk MSE level population modelling is used to reconstruct the MSE spectra [31,32,49].
Normalization requires:
Alternatively,rewriting the equation in terms of established line ratios:
Introducing the σ-π line ratio:
Therefore,theIσ0component can be expressed entirely in terms of the multiplet sub-level line ratio andIπ-total/Iσ-totalgroup ratio,andRcan be obtained from the Lorentz angle θ or safety factorq.
猜你喜欢
文艺生活(艺术中国)(2022年2期)2022-04-21
科技创新导报(2021年31期)2021-05-10
医学前沿(2021年18期)2021-04-14
轻兵器(2020年8期)2020-08-26
大众文艺(2020年24期)2020-02-07
小学生学习指导(低年级)(2019年10期)2019-10-16
南风(2018年34期)2018-12-28
民间故事选刊·下(2018年5期)2018-05-18
南风(2018年12期)2018-01-31
百家讲坛(蓝版)(2017年11期)2017-02-08
 Plasma Science and Technology2023年2期
- Plasma Science and Technology的其它文章
- Efficient combination and enhancement of high-power mid-infrared pulses in plasmas
- Realization of Te0>10 keV long pulse operation over 100 s on EAST
- Solving Poisson equation with slowingdown equilibrium distribution for global gyrokinetic simulation
- Experimental studies of cusp stabilization in Keda Mirror with AXisymmetricity (KMAX)
- BITS: an efficient transport solver based on a collocation method with B-spline basis
- Optimization of X-mode electron cyclotron current drive in high-electron-temperature plasma in the EAST tokamak