
1981—2010年长江中下游地区单季稻生殖生长期对气候变化和技术进步的响应
2023-03-23 07:07刘二华周广胜武炳义宋艳玲何奇瑾吕晓敏周梦子
作物学报 2023年5期
刘二华 周广胜,,* 武炳义 宋艳玲 何奇瑾 吕晓敏 周梦子
1981—2010年长江中下游地区单季稻生殖生长期对气候变化和技术进步的响应
刘二华1,2,3周广胜1,2,3,4,*武炳义2宋艳玲1,3何奇瑾4吕晓敏1,3周梦子1,3
1中国气象科学研究院, 北京 100081;2复旦大学大气科学研究院, 上海 200439;3中国气象科学研究院与郑州大学生态气象联合实验室, 河南郑州 450001;4中国农业大学资源与环境学院, 北京 100193
作物生殖生长期长度与作物产量和品质密切相关。为深入探究作物生殖生长期长度(reproductive growth period lengths, RGLs)对气候变化和技术进步的响应, 基于1981—2010年长江中下游地区单季稻生殖生长期和气象数据, 量化不同RGLs (孕穗期—抽穗期(booting to heading, BDHD)、抽穗期—乳熟期(heading to milking, HDMS)、乳熟期—成熟期(milking to maturity, MSMD)和孕穗期—成熟期(booting to maturity, BDMD))对平均温度(mean temperature, TEM)、累积降水量(cumulative precipitation, PRE)和累积日照时数(cumulative sunshine duration, SSD)的敏感性, 并分离气候变化和技术进步对不同RGLs的影响。结果表明, 1981—2010年长江中下游地区单季稻BDMD呈延长趋势(0.24 d a–1), 其中, HDMS延长趋势最明显(0.16 d a–1)。气候因子中高温和寡照不利于单季稻不同RGLs延长, 其中, TEM对BDHD、HDMS和MSMD变化趋势的平均相对贡献分别为–50.0%、–50.7%和–21.9%, SSD对BDHD、HDMS和MSMD变化趋势的平均相对贡献分别为–47.2%、–48.7%和–67.6%。技术进步弥补了气候变化对不同RGLs变化趋势的不利影响。研究表明, 技术进步可能是当前单季稻稳产高产和趋利避害的主要手段, 未来可以采用较长生殖生长期和耐热性品种来适应持续的气候变化。
单季稻; 气候变化; 生殖生长期; 技术进步
作物生育期是重要的农业信息, 对合理安排作物布局、调控作物生长发育和预测产量具有重要意义[1-2]。同时, 作物生育期在陆面动态过程、生物物理过程中扮演重要角色[3]。作物关键生育期的相对长短是决定作物产量的关键因素[4]。气候变暖普遍加快作物生长发育, 缩短作物生长期, 缩短作物生物量的积累时间, 威胁作物的生产力和粮食安全[5]。因此, 随气候变暖的加剧[6], 作物生育期对气候变化的响应已然成为研究的热点[7]。
作物生育期变化反映了作物生长过程对自然因素和人为因素的综合响应[8-9], 自然因素主要为气候因素(包括温度、水分和光照等), 人为因素表现为技术进步(包括品种、种植方式、栽培管理和生产投入等)。作物生育期的变化表现为提前或推迟, 生长期缩短或延长[10]。研究表明中国单季稻生育期呈延长趋势[11-13], 尤其以生殖生长期(reproductive growth periods lengths, RGLs)显著延长为主[14]。同时, 中国玉米、小麦、大豆以及棉花等作物RGLs普遍延长[5,15-19]。已有大量研究通过统计模型和作物模拟模型等多种方法广泛评价了作物生育期对气候变化和技术进步的响应[20-22]。例如, Zhang等[14]的研究表明水稻RGLs由温度和品种特性共同决定, 温度升高加快水稻抽穗期, 品种改变延缓水稻抽穗期。而Hu等[23]认为中国水稻生育期延长主要由播种期和品种改变调节, Bai等[24]进一步研究表明播种期显著影响水稻营养生长期, 而对RGLs影响不明显, 品种改变使得水稻RGLs每10年延长0.2~2.8 d。然而, 气候因素(如降水量和日照时数)对作物生育期的影响也至关重要, 但以往研究通常忽略这些气候因素[19,25-26]。因此, 厘清气候变化和技术进步对作物生育期的影响程度对于准确实施适应气候变化的管理措施具有重要参考价值[5,25,27-28]。由于技术的不断进步, 作物生育期对气候变化的响应难以评估[8]。当前已有一些研究开展了关于量化气候变化和作物管理对作物生育期的影响研究[23,26], 但是, 鲜少有关于气候变化和技术进步对作物不同RGLs变化趋势的综合定量评价研究。
水稻(L.)是世界上一半以上人口的主食[29], 长江中下游地区是中国最古老最重要的水稻主产地之一[30], 水稻种植面积和总产量均占全国45%以上[31]。长江中下游地区水稻种植制度为单季稻和早、晚双季稻[32]。1980—2008年呈现出单季稻种植面积增加和双季稻种植面积减少的态势[33-35], 这表明单季稻在长江中下游地区水稻生产中占有越来越重要的地位。本研究假设单季稻不同RGLs是气候变化和技术进步综合作用的结果。基于以上假设, 本研究的目标是(1) 阐明长江中下游地区单季稻不同RGLs时空变化特征; (2) 单季稻不同RGLs对平均温度(mean temperature, TEM)、累积降水量(cumulative precipitation, PRE)和累积日照时数(cumulative sunshine duration, SSD)的敏感性; (3) 分离和量化气候变化和技术进步对单季稻RGLs变化趋势影响的贡献。
1 材料与方法
1.1 研究区域与资料来源
研究区域位于中国长江中下游地区(26°~35°N, 103°~122°E), 该地区属于雨热同期的亚热带季风气候区。本研究涉及的地区主要包括江苏、河南南部、湖北、重庆和四川东部(图1)。本研究所用资料主要包括气象资料和单季稻生育期资料, 资料均来源于中国气象局。气象资料主要包括1981—2010年10个气象站点观测的逐日平均温度、降水量和日照时数。根据长期观测资料缺失情况, 选取的10个农业气象站位于与上述气象站相同的地点。单季稻生育期主要包括分蘖期、孕穗期、抽穗期、乳熟期和成熟期, 本研究将生殖生长阶段进一步划分为孕穗期—抽穗期(booting to heading, BDHD)、抽穗期—乳熟期(heading to milking, HDMS)、乳熟期—成熟期(milking to maturity, MSMD)和孕穗期—成熟期(booting to maturity, BDMD), 同时探讨了分蘖期—孕穗期(tillering to booting, TDBD)的变化特征。

图1 10个气象站点地理位置
JXH、JZJ、HGS、HXY、HFX、HZX、SDZ、SGP、CFD和CYY分别表示兴化站、镇江站、固始站、信阳站、房县站钟祥站、大竹站、高坪站、丰都站和酉阳站。矢量地图数据来源: 全国地理信息资源目录服务系统(https://www.webmap.cn/)。
JXH, JZJ, HGS, HXY, HFX, HZX, SDZ, SGP, CFD, and CYY represent Xinghua station, Zhenjiang station, Gushi station, Xinyang station, Fangxian station, Zhongxiang station, Dazhu station, Gaoping station, Fengdu station, and Youyang station, respectively. The above vector map is from the National Catalogue Service for Geographic Information (https://www.webmap.cn/).
1.2 分析方法
利用线性回归方法分析单季稻关键生殖生长期和不同RGLs (Booting、Heading、Milking、Maturity、TDBD、BDHD、HDMS、MSMD和BDMD)以及相应时期气候因子(TEM、PER和SSD)的变化趋势, 采用双尾t检验分析确定统计显著性。
Y=T×X+B(1)
式(1)中,Y是第年各变量的值; T为线性回归斜率;X是年份(= 1, 2, 3, …, 30); B是截距。
面板回归模型法[36]已被证明适合气候变化影响的研究[37]。本研究利用面板回归模型法得到单季稻RGLs对气候因子的响应及其敏感性。为降低气候因子间的多重共线性, 本研究根据相关性分析并结合前人研究[25,38], 选取TEM、PRE和SSD三个气候因子作为预测变量。
首先, 构建了5个单季稻RGLs (TDBD、BDHD、HDMS、MSMD和BDMD)多元面板回归模型。模型形式如下:
RGLt,s=β0,s+β1×TEMt,s+β2×PREt,s+β3×SSDt,s+(2)
式(2)中, RGLt,s表示第s站点和第t年的生殖生长期长度(d), TEMt,s、PREt,s和SSDt,s分别表示第s站点和第t年的生殖生长阶段的TEM (℃)、PRE (mm)和SSD (h)。β0表示站点的固定效应。β1、β2和β3分别表示RGLs对TEM、PRE和SSD的敏感性(d ℃–1、d mm–1和d h–1)。ε是一个随机误差项, 表示气候变化以外的因素对作物生育期的影响。
其次, 将各个站点单季稻分蘖期、孕穗期、抽穗期、乳熟期和成熟期的日期确定为1981—2010年实际观测日期平均值, 统计1981—2010年各站点气候因子在不同RGLs的变化趋势, 据此分离气候变化趋势对单季稻RGLs变化趋势的影响[39]。因此, 仅受气候变化影响的单季稻RGLs变化趋势的估算方法如下:
TRGL_cli=β1×TTEM+β2×TPRE+β3×TSSD(3)
式(3)中, TRGL_cli表示气候变化引起的生殖生长期变化趋势。TTEM、TPRE和TSSD分别表示特定生殖生长阶段的TEM、PRE和SSD的变化趋势(℃ a–1、mm a–1和h a–1)。TTEM、TPRE和TSSD均由公式(1)计算得到。
第三, 从气候变化和技术进步的综合影响中消除气候变化的影响, 得到技术进步对单季稻RGLs变化趋势的影响:
TRGL_tec=TRGL_cli_tec–TRGL_cli(4)
式(4)中, TRGL_tec表示技术进步对单季稻RGLs变化趋势的影响(d a–1), TRGL_cli_tec表示气候变化和技术进步对单季稻RGLs变化趋势的综合影响(d a–1), 即实际观测得到的不同RGLs变化趋势。TRGL_cli_tec可由公式(1)计算得到。
最后, 分离出气候变化和技术进步导致单季稻RGLs变化趋势的贡献, 计算式如下:


式中, CRGL_cli和CRGL_tec分别表示气候变化和技术进步对RGLs变化趋势的贡献(%), RCRGL_TEM表示TEM对单季稻RGLs变化趋势的平均相对贡献(%), 同样,利用公式(7)计算PRE和SSD对单季稻RGLs变化趋势的平均相对贡献(RCRGL_PRE和RCRGL_SSD)。参考Li等[10]研究, 计算气候变化和技术进步对单季稻RGLs变化趋势的平均贡献, 以及各个气候因子对单季稻RGLs变化趋势的平均相对贡献。
2 结果与分析
2.1 单季稻生殖生长期时空变化
1981—2010年长江中下游地区单季稻分蘖期、孕穗期、抽穗期、乳熟期和成熟期以及不同RGLs的时空变化趋势如图2所示。研究发现, 分蘖期以0.37 d a–1的趋势提前, 其中10个站点中9个呈提前趋势, 7个显著提前。不同于其他站点, 兴化站分蘖期呈显著推迟趋势(0.39 d a–1)。孕穗期和抽穗期时空变异较大, 平均变化趋势分别为0.08 d a–1和0.11 d a–1。乳熟期和成熟期主要呈不同程度的推迟趋势, 分别为0.27 d a–1和0.32 d a–1。以上结果表明生殖生长期前生育期呈提前趋势, 随生育进程推进, 各个生育期逐渐推迟。
图2-f~j分别表示长江中下游地区单季稻TDBD、BDHD、HDMS、MSMD和BDMD时空变化趋势。分蘖期显著提前导致TDBD以0.45 d a–1的速率延长, 其中10个站点中9个呈延长趋势, 7个显著延长, 而钟祥站TDBD以0.34 d a–1速率缩短。单季稻BDHD变化不明显(0.03 d a–1)。单季稻HDMS以0.16 d a–1速率延长, MSMD变化不明显(0.05 d a–1), BDMD以0.24 d a–1速率延长。综合而言, 长江中下游地区单季稻RGLs呈延长趋势, 其中以HDMS延长为主。
2.2 单季稻生殖生长期气候因子变化趋势
1981—2010年长江中下游地区单季稻不同RGLs的TEM、PRE和SSD特征及变化趋势如下图3。研究发现, 长江中下游地区单季稻分蘖期到成熟期的TEM先升高后降低(图3-a), BDHD的TEM达到最高(27.2℃), MSMD的TEM最低(24.5℃)。生殖生长期前(TDBD)的平均PRE (120.5 mm)和平均SSD (245.5 h)最高, BDHD的平均PRE (26.6 mm)和平均SSD (60.1 h)最低(图3-b, c)。就单季稻整个生殖生长阶段(BDMD)而言, TEM增加趋势不明显, 而MSMD的TEM有略微下降趋势(–0.017℃ a–1), 其他RGLs的TEM均以增加为主。单季稻MSMD的TEM降低可能是乳熟期和成熟期推迟导致TEM季节性降低引起的。单季稻BDHD的TEM增加趋势最明显(0.027℃ a–1), 其次为HDMS的TEM (0.013℃ a–1) (图3-d)。单季稻BDMD的平均PRE呈增加趋势(1.27 mm a–1), 其中, HDMS的平均PRE增加趋势最明显(0.71 mm a–1), BDHD和MSMD的平均PRE变化趋势不明显(图3-e)。单季稻BDMD的平均SSD以减小为主(-0.17 h a–1), 其中, BDHD和MSMD的平均SSD呈减小趋势(–0.16 h a–1和–0.45 h a–1), 而HDMS的平均SSD呈增加趋势(0.44 h a–1) (图3-f)。由此可见, 单季稻BDHD的气候变暖速率最强, 平均PER变化不明显,平均SSD呈减小趋势, HDMS的气候变暖速率次强, 平均PRE和平均SSD均主要呈增加趋势, 其他生殖生长阶段气候因子变化趋势各异。

图2 1981–2010年长江中下游地区单季稻生殖生长期和生殖生长阶段长度变化趋势
a、b、c、d、e、f、g、h、i和j分别表示分蘖期、孕穗期、抽穗期、乳熟期、成熟期、分蘖期–孕穗期、孕穗期–抽穗期、抽穗期–乳熟期、乳熟期–成熟期和孕穗期–成熟期。各指标变化趋势由1981–2010年观测的各生殖生长期时间序列依据公式(1)计算得到。*表示在0.05概率水平差异显著, no表示统计不显著。矢量地图数据来源: 全国地理信息资源目录服务系统(https://www.webmap.cn/)。
a, b, c, d, e, f, g, h, i, and j represent tillering stage, booting stage, heading stage, milking stage, maturity stage, tillering-booting, booting-heading, heading-milking, milking-maturity, and booting-maturity, respectively. Trends of indexes were calculated according to formula (1) for each reproductive growth period observed from 1981 to 2010. *:< 0.05; no: no significant difference. The above vector map is from the National Catalogue Service for Geographic Information (https://www.webmap.cn/).
2.3 单季稻生殖生长期对气候因子的敏感性分析
单季稻不同RGLs对气候因子(TEM、PRE和SSD)的敏感性如表1所示。面板模型回归系数β1、β2和β3分别表示不同RGLs对TEM、PRE和SSD的敏感性, 决定系数(2)表示模型回归系数对因变量的解释率。结果表明, TEM与RGLs均呈负相关关系, TEM每升高1℃, BDHD、HDMS和MSMD的平均长度分别缩短0.77、1.00和1.17 d, 且RGLs对TEM的敏感性随生育进程增加。PRE和SSD与不同RGLs均呈正相关关系, PRE每增加100 mm, BDHD、HDMS和MSMD的平均长度分别延长1.24、0.86和0.71 d, 且RGLs对PRE的敏感性随生育进程减小; SSD每增加100 h, BDHD、HDMS和MSMD的平均长度分别延长7.46、8.06和6.88 d。总体而言, TEM增加不利于延长RGLs, PRE和SSD增加有利于延长RGLs。标准化处理不同RGLs对气候因子的敏感性表明BDHD、HDMS和MSMD均对SSD的敏感性最强, 对TEM的敏感性次之, 对PRE的敏感性最小(表2)。
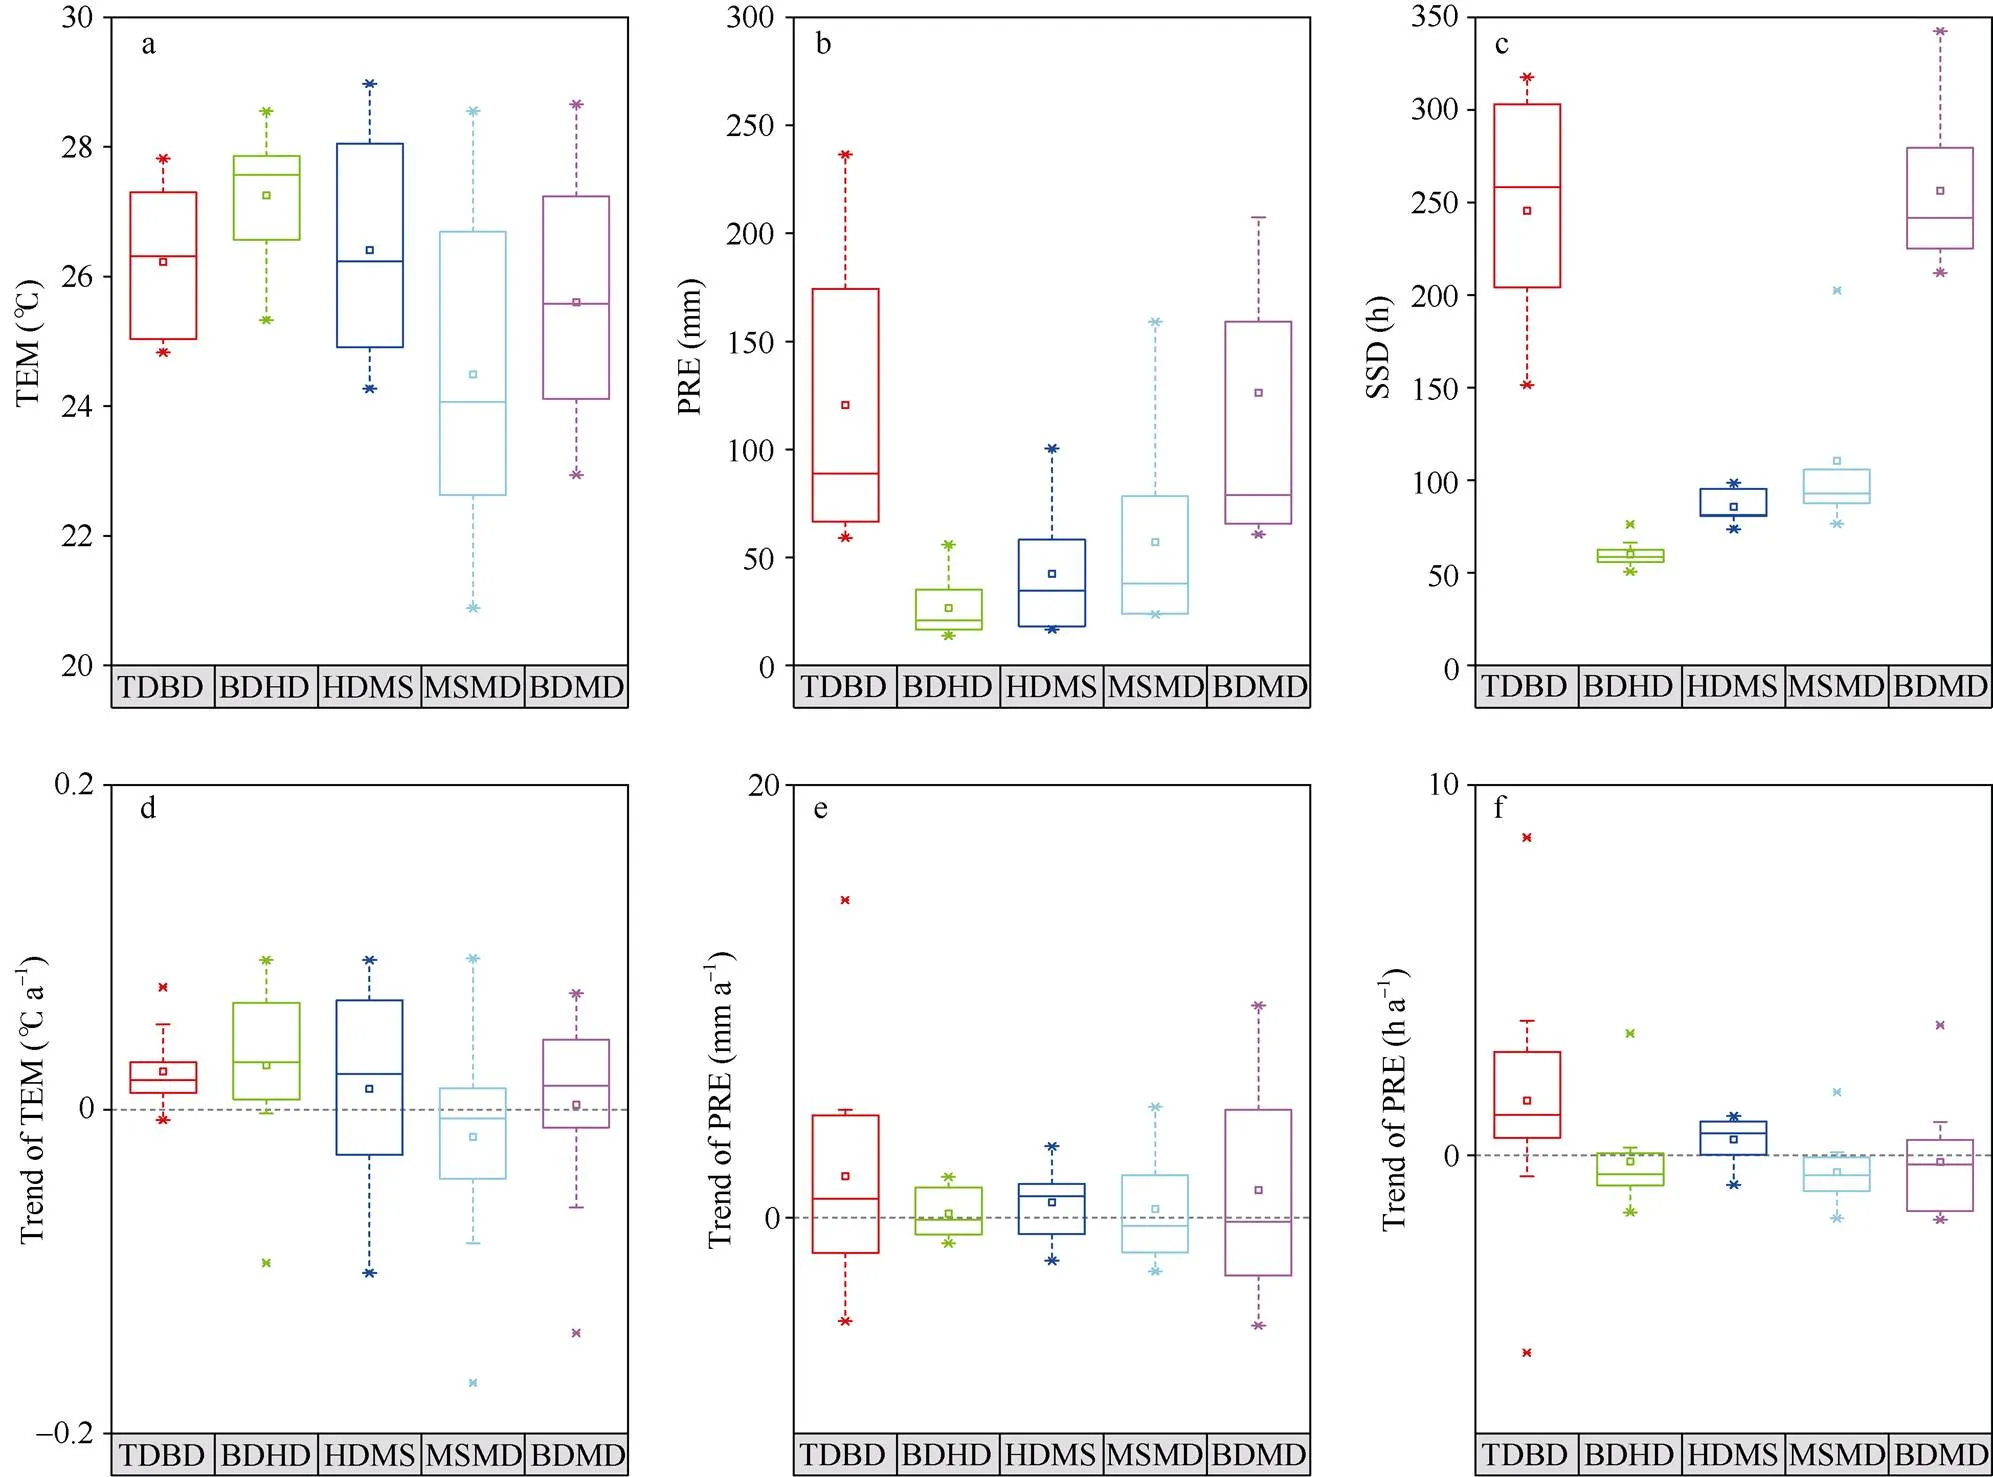
图3 不同生殖生长期气候因子变化特征
a、b和c分别表示不同生殖生长期的平均温度、累积降水量和累计日照时数; d、e和f分别表示平均温度、累积降水量和累积日照时数的变化趋势。TEM、PRE和SSD分别表示平均温度、累积降水量和累积日照时数。TDBD、BDHD、HDMS、MSMD和BDMD分别表示分蘖期–孕穗期、孕穗期–抽穗期、抽穗期–乳熟期、乳熟期–成熟期和孕穗期–成熟期。各指标变化趋势由1981–2010年观测的气象数据时间序列依据公式(1)计算得到。
a, b, and c represent mean temperature, cumulative precipitation, and cumulative sunshine duration of different reproductive growth periods lengths, respectively. d, e, and f represent trends of mean temperature, cumulative precipitation, and cumulative sunshine duration, respectively. TEM, PRE, and SSD represent mean temperature, cumulative precipitation, and cumulative sunshine duration, respectively. TDBD, BDHD, HDMS, MSMD, and BDMD represent tillering to booting, booting to heading, heading to milking, milking to maturity, and booting to maturity, respectively. The change trends of indexes were calculated by the time sequence of meteorological data observed from 1981 to 2010 based on formula (1).

表1 面板模型中不同生殖生长期对平均温度、累计降水量和累计日照时数的相关系数
*:< 0.05;**:< 0.01.
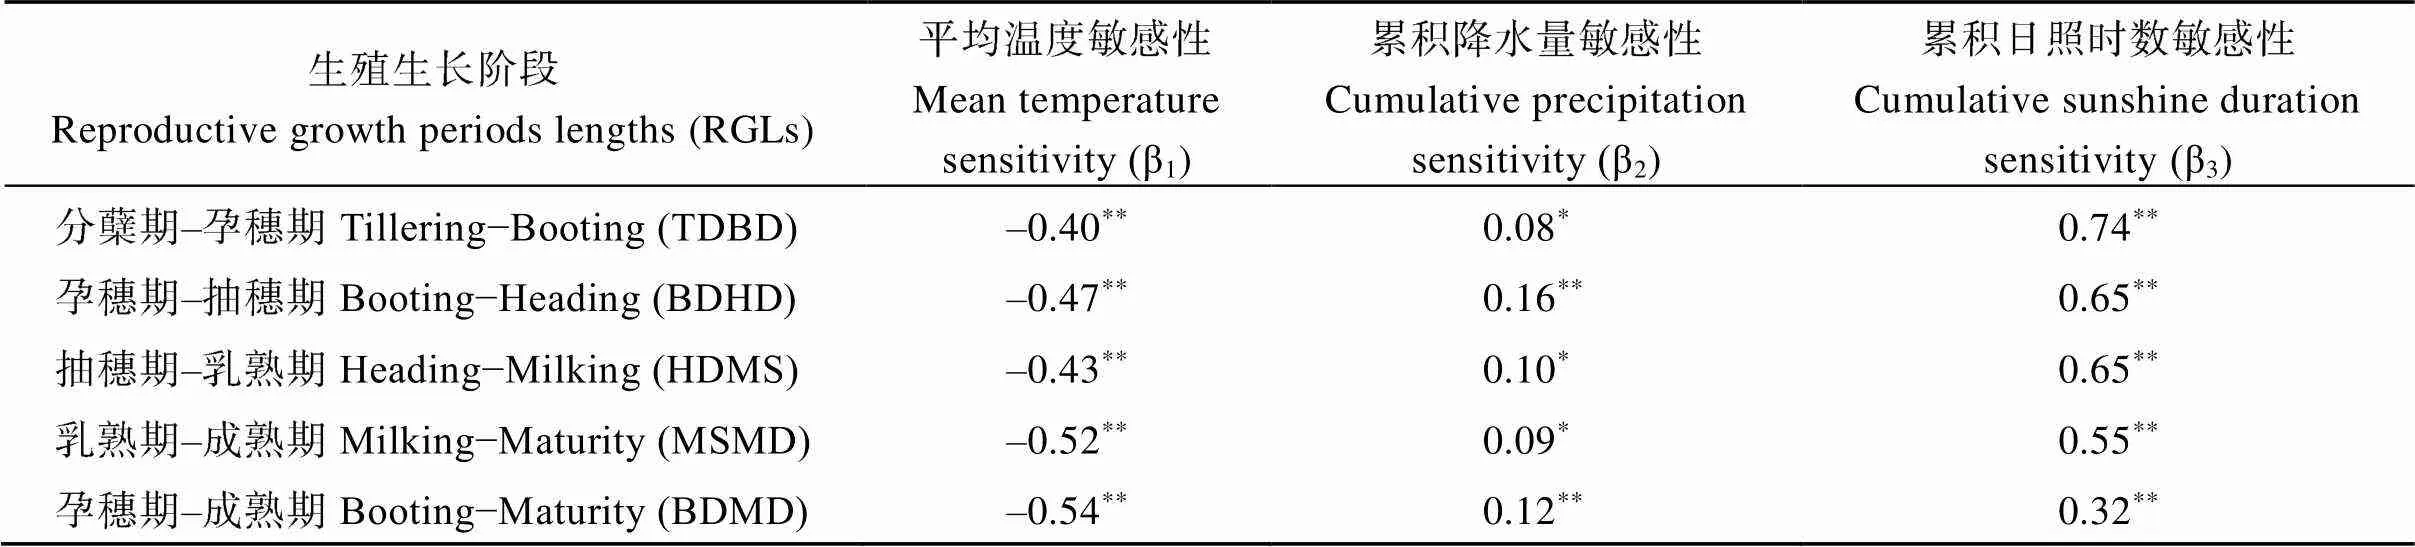
表2 标准化面板模型中不同生殖生长期对平均温度、累计降水量和累计日照时数的相关系数
*表示在0.05概率水平差异显著,**表示在0.01概率水平差异显著。*:< 0.05;**:< 0.01.
2.4 气候变化和技术进步对生殖生长期变化趋势的影响以及贡献
气候变化和技术进步对单季稻不同RGLs变化趋势的单独影响如图4。研究发现, 气候变化不利于RGLs延长, 对不同RGLs均有缩短效应。技术进步有利于延长不同RGLs, 对HDMS延长效应最大, 延长趋势为0.22 d a–1, 对全生殖生长期的延长趋势为0.33 d a–1。气候变化和技术进步对RGLs变化趋势的综合作用与技术进步对RGLs变化趋势的单独作用相似。
分离后的气候变化和技术进步对单季稻RGLs变化趋势的平均贡献如图5。研究发现, 气候变化和技术进步对单季稻BDMD变化趋势的平均贡献分别为–20.0%和80.0% (图5-a)。然而, 气候变化和技术进步的平均贡献在单季稻BDHD、HDMS和MSMD存在差异。对于BDHD, 气候变化的平均贡献(–65.1%)大于技术进步的平均贡献(34.9%), 对于HDMS, 气候变化的平均贡献(–24.7%)小于技术进步的平均贡献(75.3%), 而对于MSMD, 气候变化的平均贡献(–48.1%)略微小于技术进步的平均贡献(51.9%)。由此可见, 技术进步对RGLs变化趋势的延长起主导作用, 技术进步对RGLs变化趋势的贡献弥补了气候变化的不利影响。
TEM、PRE和SSD对单季稻RGLs变化趋势的平均相对贡献如图5-b。PRE对不同RGLs变化趋势的平均相对贡献绝对值最小。TEM和SSD是影响RGLs变化趋势的主要气候因子, 两者对不同RGLs变化趋势的平均相对贡献差异大。对于TDBD, TEM的平均相对贡献最大(–69.9%), SSD的平均相对贡献次之(–27.7%), 表明该阶段单季稻生长发育主要受TEM的影响。对于BDHD, TEM和SSD的平均相对贡献相当(–50.0%和–47.2%), HDMS变化趋势受气候因子的影响与BDHD类似, TEM和SSD的平均相对贡献相当(–50.7%和–48.8%), 表明这2个阶段单季稻生长发育受制于TEM和SSD。对于MSMD, SSD的平均相对贡献最大(–67.6%), TEM的平均相对贡献次之(–21.9%), 表明该阶段单季稻生长发育主要受SSD的影响。因此, TEM和SSD均为影响长江流域地区单季稻RGLs变化趋势的主要气候因子。

图4 气候变化和技术进步对单季稻不同生殖生长期变化趋势的影响
T_cli、T_tec、T_cli_tec分别表示气候因素、技术进步、气候因素和技术进步综合作用对不同生殖生长期长度的影响趋势。生殖生长期长度缩写同图3。
T_cli, T_tec, and T_cli_tecindicate the effect trends of climatic factors, technological progress, and the combined of climatic factors and technological progress on different reproductive growth periods lengths, respectively. Abbreviations of different reproductive growth periods lengths are the same as those given in Fig. 3.

图5 气候变化和技术进步对单季稻生殖生长期长度的平均贡献
a表示气候变化和技术进步对不同生殖生长期的平均贡献; b表示气候因子对不同生殖生长期的平均相对贡献。CRGL_cli和CRGL_tec分别表示气候因素和技术进步对不同生殖生长期长度的平均贡献; RCRGL_TEM、RCRGL_PRE和RCRGL_SSD分别表示平均温度、累积降水量和累积日照时数对不同生殖生长期长度的平均相对贡献。生殖生长期长度缩写同图3。
a: the mean contributions of climate change and technological progress to different reproductive growth periods lengths; b: the mean relative contributions of climatic factors to different reproductive growth periods lengths. CRGL_cliand CRGL_tecindicate mean contribution of climatic factors and technological progress to different reproductive growth periods lengths, respectively; RCRGL_TEM, RCRGL_PRE, and RCRGL_SSDindicate mean relative contribution of mean temperature, cumulative precipitation, and cumulative sunshine duration to different reproductive growth periods lengths, respectively. Abbreviations of different reproductive growth periods lengths are the same as those given in Fig. 3.
3 讨论
3.1 单季稻生殖生长期对气候变化和技术进步的响应
中国不同地区水稻生育期和生长阶段长度的变化趋势各不相同[38]。研究发现, 长江中下游单季稻乳熟期和成熟期显著推迟, 生殖生长期尤其是抽穗期到乳熟期显著延长(图1), 该研究结果与Tao等[32]的结果一致。抽穗期到乳熟期延长为灌浆期提供了充足的时间, 从而有利于生物量累积和产量提高[40]。本研究结果表明, 过去30年长江中下游地区农民采用了长生殖生长期单季稻品种, 这也表明延长单季稻生殖生长期是适应气候变化的有效措施[38]。
气候变化对作物生育期的影响效应因研究对象和生育期时段不同而存在差异[12]。本研究表明单季稻RGLs随平均温度的升高而缩短, 随累积降水量和累积日照时数的增加而延长, 该结果与以往一些研究结果一致[11,25], 而与Liu等[38]的研究不同。其他作物生育期对温度、累积降水量和累积日照时数的响应与本研究结论一致[7,18,41]。本研究揭示了孕穗期至抽穗期、抽穗期至乳熟期和乳熟期至成熟期对累积日照时数的敏感性最强, 对平均温度的敏感性次之, 对累积降水量的敏感性最低。平均温度和累积日照时数对不同生殖生长期变化趋势的平均相对贡献占比均较大, 且两者的长期变化趋势均不利于生殖生长期延长, 这进一步表明高温和寡照是长江中下游地区单季稻生殖生长期的主要限制因子。本研究发现气候变化对单季稻生殖生长期的贡献小于技术进步, 并且技术进步在延长生殖生长期变化趋势上占主导作用(图5), 该结果与Li等[10]、Wang等[12]、Liu和Dai[27]利用统计方法和作物模型法的研究结果一致。因此, 采用长生殖生长期品种, 可缓解气候变化带来的生育期缩短的负面影响[42]。
3.2 单季稻生殖生长期适应气候变化的措施
实施作物管理有利于协调水稻生育进程, 充分利用水稻生长季的有效光温资源, 获得最大的光合生产量, 提高结实率和千粒重, 实现高产、优质和高效栽培[23]。1981—2010年中国单季稻主产区高温持续时间和高温强度显著上升[43]。湖北中东部、安徽中部、江苏西部、浙江北部和湖南东北部均易发生热胁迫, 在未来的2021—2050年和2071—2100年2个时段, 整个区域的热胁迫显著增加[44]。长江中下游地区热胁迫主要发生在7月至8月, 该时间段正值单季稻生殖生长阶段, 尤其是单季稻开花期和灌浆期与最高气温时期重叠[45-46], 张倩等[47]研究也表明长江中下游地区热胁迫主要影响单季稻孕穗期、开花期和灌浆期。由本研究各生殖生长阶段气候因子变化特征可知, 长江中下游地区单季稻产量形成关键期处于热胁迫容易发生的时段。且研究表明单季稻乳熟期前后为温度敏感期[48], 本研究结果也证实了这一点(表2)。而这些关键阶段的热胁迫是导致水稻减产的主要原因[29]。因此单季稻生殖生长期极易遭受热胁迫的影响, 而避免高温是预防热胁迫的主要策略[47], 培育耐热品种是保障粮食安全的最有效措施之一[49]。优化播种期是缓解气候变暖不利影响的另一有效措施, Bai等[24]研究表明调整播种期主要改变了单季稻的开花期和成熟期, 而对生殖生长期长度没有影响, 因此调整播种期获得不同的光温配置是提高水稻资源利用率和适应气候变化的能力的重要途径[50]。长江中下游地区适当早播可提高单季稻品种的光温资源利用[51], 合理的播种期科学配套适宜单季稻品种类型对充分利用当地光温资源、发挥品种潜力、确保高产稳产具有十分重要的意义。因此, 单季稻提前播种以避开花期高温、转向现有耐高温品种以及培育长生殖生长期优良品种等3项适应性措施可在不同程度上有效抵消气候变化的负面影响[52]。另外, 合理灌溉、施肥和喷洒外源化学物质可以缓解外界环境的不利影响。例如, 灌溉是降低水稻花期冠层温度的一种有效的实时栽培措施[46], 合理灌溉可以缓解因气候变暖导致的开花期提前[53];灌浆期热胁迫影响单季稻品质, 主要通过降低叶片抗氧化酶活性, 从而降低光合作用, 导致光合同化物降低等[54], 灌浆期前喷洒外源亚精胺可显著提高超氧化物歧化酶和过氧化物酶的活性, 降低丙二醛的积累, 提高热胁迫下水稻叶片的可溶性糖含量, 维持叶片的渗透平衡, 提高光合和蒸腾速率[55]; 施氮可以增强单季稻生殖生长期对热胁迫的耐受性, 进而增加叶片寿命和生长期长度, 然而, 需肥量应根据当地水稻各生育阶段实际日照状况计算得到, 日照不足时应少施肥。例如, 长江中下游地区分蘖期到孕穗期和抽穗期到乳熟期日照时数呈增加趋势(图3), 这2个关键生长阶段可以适当施肥。
3.3 问题和挑战
研究气候变化和技术进步对作物生育期长度的影响十分关键。气候变化和技术进步对作物生育期的定量影响最大的问题仍然是有效资料的匮乏, 这在理解生育期响应气候变化机制方面仍存在很大的不确定性。现有长期作物生育期观测资料是不同站点不同技术措施下得到的, 每个站点品种类型、施肥量、灌溉量以及农药使用等相关资料很难准确获得, 因此技术进步的贡献仅是一个综合结果, 不同管理措施难以定量化, 这可能限制了作物适应气候变化的精细化措施的实施。以往研究通常用品种替换代替技术进步的影响, 一定程度上可能高估了品种改变对作物生育期的影响。而基于田间试验的有关品种变化对作物生育期影响的资料是有限的[5]。因此, 今后应利用田间试验、原位观测和模型模拟等多源数据开展研究[9,18,25]。
4 结论
本研究详细地分析了1981—2010年长江中下游地区单季稻不同生殖生长期长度时空变化特征, 以及单季稻不同生殖生长期长度对气候变化和技术进步的响应。近30年来长江中下游地区单季稻乳熟期和成熟期推迟, 全生殖生长期延长, 其中以抽穗期到乳熟期延长为主。平均温度升高缩短了单季稻生殖生长期长度, 累积降水量和累积日照时数增加延长了单季稻生殖生长期长度, 且生殖生长期长度对累积日照时数的敏感性最强、对平均温度的敏感性次之, 对降水量的敏感性最小。长江中下游地区高温和寡照不利于单季稻生殖生长期的延长, 而技术进步弥补了气候变化对生殖生长期的缩短效应。因此, 气候变暖背景下, 长江中下游地区采取强耐热型和长生殖生长期单季稻品种仍然是适应气候变化的关键措施。
[1] Liu Y J, Bachofen C, Wittwer R, Silva D G, Sun Q, Klaus V H, Buchmann N. Using PhenoCams to track crop phenology and explain the effects of different cropping systems on yield., 2022, 195: 103306.
[2] van Vliet A J H, Bron W A, Mulder S, van der Slikke W, Odé B. Observed climate-induced changes in plant phenology in the Netherlands., 2013, 14: 997–1008.
[3] Liu F S, Chen Y, Shi W J, Zhang S, Tao F L, Ge Q S. Influences of agricultural phenology dynamic on land surface biophysical process and climate feedback., 2017, 27: 1085–1099.
[4] Mohapatra S, Tripathy S K, Mohanty A K, Tripathy S. Effect of heat stress on yield and economics of rice (L.) cultivars under different sowing dates., 2021, 23: 38–45.
[5] Wang Z B, Chen J, Tong W J, Xu C C, Fu C. Impacts of climate change and varietal replacement on winter wheat phenology in the North China Plain., 2018, 12: 251–263.
[6] Piao S L, Ciais P, Huang Y, Shen Z H, Peng S S, Li J S, Zhou L P, Liu H Y, Ma Y C, Ding Y H, Friedlingstein P, Liu C Z, Tan K, Yu Y Q, Zhang T Y, Fang J Y. The impacts of climate change on water resources and agriculture in China., 2010, 467: 43–51.
[7] Liu Y J, Qin Y, Ge Q S, Dai J H, Chen Q M. Reponses and sensitivities of maize phenology to climate change from 1981 to 2009 in Henan province, China., 2017, 27: 1072–1084.
[8] He L, Asseng S, Zhao G, Wu D R, Yang X Y, Zhuang W, Jin N, Yu Q. Impacts of recent climate warming, cultivar changes, and crop management on winter wheat phenology across the Loess Plateau of China., 2015, 200: 135–143.
[9] Wang Z, Chen J, Li Y, Li C, Zhang L, Chen F. Effects of climate change and cultivar on summer maize phenology., 2016, 10: 509–526.
[10] Li N, Li Y, Biswas A, Wang J H, Dong H Z, Chen J H, Liu C C, Fan X Y. Impact of climate change and crop management on cotton phenology based on statistical analysis in the main-cotton- planting areas of China., 2021, 298: 126750.
[11] Bai H Z, Xiao D P. Spatiotemporal changes of rice phenology in China during 1981−2010., 2020, 140: 1483–1494.
[12] Wang X H, Ciais P, Li L, Ruget F, Vuichard N, Viovy N, Zhou F, Chang J F, Wu X C, Zhao H F. Management outweighs climate change on affecting length of rice growing period for early rice and single rice in China during 1991–2012., 2017, 233: 1–11.
[13] Ye T, Zong S, Kleidon A, Yuan W P, Wang Y, Shi P J. Impacts of climate warming, cultivar shifts, and phenological dates on rice growth period length in China after correction for seasonal shift effects., 2019, 155: 127–143.
[14] Zhang S, Tao F L, Zhang Z. Rice reproductive growth duration increased despite of negative impacts of climate warming across China during 1981−2009., 2014, 54: 70–83.
[15] Li Z G, Yang P, Tang H J, Wu W B, Yin H, Liu Z H, Zhang L. Response of maize phenology to climate warming in Northeast China between 1990 and 2012., 2013, 14: 39–48.
[16] Mo F, Sun M, Liu X Y, Wang J Y, Zhang X C, Ma B L, Xiong Y C. Phenological responses of spring wheat and maize to changes in crop management and rising temperatures from 1992 to 2013 across the Loess Plateau., 2016, 196: 337–347.
[17] Wang H L, Gan Y T, Wang R Y, Niu J Y, Zhao H, Yang Q G, Li G C. Phenological trends in winter wheat and spring cotton in response to climate changes in northwest China., 2008, 148: 1242–1251.
[18] Wang Z B, Chen J, Xing F F, Han Y C, Chen F, Zhang L F, Li Y B, Li C D. Response of cotton phenology to climate change on the North China Plain from 1981 to 2012., 2017, 7: 6628.
[19] Xiao D P, Zhao Y X, Bai H Z, Hu Y K, Cao J S. Impacts of climate warming and crop management on maize phenology in northern China., 2019, 11: 892–903.
[20] Fatima Z, Ur-Rehman A, Abbas G, Iqbal P, Zakir I, Khan M A, Kamal G M, Ahmed M, Ahmad S. Quantification of climate warming and crop management impacts on phenology of pulses- based cropping systems., 2020, 15: 107–123.
[21] Li K N, Yang X G, Tian H Q, Pan S F, Liu Z J, Lu S. Effects of changing climate and cultivar on the phenology and yield of winter wheat in the North China Plain., 2016, 60: 21–32.
[22] Liu Y J, Chen Q M, Ge Q S, Ge Q S, Dai J H, Qin Y, Dai L, Zou X T, Chen J. Modelling the impacts of climate change and crop management on phenological trends of spring and winter wheat in China., 2018, 248: 518–526.
[23] Hu X Y, Huang Y, Sun W J, Yu L F. Shifts in cultivar and planting date have regulated rice growth duration under climate warming in China since the early 1980s., 2017, 247: 34–41.
[24] Bai H Z, Xiao D P, Zhang H, Tao F L, Hu Y H. Impact of warming climate, sowing date, and cultivar shift on rice phenology across China during 1981–2010., 2019, 63: 1077–1089.
[25] Chen J, Liu Y J, Zhou W M, Zhang J, Pan T. Effects of climate change and crop management on changes in rice phenology in China from 1981 to 2010., 2021, 101: 6311–6319.
[26] Zhang T Y, Huang Y, Yang X G. Climate warming over the past three decades has shortened rice growth duration in China and cultivar shifts have further accelerated the process for late rice., 2013, 19: 563–570.
[27] Liu Y J, Dai L. Modelling the impacts of climate change and crop management measures on soybean phenology in China., 2020, 262: 121271.
[28] Wu D R, Wang P J, Jiang C Y, Yang J Y, Huo Z G, Yu Q. Measured phenology response of unchanged crop varieties to long- term historical climate change., 2018, 13: 47–58.
[29] Shi P, Tang L, Wang L, Sun T, Liu L, Cao W, Zhu Y. Post-heading heat stress in rice of south China during 1981–2010., 2015, 10: e0130642.
[30] Rehmani M I A, Ding C Q, Li G H, Ata-Ul-Karim S T, Hadifa A, Bashir M A, Hashem M, Alamri S, Al-Zubair F, Ding Y F. Vulnerability of rice production to temperature extremes during rice reproductive stage in Yangtze River valley, China., 2021, 33: 101599.
[31] 刘书通. 长江中下游地区水稻生产能力分析. 中国农业科学院硕士学位论文, 北京, 2014.
Liu S T. Analysis of Rice Production Capacity in the Middle and Lower Reaches of the Yangtze River. MS Thesis of Chinese Academy of Agricultural Sciences, Beijing, China, 2014 (in Chinese with English abstract).
[32] Tao F L, Zhang Z, Shi W J, Liu Y J, Xiao D P, Zhang S, Zhu Z, Wang M, Liu F S. Single rice growth period was prolonged by cultivars shifts, but yield was damaged by climate change during 1981–2009 in China, and late rice was just opposite., 2013, 19: 3200–3209.
[33] Jiang Y L, Yin X G, Wang X H, Zhang L, Lu Z, Lei Y D, Chu Q Q, Chen F. Impacts of global warming on the cropping systems of China under technical improvements from 1961 to 2016., 2021, 113: 187–199.
[34] 陈风波, 马志雄, 陈培勇. 农户水稻种植模式选择现状及其影响因素分析: 对长江中下游地区四个省的调查. 农业经济与管理, 2011, (3): 62–73.
Chen F B, Ma Z X, Chen P Y. Selecting status of farmers’ rice cropping patterns and its impact factor analysis: four provinces survey along the Yangtze River., 2011, (3): 62–73 (in Chinese with English abstract).
[35] 王旭, 张天山, 刘懂伟, 王晓亮, 李辉. 长江中下游水稻种植影响因素及变化分析. 现代农业科技, 2016, (6): 54–55.
Wang X, Zhang T S, Liu D W, Wang X L, Li H. Analysis of factors influencing rice cultivation and changes in the middle and lower reaches of the Yangtze River., 2016, (6): 54–55 (in Chinese with English abstract).
[36] Lobell D B, Burke M B. On the use of statistical models to predict crop yield responses to climate change., 2010, 150: 1443–1452.
[37] Zhang S, Tao F L, Zhang Z. Changes in extreme temperatures and their impacts on rice yields in southern China from 1981 to 2009., 2016, 189: 43–50.
[38] Liu Y J, Zhou W M, Ge Q S. Spatiotemporal changes of rice phenology in China under climate change from 1981 to 2010., 2019, 157: 261–277.
[39] Zhang Y, Zhao Y X, Sun Q. Increasing maize yields in Northeast China are more closely associated with changes in crop timing than with climate warming., 2021, 16: 054052.
[40] Zhu P, Jin Z N, Zhuang Q L, Ciais P, Bernacchi C, Wang X H, Makowski D, Lobell D. The important but weakening maize yield benefit of grain filling prolongation in the US Midwest., 2018, 24: 4718–4730.
[41] Guo E L, Zhang J Q, Wang Y F, Alu S, Wang R, Li D J, Ha S. Assessing non-linear variation of temperature and precipitation for different growth periods of maize and their impacts on phenology in the midwest of Jilin province, China., 2017, 132: 685–699.
[42] Tao F L, Zhang S L, Zhang Z, Rötter R P. Maize growing duration was prolonged across China in the past three decades under the combined effects of temperature, agronomic management, and cultivar shift., 2014, 20: 3686–3699.
[43] Sun X S, Long Z W, Song G P, Chen C Q. High-temperature episodes with spatial-temporal variation impacted middle-season rice yield in China., 2018, 110: 961−969.
[44] Zhang L, Yang B Y, Li S, Hou Y Y, Huang D P. Potential rice exposure to heat stress along the Yangtze River in China under RCP8.5 scenario., 2018, 248: 185–196.
[45] Meng L, Wang C Y, Zhang J Q. Heat injury risk assessment for single-cropping rice in the middle and lower reaches of the Yangtze River under climate change., 2016, 30: 426–443.
[46] Wang Y L, Wang L, Zhou J X, Hu S B, Chen H Z, Xiang J, Zhang Y K, Zeng Y J, Shi Q H, Zhu D F, Zhang Y P. Research progress on heat stress of rice at flowering stage., 2019, 26: 1–10.
[47] 张倩, 赵艳霞, 王春乙. 长江中下游地区高温热害对水稻的影响. 灾害学, 2011, 26(4): 58–62.
Zhang Q, Zhao Y X, Wang C Y. Study on the impact of high temperature damage to rice in the lower and middle reaches of the Yangtze River., 2011, 26(4): 58–62. (in Chinese with English abstract).
[48] Sanchez B, Rasmussen A, Porter J R. Temperatures and the growth and development of maize and rice: a review., 2014, 20: 408–417.
[49] Wu C, Cui K H, Li Q, Li L Y, Wang W C, Hu Q Q, Ding Y F, Li G H, Fahad S, Huang J L, Nie L X, Peng S B. Estimating the yield stability of heat-tolerant rice genotypes under various heat conditions across reproductive stages: a 5-year case study., 2021, 11: 13604.
[50] 邓南燕. 中国水稻产量差评估及长江中下游地区增产途径探究.华中农业大学博士学位论文, 湖北武汉, 2018.
Deng N Y. Estimation of Rice Yield Gaps in China and Exploration of Approaches to Improve Yield in Middle and Lower Reaches of Yangtze River Valley. PhD Dissertation of Huazhong Agricultural University, Wuhan, Hubei, China, 2018 (in Chinese with English abstract).
[51] 王文婷. 沿江地区温度要素对优质粳稻产量与品质的影响研究. 扬州大学博士学位论文, 江苏扬州, 2021.
Wang W T. Study on the Effect of Temperature-Light Factors on the Formation of Quality and Yield ofRice along the Yangtze River. PhD Dissertation of Yangzhou University, Yangzhou, Jiangsu, China, 2021 (in Chinese with English abstract).
[52] Xu C C, Wu W X, Ge Q S, Zhou Y, Lin Y M, Li Y M. Simulating climate change impacts and potential adaptations on rice yields in the Sichuan Basin, China., 2015, 22: 565–594.
[53] Muleke A, Harrison M, de Voil P, Hunt L, Liu K, Yanotti M, Eisner R. Earlier crop flowering caused by global warming alleviated by irrigation., 2022, 17: 044032.
[54] Liu Q H, Wu X, Ma J Q, Li T, Zhou X B, Guo T. Effects of high air temperature on rice grain quality and yeld under field condition., 2013, 105: 446.
[55] Tang S, Zhang H X, Li L L, Liu X, Chen L, Chen W Z, Ding Y F. Exogenous spermidine enhances the photosynthetic and antioxidant capacity of rice under heat stress during early grain-filling period., 2018, 45: 911–921.
Response of reproductive growth period length to climate warming and technological progress in the middle and lower reaches of the Yangtze River during 1981–2010 in single-cropping rice
LIU Er-Hua1,2,3, ZHOU Guang-Sheng1,2,3,4,*, WU Bing-Yi2, SONG Yan-Ling1,3, HE Qi-Jin4, LYU Xiao-Min1,3, and ZHOU Meng-Zi1,3
1State Key Laboratory of Severe Weather, Chinese Academy of Meteorological Sciences, Beijing 100081, China;2Institute of Atmospheric Sciences, Fudan University, Shanghai 200439, China;3Joint Eco-Meteorological Laboratory of Chinese Academy of Meteorological Sciences and Zhengzhou University, Zhengzhou 450001, Henan, China;4College of Resources and Environmental Sciences, China Agricultural University, Beijing 100193, China
Crop growth period length is closely linked to climate change and technological progress. Even though the extensive researches conducting on crop growth period length variation and its response to climate change, particularly temperature change, the response of reproductive growth periods lengths (RGLs) to climate change and technological progress remains unclear. Based on the reproductive growth periods and meteorological data of single-cropping rice in the middle and lower reaches of the Yangtze River (MLYR) during 1981−2010, the trends of the RGLs (including booting to heading (BDHD), heading to milking (HDMS), milking to maturity (MSMD), and booting to maturity (BDMD)) and climatic variations were analyzed. In addition, to explore the confounding effects of climate change and technological progress on the RGLs, the sensitivities of the RGLs to mean temperature (TEM), cumulative precipitation (PRE), and cumulative sunshine duration (SSD) were measured. The results showed that the BDMD had an extension trend (0.24 d a–1), among which the extension trend in the HDMS (0.16 d a–1) was the most obvious in RGLs, while the extension trends of BDHD (0.03 d a–1) and MSMD (0.05 d a–1) were not significant. High temperature and low sunshine duration were unfavorable to the extension of the RGLs. The mean relative contributions of TEM to the BDHD, HDMS, and MSMD were –50.0%, –50.7%, and –21.9%, which were –47.2%, –48.7%, and –67.6% in terms of SSD, respectively. Technological progress compensated for the adverse impacts of climate change on the trends of different RGLs. These results suggested that cultivar selection and agronomic management were the effective adaptation strategies benefiting for the stable and high yield of single-cropping rice. Single-cropping rice cultivar with longer RGLs and heat-tolerant may be suitable to cope with the continuous climate change in the future.
single-cropping rice; climate change; reproductive growth period lengths; technological progress
10.3724/SP.J.1006.2023.22026
本研究由国家重点研究计划项目(2018YFA0606103), 国家自然科学基金重点项目(42130514, 4213000565)和中国气象科学研究院基本科研业务费专项(2020Z004)资助。
This study is supported by the National Key Research and Development Program of China (2018YFA0606103), the National Natural Science Foundation of China (42130514, 4213000565), and the Basic Research Fund of Chinese Academy of Meteorological Sciences (2020Z004).
周广胜, E-mail: zhougs@cma.gov.cn
E-mail: leh4179@163.com
2022-04-30;
2022-10-10;
2022-10-31.
URL: https://kns.cnki.net/kcms/detail/11.1809.S.20221028.1445.002.html
This is an open access article under the CC BY-NC-ND license (http://creativecommons.org/licenses/by-nc-nd/4.0/).
猜你喜欢
内蒙古民族大学学报(自然科学版)(2021年4期)2021-09-02
中国种业(2021年2期)2021-03-01
中国奶牛(2019年1期)2019-02-15
成都信息工程大学学报(2017年3期)2017-11-09
成都信息工程大学学报(2017年2期)2017-11-09
现代农业科技(2016年20期)2016-12-20
西藏大学学报(自然科学版)(2015年1期)2015-12-25
安徽农学通报(2015年2期)2015-02-12
现代农机(2014年1期)2014-03-03
山东农业大学学报(自然科学版)(2012年1期)2012-07-16
