不同基因型小麦冻害无人机遥感高通量表型
2023-05-15 07:53刘易雪吴建辉韩德俊苏宝峰
农业工程学报 2023年5期
刘易雪,蔚 睿,吴建辉,韩德俊,苏宝峰
·农业信息与电气技术·
不同基因型小麦冻害无人机遥感高通量表型
刘易雪1,2,3,蔚 睿4,5,吴建辉4,5,韩德俊4,5,苏宝峰1,2,3※
(1. 西北农林科技大学机械与电子工程学院,杨凌 712100;2. 农业农村部农业物联网重点实验室,杨凌 712100; 3. 陕西省农业信息感知与智能服务重点实验室;4. 西北农林科技大学农学院,杨凌 712100; 5. 西北农林科技大学旱区作物逆境生物学国家重点实验室,杨凌 712100)
为了实现田间条件下小麦抗冻性状相关的数量性状基因座(quantitative trait locus, QTL)分析,该研究针对4个试验地491份小麦核心种质资源的抗冻性状,基于无人机多光谱遥感提出了一种高通量表型方法。首先通过光谱植被指数对小麦抗冻性状进行评估,基于机器学习分类算法使用16个光谱植被指数特征构建了小麦冻害评价模型,并完成了光谱特征相关性分析及对评价模型的贡献率分析。对比随机森林(random forests,RF)、分布式梯度增强(extreme gradient boosting,XGBoost)、梯度提升决策树(gradient boosting decision tree,GBDT)及支持向量机(support vector machine,SVM)算法建立的小麦冻害等级评价模型,结果表明,使用XGBoost建立的评价模型准确率最高,达67.94%;16个光谱特征相关性及其对评价模型的贡献率分析表明,简化冠层叶绿素含量指数(simplified canopy chlorophyii content index, SCCCI)对小麦抗冻表型鉴定的贡献率最大。其次,使用SCCCI作为小麦抗冻表型,结合通过全基因组关联分析检测小麦抗冻相关QTL,检测到3个已被证明与抗冻性状相关的QTL,证明了基于无人机获取的光谱特征可以作为小麦抗冻表型定性定量分析指标,可提供小麦抗冻性状遗传解析必需的表型信息。小麦冻害的无人机遥感高通量表型方法的提出促进了小麦抗冻基因功能解锁。
无人机;遥感;小麦冻害;多光谱;关联分析;机器学习
0 引 言
小麦高通量表型方法的研究对加速育种进程有重要意义,但小麦育种技术面临着周期长、效率低、遗传背景狭窄等境况[1-3]。育种水平的提高是作物产能提高的突破口,小麦的表型分析是挖掘性状相关基因功能的必要环节[4]。作物的田间表型不仅是对育种前期的种质筛选的指导数据,同时也是在后期推广种植中的评估数据[5-6]。快速、准确、实时地获取大田环境下小麦育种群体的表型,并将表型参数与基因型、环境因子进行关联性分析,分析小麦田间表型与基因型的关系是加速育种进程的重要突破口。
低温胁迫是小麦在越冬期遇到的最大生存阻力,小麦能否成功越冬主要受抗冻性基因调控[7-9]。小麦抗冻性相关基因位点的定位工作依赖于小麦田间受低温胁迫后冻害表型分析,过去主要由育种专家长期的田间调查完成[10-12],数百种基因型数据的田间调查工作需要几天的时间才能完成,并且表型数据会受到变化的环境条件(风,太阳角,温度,湿度)以及昼夜节律的影响[13],存在效率低且数据质量难以保证的问题[5,14-17]。田间表型平台可以代替人工调查,提高效率[11]。尽管目前已有表型平台投入到实际应用中,仍无法保证数据质量。例如,ANDRADE-SANCHEZ等[12]的研究发现,在5 h的过程中经过干旱胁迫的棉花的归一化差异植被指数(normalized difference vegetation index, NDVI)下降了21%,而未经处理的棉花也下降7%。
尽管许多研究表明基于遥感的作物田间高通量表型方法可以为解决效率不足、质量难以保证的问题提供方案[18-22],但大部分研究仍停留在表型分析阶段,如何结合遗传学全基因组关系分析方法处理表型分析结果仍是分析植物表型与基因型的关系追踪遗传变异的瓶颈。
从2020年以来,已有研究开始尝试结合基于遥感的植物高通量表型方法和全基因组关联分析(genome-wide association study, GWAS)方法挖掘单核苷酸多态性标记(single nucleotide polymorphism, SNP)[23-25]。例如,SANTINI等[26]基于无人机遥感开发了一种半自动的地中海白松冠层分割方法,并利用分割结果进行GWAS找到了相关基因组区域。COUPEL-LEDRU等[27]基于近地遥感获取苹果的冠层结构相关参数,基于GWAS筛选相关基因组区域找到了参与每个性状相关途径的候选基因。针对基于无人机遥感的小麦SNP挖掘,HASSAN等[24]基于无人机遥感获取田间小麦株高,验证了以往通过人工测量方式获取到的表型鉴定到的相关基因组区域;CHEN等[9]基于无人机遥感观察冬小麦的越冬能力并根据视觉算法结果基于GWAS找到了相关基因组区域。虽然这些研究验证了无人机遥感可以替代人工田间调查,证明了基于无人机遥感的田间高通量表型方法服务全基因组关联分析的可能性,但由于表型特征信息不足,导致在基因功能挖掘结果方面没有突破进展。而JIANG等[28]基于无人机遥感影像构建水稻抗旱指数等3种动态性状,通过全基因组关联分析检测到111个与干旱胁迫显著相关位点,其中30.6%在之前研究未检测到。这表明了结合无人机遥感以及机器学习算法在表型特征上的创新为突破目前植物基因功能解锁贡献了主要动力。然而,这部分工作在小麦抗冻性的基因功能挖掘方面还留有空白,如何分析并解释表型特征与基因型的关系,以挖掘更多性状相关功能位点仍然是目前亟待解决的问题。
针对上述问题,本文提出一种基于无人机遥感的小麦抗冻高通量表型方法,以自然条件下受到低温胁迫的小麦为研究对象,结合遥感技术、计算机视觉算法以及机器学习提出田间高通量小麦冻害等级评价方法,使用GWAS处理表型分析结果检测与小麦抗冻性相关QTL(quantitative trait locus),拟为分析小麦抗冻性的关键遗传因素提供参考。
1 材料和方法
1.1 试验材料和试验区概况
小麦群体试验材料包括农家种、主栽品种、新品系、核心种质以及国外品种等,共491种不同基因型的小麦品种。试验材料种植于4个不同的试验地,分别为河南省洛阳市农科院试验地(112°28.428′E,34°38.352′N),陕西省咸阳市杨陵区曹新庄试验农场(108°5.641′E,34°18.267′N),河南省南阳市农科院试验地(112°24.960′E,32°54.582′N)以及江苏省宿迁市瑞华农业科技有限公司试验地(118°22.650′E,34°2.040′N)。
育种试验设计采取随机增广设计[29],每个试验地有560个小区,包括16个区组,每个区组内随机分布5个不同的对照品种[30](周麦18、百农207、济麦22号、偃展4110、西农511),其余小区为试验品种。4个试验地皆处于黄淮冬麦区,气象数据由田间微型气象站获取,气候环境如表1所示。

表1 试验地气候环境对比
1.2 数据采集
1.2.1 无人机遥感影像
无人机遥感影像采集系统由Matrice 100(深圳DJI)和Micasence Rededge Camera(美国西雅图MicaSense Inc.)组成。Matrice 100搭载MicaSence Rededge相机用于快速获取小麦冠层的多光谱图像。MicaSence Rededge多光谱相机分辨率为1 280×960像素,包括蓝光(Blue)、绿光(Green)、红光(Red)、红边(Red edge)和近红外(NIR)5个波段,它们的中心波长分别为475、560、668、717和840 nm,其带宽分别为20、20、10、10和40 nm。
在小麦越冬期(播种后90 d左右),在晴天10:00至12:00进行小麦冠层的无人机多光谱图像采集,飞行高度为15 m,飞行路径覆盖整个试验区,同时将飞行路径纵向重叠率设置为80%,横向重叠率设置为75%。每次飞行任务执行前后,使用Micasence校正白板获取参照图像用于反射率校准(校正参数Blue为0.57,Green为0.58,Red为0.58,Red edge为0.58,NIR为0.53)。
1.2.2 人工田间调查
依据气象情况,在2019年1月15日,中国北方地区大面积遭受一次寒流,于2019年1月19日到1月22日分别前往4个试验地进行田间调查并记录小麦受低温胁迫后冻害发生的具体情况。人工调查时间平均为2 d,每个试验地的调查间隔最长不超过2 d。在无人机采集小麦冠层多光谱图像数据的同一时间,参照中华人民共和国农业行业标准《NY/T 1301-2007》对4个试验地鉴定小麦受低温的胁迫情况,并将小麦受冻害情况分为5个等级,分级标准如表2所示。

表2 小麦冻害等级分级标准
1.2.3 SNP获取
采用Affymetrix公司开发的小麦660 K SNP芯片对491份品种材料进行基因型检测,分型工作主要由博奥晶典生物技术有限公司(北京,http://www.capitalbiotech.com)完成。基于贝叶斯系统发育法对种群结构进行聚类分析,计算微等位基因频率(micro allele frequency, MAF)、遗传多样性和多态性信息含量(polymorphism information content, PIC)。为保证基因分型数据的准确性,利用R语言包对标记进行质量控制,过滤缺失率大于20%的标记、显著偏分离的标记以及微等位基因频率低于0.05%的标记[31]。
1.3 研究方法
本研究技术路线主要包括3个阶段:1)无人机多光谱图像数据预处理,为了提取每个小麦品种对应的种植小区的冠层光谱特征,首先对无人机多光谱图像进行预处理生成光谱植被地图,然后对单个小区冠层进行聚类分析实现冠层分割;2)群体小麦冻害表型鉴定与分析,为了实现基于冠层光谱特征的小麦抗冻性评价分析,首先基于机器学习分类算法完成了小麦冻害评价模型,并对比不同算法的分类性能,然后分析基于无人机遥感的田间小麦高通量表型获取的特征重要性;3)表型与基因型关系分析,为了实现小麦抗冻性相关QTL,包括了使用获取的表型信息结合试验材料的基因型信息,通过全基因组关联分析定位与小麦抗冻性相关位点。具体技术路线图如图1所示。

图1 技术路线图
1.3.1 单个品种冠层植被指数特征提取
使用Pix4D Mapper软件处理无人机多光谱图像,经几何校正、辐射校正、图像拼接及指数计算后,生成杨凌、洛阳、南阳和宿迁4个试验地对应的光谱植被指数地图。
低温胁迫对小麦生长的影响主要体现在含水量、光合作用以及渗透物质含量等方面。小麦受到低温胁迫后,主要表现为叶尖发黄、光合作用停滞、叶片枯死、分蘖冻死[32],推测冠层植被覆盖度或反应叶绿素水平的光谱特征可能与小麦受低温胁迫后的表型相关。因此,小麦抗冻性鉴定模型的输入特征包括5个波段(Blue、Green、Red、Red edge及NIR)和由这5个波段计算得出的与冠层覆盖度、叶绿素相关的16个植被指数[33-46](表2)。

表2 光谱特征及其计算式
注:R、R、R、R、R分别代表了Blue、Green、Red、Red edge、NIR正射影像的灰度值。
Note:R,R,R,R,Rrepresent the gray value of blue, green, red, red edge and NIR orthophoto respectively.
1.3.2 冠层光谱特征与低温胁迫的相关性分析
本研究获取到表型数据包括人工田间调查的小麦受到低温胁迫后的冻害等级结果以及基于无人机遥感获取的16个光谱特征结果。首先,基于机器学习分类算法证明基于无人机遥感的小麦冻害表型鉴定方法可以代替人工田间调查法,并分析光谱特征对小麦冻害等级鉴定的贡献。
整合4个试验地491种不同基因型的小麦品种的16个植被指数特征构建数据集,一共包括1 964个样本,每个样本有16个输入特征,同时以人工田间调查结果为参照作为实际标签。随机抽取数据集的20%作为测试集,剩余的数据作为训练集,测试集不参与分类器训练。
本文使用随机森林[47](random forests,RF)、分布式梯度增强[48](extreme gradient boosting,XGBoost)、梯度提升决策树[49](gradient boosting decision tree,GBDT)及支持向量机[50](support vector machine,SVM)分类算法进行训练。XGBoost是在Boosting框架下的前向迭代模型,训练弱学习器的同时引入列采样和学习率,使用节点递归分裂的贪心准则来实现树的生成,同时使用稀疏感知策略来应对缺失值。XGBoost通过融合随机森林算法中列采样,对每次节点分裂前进行随机采样提升抗噪能力,同时在树模型的参数化过程中加入了正则项控制模型的复杂度防止过拟合[47-49]。设置RF分类器的弱学习器的最大迭代次数为10,子结点上的最小样本数量为2;设置XGBoost分类器学习率为0.1以二分类逻辑回归为目标函数训练分类器;设置GBDT分类器学习率为0.1,每棵子树的深度为2,子结点上的最小样本数量为2;设置SVM分类器的核函数为径向基函数。使用Python3.8.8在配备 Intel i7-9700 3.00 GHz CPU、16 GB 内存和 Nvidia GeForce GTX 3090 显卡、运行 Win10 操作系统的工作站上实现小麦冻害评价模型的建立。
以混淆矩阵评估4种分类器的预测性能。首先计算每一个类别对应的召回率、精确度,同时考虑到数据集类间不平衡,使用准确率、Weight-F1分数(F1)、Micro-F1(F1)分数评价小麦受低温胁迫严重度分类模型的精度[51-52],计算式如下:


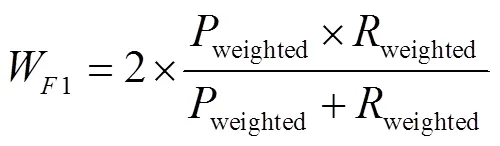

式中T表示预测值和标签真值均为真;F表示标签真值为真,预测值为假;F表示标签真值为假,预测值为真;T表示标签真值为假,预测值为假为准确率,%,为精确度,为召回率,为类别数目权重,为类别数目。


1.3.3 全基因组关联分析
利用GEMMA软件采取合适的模型进行全基因组关联分析,值的阈值基于有效标记的数量(=1/N,N为有效SNP标记数量)。显著性关联标记通过软件R 3.0.3绘制的曼哈顿图(Manhattan plot)来挖掘,通过GCTA软件进行显著性关联标记对表型贡献率的评估。使用分位数图对关联分析结果进行可视化。
2 结果与分析
2.1 冠层光谱特征与低温胁迫的相关性
2.1.1 分类算法对比结果与分析
以准确率、Weight-F1分数作为评价标准,评估4种分类器在测试集上的预测结果,如表3所示。相比于经典的机器学习分类算法SVM,XGBoost的预测性能更好。测试结果表明,XGBoost的准确率比SVM高5.47个百分点。基于GBDT的机器学习方法是目前分析预测问题的高效方法,RF通过集成多棵决策树实现分类,而GBDT也是基于提升树实现分类,同样基于提升树的XGBoost相比于RF的准确率高出3.16个百分点,比GBDT高出1.87个百分点。
由分类器SVM、RF、XGBoost及GBDT在测试集上的预测结果与实际标签生成的混淆矩阵[53](图2)来看,数据集中一级和二级的数量远远超过其他3个类别的数量之和,不平衡的类别数量为分类器的训练带来了负面影响,对比表3中的Weight-F1分数和Micro-F1分数结果,使用Micro-F1分数评估分类器的预测性能时,可能会受到数量较多的类别的结果的影响,而Weight-F1是根据类别数目所占权重来计算的,因此虽然Micro-F1分数结果要比Weight-F1分数的结果好,但Weight-F1的结果更接近实际情况。
由表3可知,XGBoost分类器的分类性能优于SVM、RF及GBDT,准确率达67.94%,各个冻害等级的F1分数均超过了0.5(表4),这个试验结果表明使用无人机多光谱图像基于XGBoost建立的小麦冻害评价模型能够替代人工田间调查作为田间高通量表型获取方法。在本研究中,对于任一个试验地,专家田间调查560个种植小区,评估小麦冠层受低温胁迫情况,并鉴定冻害等级,至少需要8 h以上,然而,无人机执行一次飞行任务仅需要15 min,结合本文所提全自动的表型分析方法分析,研究基于无人机遥感的小麦田间高通量表型方法将为育种技术的发展提供一大助力。

表3 不同分类器预测性能
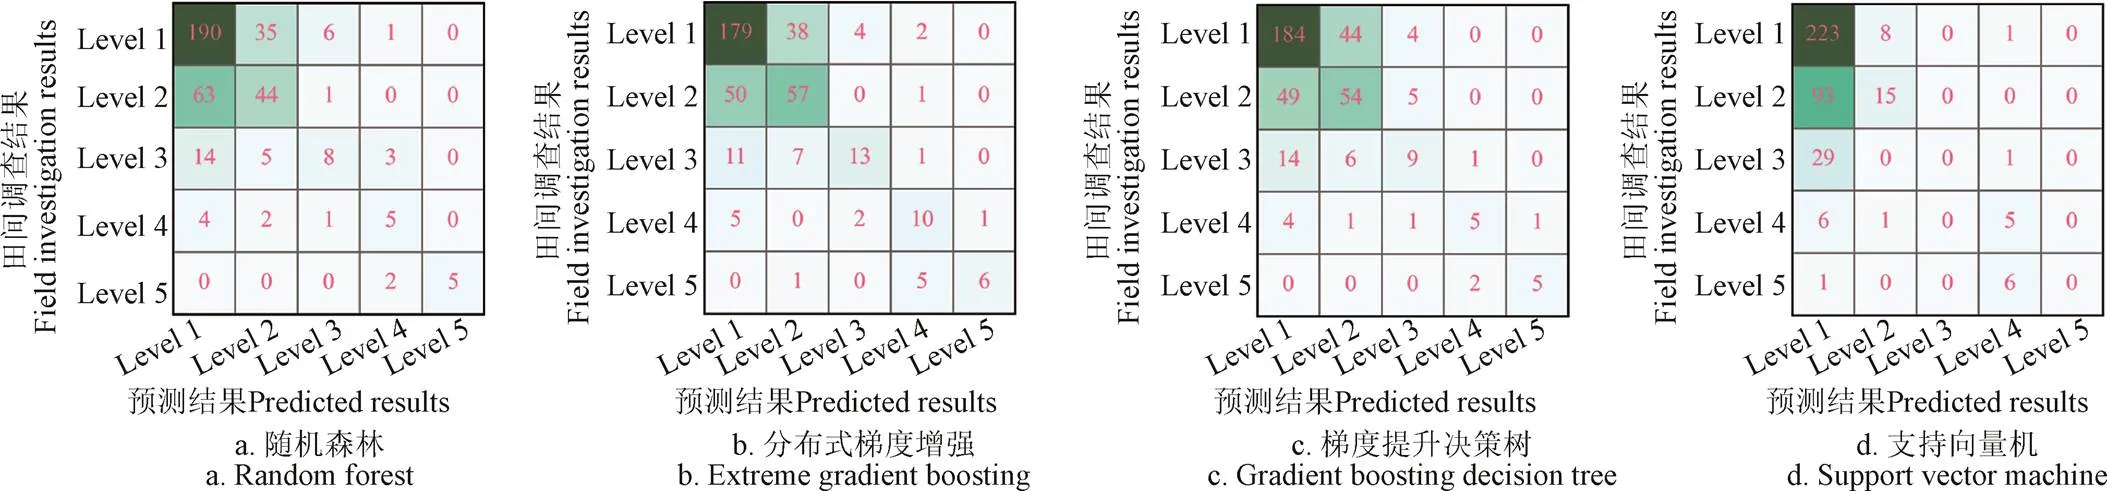
图2 不同分类器在测试集上的预测结果与实际标签的混淆矩阵

表4 基于XGBoost不同冻害等级分类结果评估
2.1.2 光谱特征重要性分析
用XGBoost函数库中对每个子节点分裂时16个特征带来的信息增益进行统计,将其作为排序索引后,得到了小麦冠层的16个光谱特征对小麦冻害鉴定的贡献率排序(图3)。

图3 小麦冠层16个光谱特征对冻害鉴定的贡献率排序
不含抗冻基因的小麦品种在受到低温胁迫后,随着冻害程度的加重,叶片含水量、叶绿素a、光系统Ⅱ最大光化学量子产量均显著下降[54],小麦的光合作用受到严重影响,光合作用相关参数发生变化,同时,硬化组织的酶、蛋白也会发生变化[55]。而SCCCI常用于反演植物叶绿素[41-42,45],相比于图3中其他与植被覆盖度相关的植被指数更符合如小麦受低温胁迫后光合作用停滞叶绿素含量降低的生理生化反应。
2.2 全基因组关联分析
通过全基因组关联分析发现在小麦的21条染色体上,共有3个位点出现了超出阈值(﹣lg=4)且连续分布的显著SNP,分别位于位点2B、3A与5A(图4a)。从图4b中看出,当- lg<4时,值的分布和均匀分布的结果集中在一条直线上,表示确定与抗冻表型性状不关联的位点,这些位点的值观测值与期望值一致;当-lg>4时,值的分布和均匀分布的结果出现快速分离的情况,特别是值越低的时候分离程度就越高,说明这些位点的效应超过了随机效应,位点2B、3A与5A是潜在与抗冻表型性状相关的候选位点。对2B短臂上显著SNP注释发现他们位于编码一个Cor14b蛋白的基因上,该蛋白已被证明在大麦和二倍体小麦中参与对逆境胁迫的响应[56];同样在5A长臂的位点与前人定位研究的Fr1与Fr2重合,Fr1与Fr2是两个重要的抗冻(frost tolerance, FroT)位点,即抗冻1(FR-A1)和抗冻2(FR-A2),拥有Fr1与Fr2的小麦具有耐冻性和冬季抗冻性,其中Fr1与VRN-A1基因紧密相连,他们共同作用参与到小麦耐冻调控的通路上[57-58]。3AL上的位点很可能与近期挖掘的一个小麦抗冻QTL一致[59]。
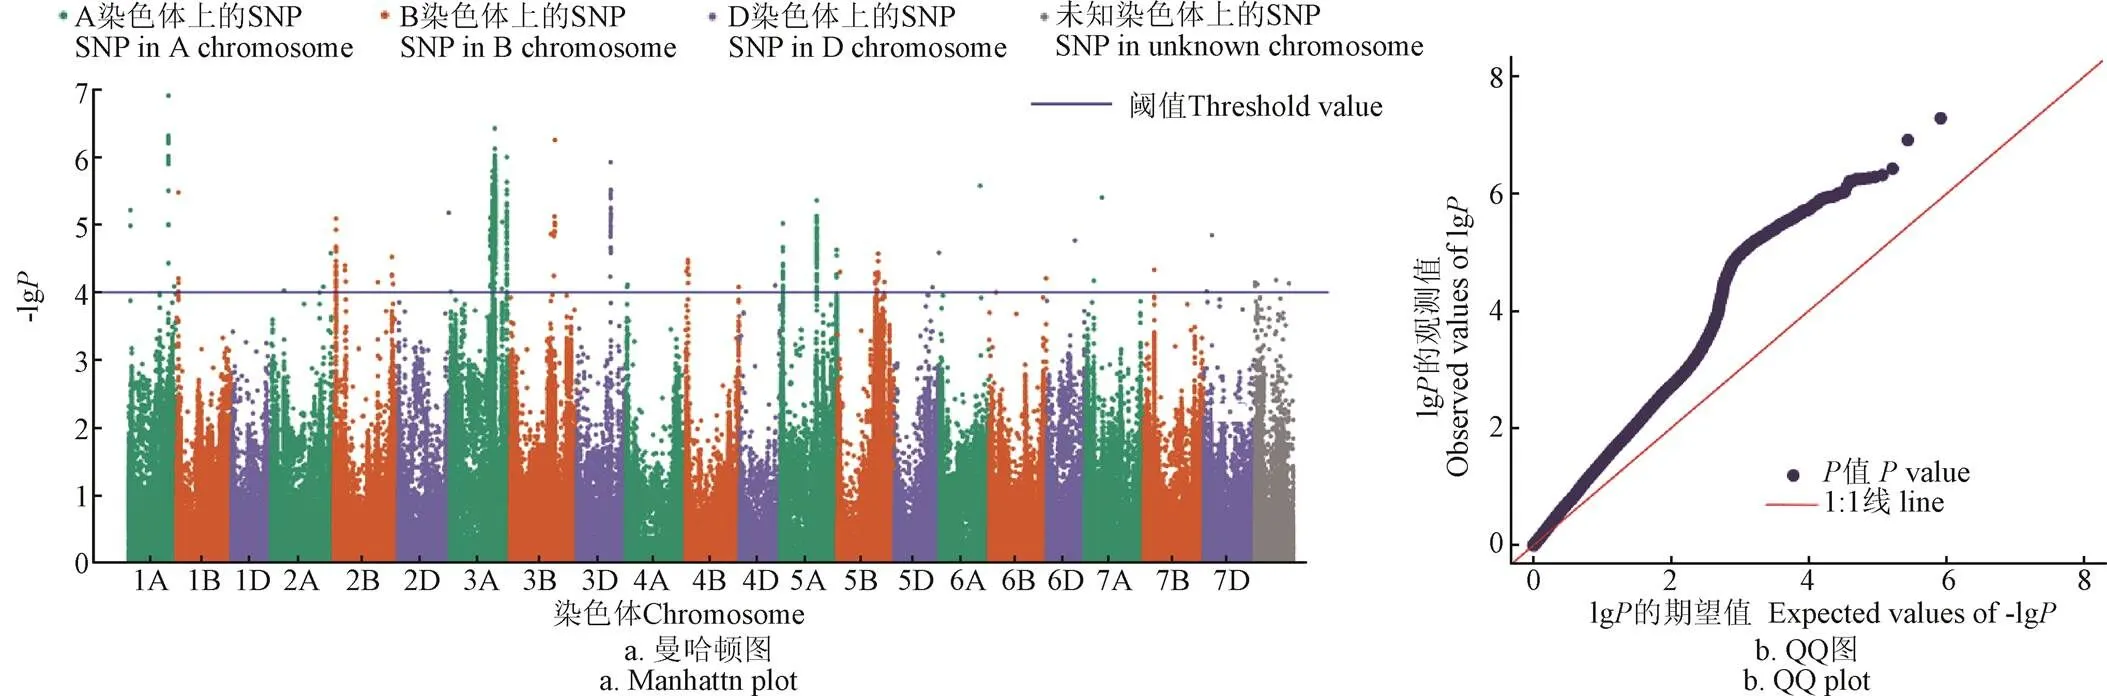
图4 SCCCI的曼哈顿图与QQ Plot图
上述结果表明,结合基于无人机遥感的田间小麦高通量表型方法获取的表型数据与基因型进行全基因组关联分析,QTL结果和前人的研究结果实现了一致,证明光谱植被指数可以很好地定性且定量小麦的受冻情况,可作为小麦抗冻种质资源筛选与抗冻遗传解析的表型评定指标。
3 结 论
1)本文对4个试验地的491份小麦种质材料进行了人工田间调查,同时获取4个试验地的无人机多光谱遥感影像并生成16个光谱植被指数特征,对比分析了XGBoost、GBDT、RF及SVM 4种方法建立的小麦冻害评价模型,结果表明,使用XGBoost建立的评价模型准确率最高,可达67.94%。同时,并以信息增益作为评估标准评估了16个不同光谱特征对评价模型分类性能的影响,结果表明简化冠层叶绿素含量指数(simplified canopy chlorophyii content index, SCCCI)是对小麦冻害鉴定贡献最大的特征。
2)基于无人机遥感的小麦抗冻表型方法可用于抗冻性状相关的遗传解析。使用GWAS对小麦挖掘抗冻基因SNP,检测结果表明,位于2B、3A与5A的3个位点出现了超出阈值且连续分布的显著SNP,证明基于无人机获取的光谱植被指数可以很好地定性且定量小麦受冻害情况,可作为小麦抗冻种质资源筛选与抗冻遗传解析的表型评定指标。
[1] 邹华文,王道杰,边秀秀,等. 近15年国家自然科学基金稻、麦类作物遗传育种领域项目申请情况分析[J]. 作物学报,2015,41(5):820-828.
ZOU Huawen, WANG Daojie, BIAN Xiuxiu, et al. Analysis of NSFC program applications in rice and wheat crops genetics and breeding fields in recent 15 years[J]. Acta Agronomica Sinica, 2015, 41(5): 820-828. (in Chinese with English abstract)
[2] 翟俊鹏,李海霞,毕惠惠,等. 普通小麦主要农艺性状的全基因组关联分析[J]. 作物学报,2019,45(10):1488-1502.
ZHAI Junpeng, LI Haixia, BI Huihui, et al. Genome-wide association study for main agronomic traits in common wheat[J]. Acta Agronomica Sinica, 2019, 45(10): 1488-1502. (in Chinese with English abstract)
[3] 胡文静,李东升,裔新,等. 小麦穗部性状和株高的QTL定位及育种标记开发和验证[J]. 作物学报,2022,48(6):1346-1356.
HU Wenjing, LI Dongsheng, YI Xin, et al. Molecular mapping and validation of quantitative trait loci for spike-related traits and plant height in wheat[J]. Acta Agronomica Sinica, 2022, 48(6): 1346-1356. (in Chinese with English abstract)
[4] FURBANK R T, TESTER M. Phenomics-technologies to relieve the phenotyping bottleneck[J]. Trends in Plant Science, 2011, 16(12): 635-644.
[5] 刘建刚,赵春江,杨贵军,等. 无人机遥感解析田间作物表型信息研究进展[J]. 农业工程学报,2016,32(24):98-106.
LIU Jiangang, ZHAO Chunjiang, YANG Guijun, et al. Review of field-based phenotyping by unmanned aerial vehicle remote sensing platform[J]. Transactions of the Chinese Society of Agricultural Engineering (Transactions of the CSAE), 2016, 32(24): 98-106. (in Chinese with English abstract)
[6] ARAUS J L, KEFAUVER S C, ZAMAN-ALLAH M, et al. Translating high-throughput phenotyping into genetic gain[J]. Trends In Plant Science, 2018, 23(5): 451-466.
[7] 孟繁圆,冯利平,张丰瑶,等. 北部冬麦区冬小麦越冬冻害时空变化特征[J]. 作物学报,2019,45(10):1576-1585.
MENG Fanyuan, FENG Liping, ZHANG Fengyao, et al. Temporal and spatial variations of winter wheat freezing injury in northern winter wheat region[J]. Acta Agronomica Sinica, 2019, 45(10): 1576-1585. (in Chinese with English abstract)
[8] 王慧芳,顾晓鹤,董莹莹,等. 冬小麦冻害灾情及长势恢复的变化向量分析[J]. 农业工程学报,2011,27(11):145-150.
WANG Huifang, GU Xiaohe, DONG Yingying, et al. Monitoring freeze injury and growth recovery of winter wheat based on change vector analysis[J]. Transactions of the Chinese Society of Agricultural Engineering (Transactions of the CSAE), 2011, 27(11): 145-150. (in Chinese with English abstract)
[9] CHEN Y, SIDHU H S, KAVIANI M, et al. Application of image-based phenotyping tools to identify QTL for in-field winter survival of winter wheat (L.)[J]. Theoretical and Applied Genetics, 2019, 132(9): 2591-2604.
[10] ARAUS J L, CAIRNS J E. Field high-throughput phenotyping: The new crop breeding frontier[J]. Trends in Plant Science, 2014, 19(1): 52-61.
[11] BAO Y, TANG L, BREITZMAN M W, et al. Field‐based robotic phenotyping of sorghum plant architecture using stereo vision[J]. Journal of Field Robotics, 2019, 36(2): 397-415.
[12] ANDRADE-SANCHEZ P, GORE M A, HEUN J T, et al. Development and evaluation of a field-based high-throughput phenotyping platform[J]. Functional Plant Biology, 2013, 41(1): 68-79.
[13] FELDERHOFF T J, MURRAY S C, KLEIN P E, et al. QTLs for energy‐related traits in a sweet× grain sorghum [(L.) Moench] mapping population[J]. Crop Science, 2012, 52(5): 2040-2049.
[14] 李继宇,胡潇丹,兰玉彬,等. 基于文献计量学的2001-2020全球农用无人机研究进展[J]. 农业工程学报,2021,37(9):328-339.
LI Jiyu, HU Xiaodan, LAN Yubin, et al. Research advance on worldwide agricultural UAVs in 2001-2020 based on bibliometrics[J]. Transactions of the Chinese Society of Agricultural Engineering (Transactions of the CSAE), 2021, 37(9): 328-339. (in Chinese with English abstract)
[15] 刘忠,万炜,黄晋宇,等. 基于无人机遥感的农作物长势关键参数反演研究进展[J]. 农业工程学报,2018,34(24):60-71.
LIU Zhong, WAN Wei, HUANG Jinyu, et al. Progress on key parameters inversion of crop growth based on unmanned aerial vehicle remote sensing[J]. Transactions of the Chinese Society of Agricultural Engineering (Transactions of the CSAE), 2018, 34(24): 60-71. (in Chinese with English abstract)
[16] 刘轲,黄平,任国业,等.基于冠层反射率模型的作物参数多阶段反演方法研究进展[J]. 农业工程学报,2017,33(1):190-198.
LIU Ke, HUANG Ping, REN Guoye, et al. Review on multi-stage inversion techniques of canopy reflectance models for retrieving crop variables[J]. Transactions of the Chinese Society of Agricultural Engineering (Transactions of the CSAE), 2017, 33(1): 190-198. (in Chinese with English abstract)
[17] XIE C, YANG C. A review on plant high-throughput phenotyping traits using UAV-based sensors[J]. Computers and Electronics in Agriculture, 2020, 178: 105731.
[18] HU P, CHAPMAN S C, WANG X, et al. Estimation of plant height using a high throughput phenotyping platform based on unmanned aerial vehicle and self-calibration: Example for sorghum breeding[J]. European Journal of Agronomy, 2018, 95: 24-32.
[19] AMPATZIDIS Y, PARTEL V. UAV-based high throughput phenotyping in citrus utilizing multispectral imaging and artificial intelligence[J]. Remote Sensing, 2019, 11(4): 410.
[20] HERZIG P, BORRMANN P, KNAUER U, et al. Evaluation of RGB and multispectral unmanned aerial vehicle (UAV) imagery for high-throughput phenotyping and yield prediction in barley breeding[J]. Remote Sensing, 2021, 13(14): 2670.
[21] CHIVASA W, MUTANGA O, BURGUEÑO J. UAV-based high-throughput phenotyping to increase prediction and selection accuracy in maize varieties under artificial MSV inoculation[J]. Computers and Electronics in Agriculture, 2021, 184: 106128.
[22] FULLANA-PERICÀS M, CONESA M À, GAGO J, et al. High-throughput phenotyping of a large tomato collection under water deficit: Combining UAVs’ remote sensing with conventional leaf-level physiologic and agronomic measurements[J]. Agricultural Water Management, 2022, 260: 107283.
[23] LYRA D H, VIRLET N, SADEGHI-TEHRAN P, et al. Functional QTL mapping and genomic prediction of canopy height in wheat measured using a robotic field phenotyping platform[J]. Journal of Experimental Botany, 2020, 71(6): 1885-1898.
[24] HASSAN M A, YANG M, FU L, et al. Accuracy assessment of plant height using an unmanned aerial vehicle for quantitative genomic analysis in bread wheat[J]. Plant Methods, 2019, 15(1): 1-12.
[25] BREITZMAN M W, BAO Y, TANG L, et al. Linkage disequilibrium mapping of high-throughput image-derived descriptors of plant architecture traits under field conditions[J]. Field Crops Research, 2019, 244: 107619.
[26] SANTINI F, KEFAUVER S C, ARAUS J L, et al. Bridging the genotype–phenotype gap for a Mediterranean pine by semiautomatic crown identification and multispectral imagery[J]. New Phytologist, 2021, 229(1): 245-258.
[27] COUPEL-LEDRU A, PALLAS B, DELALANDE M, et al. Tree architecture, light interception and water‐use related traits are controlled by different genomic regions in an apple tree core collection[J]. New Phytologist, 2022, 234(1): 209-226.
[28] JIANG Z, TU H, BAI B, et al. Combining UAV-RGB high-throughput field phenotyping and genome‐wide association study to reveal genetic variation of rice germplasms in dynamic response to drought stress[J]. New Phytologist, 2021, 232(1): 440-455.
[29] FEDERER W T, REYNOLDS M, CROSSA J. Combining results from augmented designs over sites[J]. Agronomy Journal, 2001, 93(2): 389-395.
[30] 中华人民共和国农业部. 农作物品种区域试验技术规程小麦:NY/T 1301-2007 [S]. 北京:农业农村部,2007.
[31] MENG L, LI H, ZHANG L, et al. QTL IciMapping: Integrated software for genetic linkage map construction and quantitative trait locus mapping in biparental populations[J]. The Crop Journal, 2015, 3(3): 269-283.
[32] 王洋洋. 春季低温对小麦生理和产量的影响及冻害评价[D]. 郑州:河南农业大学,2021.
WANG Yangyang. Effect of Spring Low Temperature on Wheat Physiology and Yield and Evaluation of Freezing Injury[D]. Zhengzhou: Henan Agricultural University, 2021. (in Chinese with English abstract)
[33] TUCKER C J. Red and photographic infrared linear combinations for monitoring vegetation[J]. Remote Sensing of Environment, 1979, 8(2): 127-150.
[34] HUETE A, DIDAN K, MIURA T, et al. Overview of the radiometric and biophysical performance of the MODIS vegetation indices[J]. Remote Sensing of Environment, 2002, 83(1/2): 195-213.
[35] GITELSON A A, GRITZ Y, MERZLYAK M N. Relationships between leaf chlorophyll content and spectral reflectance and algorithms for non-destructive chlorophyll assessment in higher plant leaves[J]. Journal of Plant Physiology, 2003, 160(3): 271-282.
[36] CRIPPEN R E. Calculating the vegetation index faster[J]. Remote Sensing of Environment, 1990, 34(1): 71-73.
[37] MACCIONI A, AGATI G, MAZZINGHI P. New vegetation indices for remote measurement of chlorophylls based on leaf directional reflectance spectra[J]. Journal of Photochemistry and Photobiology B: Biology, 2001, 61(1/2): 52-61.
[38] GITELSON A A, KAUFMAN Y J, MERZLYAK M N. Use of a green channel in remote sensing of global vegetation from EOS-MODIS[J]. Remote sensing of Environment, 1996, 58(3): 289-298.
[39] HUETE A R. A soil-adjusted vegetation index (SAVI)[J]. Remote Sensing of Environment, 1988, 25(3): 295-309.
[40] RONDEAUX G, STEVEN M, BARET F. Optimization of soil-adjusted vegetation indices[J]. Remote Sensing of Environment, 1996, 55(2): 95-107.
[41] GITELSON A A, MERZLYAK M N, Chivkunova O B. Optical properties and nondestructive estimation of anthocyanin content in plant leaves[J]. Photochemistry and Photobiology, 2001, 74(1): 38-45.
[42] WU C, NIU Z, TANG Q, et al. Estimating chlorophyll content from hyperspectral vegetation indices: Modeling and validation[J]. Agricultural and Forest Meteorology, 2008, 148(8/9): 1230-1241.
[43] LOUHAICHI M, BORMAN M M, JOHNSON D E. Spatially located platform and aerial photography for documentation of grazing impacts on wheat[J]. Geocarto International, 2001, 16(1): 65-70.
[44] FILELLA I, SERRANO L, SERRA J, et al. Evaluating wheat nitrogen status with canopy reflectance indices and discriminant analysis[J]. Crop Science, 1995, 35(5): 1400-1405.
[45] RAPER T B, VARCO J J. Canopy-scale wavelength and vegetative index sensitivities to cotton growth parameters and nitrogen status[J]. Precision Agriculture, 2015, 16(1): 62-76.
[46] BROGE N H, LEBLANC E. Comparing prediction power and stability of broadband and hyperspectral vegetation indices for estimation of green leaf area index and canopy chlorophyll density[J]. Remote Sensing of Environment, 2001, 76(2): 156-172.
[47] GONZÁLEZ A G, HERRADOR M Á, ASUERO A G. Intra-laboratory assessment of method accuracy (trueness and precision) by using validation standards[J]. Talanta, 2010, 82(5): 1995-1998
[48] CHEN T, GUESTRIN C. Xgboost: A scalable tree boosting system[C]. Proceedings of the 22nd Acm Sigkdd International Conference on Knowledge Discovery and Data Mining. New York: Association for Computing Machinery, 2016: 785-794.
[49] PERRAS M, SARHAN F. Synthesis of freezing tolerance proteins in leaves, crown, and roots during cold acclimation of wheat[J]. Plant Physiology, 1989, 89(2): 577-585.
[50] NOBLE W S. What is a support vector machine?[J]. Nature Biotechnology, 2006, 24(12): 1565-1567.
[51] HABOUDANE D, MILLER J R, TREMBLAY N, et al. Integrated narrow-band vegetation indices for prediction of crop chlorophyll content for application to precision agriculture[J]. Remote Sensing of Environment, 2002, 81(2/3): 416-426.
[52] HENDERSON C R. Best linear unbiased estimation and prediction under a selection model[J]. Biometrics, 1975, 31(2): 423-447.
[53] QUINONERO-CANDELA J, RASMUSSEN C E. A unifying view of sparse approximate Gaussian process regression[J]. The Journal of Machine Learning Research, 2005, 6: 1939-1959.
[54] SZALAI G, PAP M, JANDA T. Light-induced frost tolerance differs in winter and spring wheat plants[J]. Journal of Plant Physiology, 2009, 166(16): 1826-1831.
[55] FRIEDMAN J H. Greedy function approximation: A gradient boosting machine[J]. Annals of Statistics, 2001, 29(5): 1189-1232.
[56] CROSATTI C, POLVERINO de LAURETO P, BASSI R, et al. The interaction between cold and light controls the expression of the cold-regulated barley gene cor14b and the accumulation of the corresponding protein[J]. Plant Physiology, 1999, 119(2): 671-680.
[57] MONROY A F, DRYANOVA A, MALETTE B, et al. Regulatory gene candidates and gene expression analysis of cold acclimation in winter and spring wheat[J]. Plant Molecular Biology, 2007, 64(4): 409-423.
[58] GALIBA G, VÁGÚJFALVI A, LI C, et al. Regulatory genes involved in the determination of frost tolerance in temperate cereals[J]. Plant Science, 2009, 176(1): 12-19.
[59] SOLEIMANI B, LEHNERT H, BABBEN S, et al. Genome wide association study of frost tolerance in wheat[J]. Scientific Reports, 2022, 12(1): 1-11.
High-throughput phenotyping for different genotype wheat frost using UAV-based remote sensing
LIU Yixue1,2,3, YU Rui4,5, WU Jianhui4,5, HAN Dejun4,5, SU Baofeng1,2,3
(1.712100,; 2.712100,; 3.712100; 4.712100; 5.,712100,)
Wheat (triticum aestivum l.) breeding technology can face a great challenge on the long cycle, low efficiency, and narrow genetic background. An important breakthrough can be combining the high-throughput phenotyping of in-field wheat and genome-wide association, thereby revealing the genetic variation in dynamic response to environmental stress. Fortunately, the unmanned aerial vehicle (UAV) remote sensing and machine learning can be expected to bridge the genotype–phenotype gap of the wheat in the breeding process. Among them, frost tolerance is an important phenotype target, particularly with the winter survival of wheat in various environments. It is a high demand for the rapid and cost-effective assessment of frost tolerance from the UAV multi-spectral imagery using machine learning. In this study, a genome-wide association study (GWAS) was assessed for the quantitative genomic analysis of wheat frost tolerance. A bi-parental wheat population consisting of 491 doubled haploid lines was also used in four study sites. 491 wheat core materials with a relatively consistent growth stage were selected to obtain their high-density genotype data with the 660 K single nucleotide polymorphism (SNP). The UAV-based multi-spectral imagery of the wheat canopy was collected at the overwintering stage at four experimental sites. At the same time, the wheat in-field phenotypes of frost tolerance were investigated by the wheat breeding experts at the same time. The image pre-processing was performed on the features generation of 16 spectral vegetation indices, including image mosaic, geometric correction, radiometric correction and index calculation. Image segmentation was utilized to obtain the features of the wheat canopy using unsupervised clustering. The features correlation analysis and importance analysis were implemented to compare with the in-field investigation, in order to identify quantitative trait loci (QTL) underlying frost tolerance. A comparison was then made on the evaluation models of wheat freezing injury established by random forests (RF), extreme gradient boosting (XGBoost), gradient boosting decision tree (GBDT), and support vector machine (SVM). The results showed that significantly high accuracy was achieved up to 67.94% of the classifier in the XGBoost, compared with the in-field investigation. The correlation and importance of features were also analyzed during this time. The importance of 22 spectral features to the prediction performance of the classifier was evaluated using the information gain brought by the feature, when the sub node of the classifier split. The results showed that there was the most important for the prediction performance of the classifier in the simplified Canopy Chlorophyll content index (SCCCI) among the 16 spectral features of the wheat canopy. Three QTLs were also closely related to the frost resistance detected by the genome-wide association analysis. The three loci of 2B, 3A, and 5A on chromosome 21 of wheat presented a significant SNP, even exceeding the threshold (-lg=4). The SNPs were continuously distributed. Therefore, the spectral features using UAV remote sensing can be expected to serve as the wheat frost resistance QTL. The UAV-enabled phenotyping can be an effective, high-throughput, and cost-effective approach to understanding the genetic basis of wheat frost tolerance in genetic studies and practical breeding. This finding can also provide a fast way for the high-throughput phenotyping of wheat frost tolerance for wheat winter survival in the field.
UAV; remote sensing; wheat frost; multispectral; GWAS; machine learning
10.11975/j.issn.1002-6819.202206279
S127
A
1002-6819(2023)-05-0128-09
刘易雪,蔚睿,吴建辉,等. 不同基因型小麦冻害无人机遥感高通量表型[J]. 农业工程学报,2023,39(5):128-136.doi:10.11975/j.issn.1002-6819.202206279 http://www.tcsae.org
LIU Yixue, YU Rui, WU Jianhui, et al. High-throughput phenotyping for different genotype wheat frost using UAV-based remote sensing[J]. Transactions of the Chinese Society of Agricultural Engineering (Transactions of the CSAE), 2023, 39(5): 128-136. (in Chinese with English abstract) doi:10.11975/j.issn.1002-6819.202206279 http://www.tcsae.org
2022-06-27
2023-02-22
国家重点研发计划(2021YFD1200600);杨凌种业创新中心重点研发项目(YLzy-xm-01)
刘易雪,博士生,研究方向为田间植物表型方法。Email:sunnyliu@nwafu.edu.cn
苏宝峰,副教授,博士生导师,研究方向为田间植物表型快速获取及应用。Email:bfs@nwsuaf.edu.cn
猜你喜欢
国际太空(2023年1期)2023-02-27
今日农业(2022年1期)2022-06-01
中国农业信息(2022年1期)2022-05-25
农业机械学报(2021年11期)2021-12-07
大气科学(2021年1期)2021-04-16
透析与人工器官(2020年1期)2020-11-16
今日农业(2020年24期)2020-03-17
海峡姐妹(2020年1期)2020-03-03
铁道通信信号(2019年8期)2019-10-10
水利技术监督(2017年2期)2017-05-17