
Evaluation of red soil-bentonite mixtures for compacted clay liners
2024-02-29 14:50DevapriyaThyagaraj
A.S.Devapriya,T.Thyagaraj
Department of Civil Engineering,Indian Institute of Technology Madras,Chennai,600 036,India
Keywords:Compacted clay lines Hydraulic conductivity Wet-dry cycles Microstructure
ABSTRACT Compacted clay liners are an integral part of the waste landfills,which are provided to contain the leachate within the landfills and protect the surrounding environment.Generally,locally available natural soils are used for the construction of compacted clay liners if they satisfy the design criteria.However,not all soils in their natural state satisfy all the design criteria for the liner materials.Thus,there is a definite need to modify the locally available natural soils by blending with bentonite to meet the required design criteria for the liners.In view of this,the present study evaluates the suitability of an Indian red soil enhanced with bentonite as a liner material.To achieve this,a series of experiments were carried out using locally available red soil and bentonite.First,the suitability of the red soil was evaluated as a liner material.The experimental results showed that the red soil met all the selection criteria stipulated by the Environmental Protection Agencies (EPAs) for the liners except the hydraulic conductivity criterion.Therefore,the red soil was mixed with bentonite contents of 10%,20% and 30%,and the red soil-bentonite mixtures were evaluated for their suitability for liners in their compacted state.Further,as the liners in the arid and semi-arid regions are subjected to moisture variations due to seasonal moisture fluctuations and other factors,the red soil-bentonite mixtures were subjected to wetdry cycles,and their suitability was evaluated after wet-dry cycles.The experimental results revealed that all the red soil-bentonite mixtures met the stipulated EPA criteria for the liners in the as-compacted state.However,the red soil-bentonite mixtures with 20% and 30% bentonite contents only satisfied the hydraulic conductivity requirement even after wet-dry cycles.The experimental findings were supplemented with the microstructural insights captured through digital camera images,scanning electron microscopy (SEM),and mercury intrusion porosimetry (MIP) studies.
1.Introduction
Landfills are engineered systems used for the final disposal of solid wastes on land.They are an inseparable part of solid waste management,designed to prevent the infiltration of leachates produced in the landfills into the underlying soils and groundwater.Compacted clay liners are essential parts of landfills,provided to contain the waste within the landfills.Liners provided at the top,called as covers,isolate the waste from the atmosphere,control the foul smell,and prevent water seepage into the underlying waste.Liners provided at the bottom separate the waste from the underlying soil and groundwater and prevent the leachate from coming into contact with the underlying soils (Daniel and Benson,1990;Vardon and Heimovaara,2017;Parameswaran et al.,2020).The effectiveness of liners is governed by their ability to limit the movement of water and leachate.Thus,the soils used as compacted clay liners must possess very low hydraulic conductivity(Gueddouda et al.,2016).The limiting values of various geotechnical properties for any soil to be selected as a liner material have been fixed with the goal of attaining a very low hydraulic conductivity value of 1×10⁻⁷cm/s or lower(Sarsby,2013).The Ireland EPA (2000) listed the factors affecting the hydraulic conductivity and the design of liners as follows: clay content,particle size distribution,degree of compaction(density),compaction method,and moisture content.Daniel (1993) recommended the following requirements for a soil to satisfy the hydraulic conductivity criterion:percentage fines ≥30%-50%,plasticity index (PI) ≥7%-10%,percentage of gravel ≤20%-50%,and maximum particle size=25-50 mm.Whereas Benson et al.(1994) suggested the following soil properties: liquid limit ≥20%,PI≥7%,percentage of fines ≥30%,and percentage of clay ≥15%.The guidelines given by various Environmental Protection Agencies are summarized in Table 1.

Table 1Different EPA guidelines for selection of natural clays as liner materials.
Generally,the locally available natural soils are used for the construction of compacted clay liners as long as they satisfy the design criteria.Kaolinitic Indian red soil,which accounts for around 10.6% of the total geographical area of India,can be used as a liner material (Sivapullaiah and Lakshmikanta,2003,2005;Dwevedi et al.,2017).Soils used for the liners must be non-susceptible to differential settlements,have self-healing ability,and have proper swelling and shrinkage characteristics(Brandl,1992).Bentonite is a common additive used to improve the soils available on-site when they do not satisfy the hydraulic conductivity requirements.Bentonite,which predominantly consists of montmorillonite,has greater swelling ability and provides better sealing and,thus,the lower hydraulic conductivity (Tripathy et al.,2015;Razakamanantsoa et al.,2016;Rout and Singh,2020;Sun et al.,2022).Bentonite can be used as an additive in any type of soil,but the amount of bentonite required has to be determined.Daniel(1993)reported that the well-graded soils usually require less than 6%bentonite by weight,and the uniform-sized sands require 10%-15%bentonite.Sivapullaiah and Lakshmikanta(2005)reported that the percentage of bentonite used in the field varies between 3%and 20%.Akgun et al.(2015) observed that a 30% bentonite-sand mixture fulfilled the minimum criterion for proper isolation of radioactive wastes.Currently,the standard engineering guidelines are unavailable for choosing the percentage of bentonite depending on the type of soil.Therefore,it is imperative that before constructing a compacted clay liner in the field,laboratory tests have to be carried out to determine the bentonite content that will satisfy the design criteria (Kumar and Yong,2002).
Further,various researchers have shown that even though the compacted clay liners satisfy the hydraulic conductivity requirement at the time of construction,their long-term performance may be affected by multiple climatic and physico-chemical factors(Rowe,2005).These factors include the alternate wet-dry cycles due to seasonal moisture fluctuations (as the liners are placed in the active zone),groundwater fluctuations,interaction with leachates,and the heat generated from the landfills,which results in cyclic volume changes in the lining materials(Khire et al.,1997).This,in turn,may result in large settlements and loss of strength in the landfill liners.Studies on hydraulic conductivity by various researchers (Omidi et al.,1996;Albrecht and Benson,2001;Rayhani et al.,2007 and others) have shown that the desiccation cracks formed during the drying cycles never fully heal during the subsequent wetting cycles,and they act as preferential flow paths,thus increasing the hydraulic conductivity of liners.
Another factor that influences the hydraulic conductivity of compacted clay liners is the microstructural changes.Compacted clay liners are characterized by a double structure comprising of macropores (inter-aggregate pores) and micropores (intra-aggregate pores).Studies have shown that the alternate wet-dry cycles alter the soil fabric,changing the pore size distribution in the soils that change the hydraulic behaviour of the compacted clays(Romero,2013;Musso et al.,2013;Tang et al.,2023;Abbas et al.,2023).Romero (2013) presented the effect of microstructural variations on the hydraulic behaviour of clayey soils and reported that the water permeability is a function of inter-aggregate pores.Further,Manca et al.(2016) studied the evolution of the pore size density (PSD) of compacted sand-bentonite mixtures subjected to hydro-mechanical loading and found that the initial bimodal PSD became unimodal on wetting,due to the expansion of micropores and the consequent reduction of the macropores volume.Similar observations on the continuous evolution of the PSDs due to alternate wet-dry cycles were reported by Thyagaraj and Julina(2019) and Tang et al.(2023).Contrastingly,Liu et al.(2020) reported a shift in the PSD of compacted granite residual soil from a unimodal structure to bimodal structure.They have also observed a significant reduction in the volume of clay-size particles due to the continuous rearrangement of the soil aggregates from cementation bonds during dry-wet cycles.In addition,Liu et al.(2021)reported that the alternate dry-wet cycles decreased both inter-aggregate and intra-aggregate pore volumes of compacted coal gangue,whereas the pore sizes were independent of dry-wet cycles.
Even though the compacted clay behaviour during wet-dry cycles has been studied extensively,and a few research studies have been conducted on using the red soil as a liner or cover material,the research studies that evaluate the suitability of locally available soils as liner materials when subjected to alternate wetting and drying cycles are lacking.Further,the studies on amelioration of locally available soils with bentonite to satisfy the design requirements for liner applications,including the wet-dry effects,are lacking and needs examination.Hence,this article presents the characteristic properties of Indian red soil-bentonite mixtures and examines their hydraulic behaviour when subjected to wet-dry cycles to check their employability as a liner material.
2.Materials used
The present study uses al ocally sourced Indian red soil collected from the Indian Institute of Technology Madras campus,Chennai,India.The red soil was first air-dried,pulverized,passed through a 2 mm sieve,and mixed thoroughly to ensure homogeneity.X-ray diffraction (XRD) analysis was carried out to determine the major minerals in the red soil.The XRD pattern indicates that the kaolinite is the predominant clay mineral in the red soil(Fig.1).The red soil was ameliorated using a commercially available Na-bentonite.XRD analysis carried out on the bentonite confirms that the montmorillonite is the predominant clay mineral present in bentonite(Fig.1).Bentonite(B)was mixed with the red soil(R)in proportions of 10%,20% and 30% by weight to obtain the red soil-bentonite mixtures: R90-B10,R80-B20 and R70-B30,respectively.
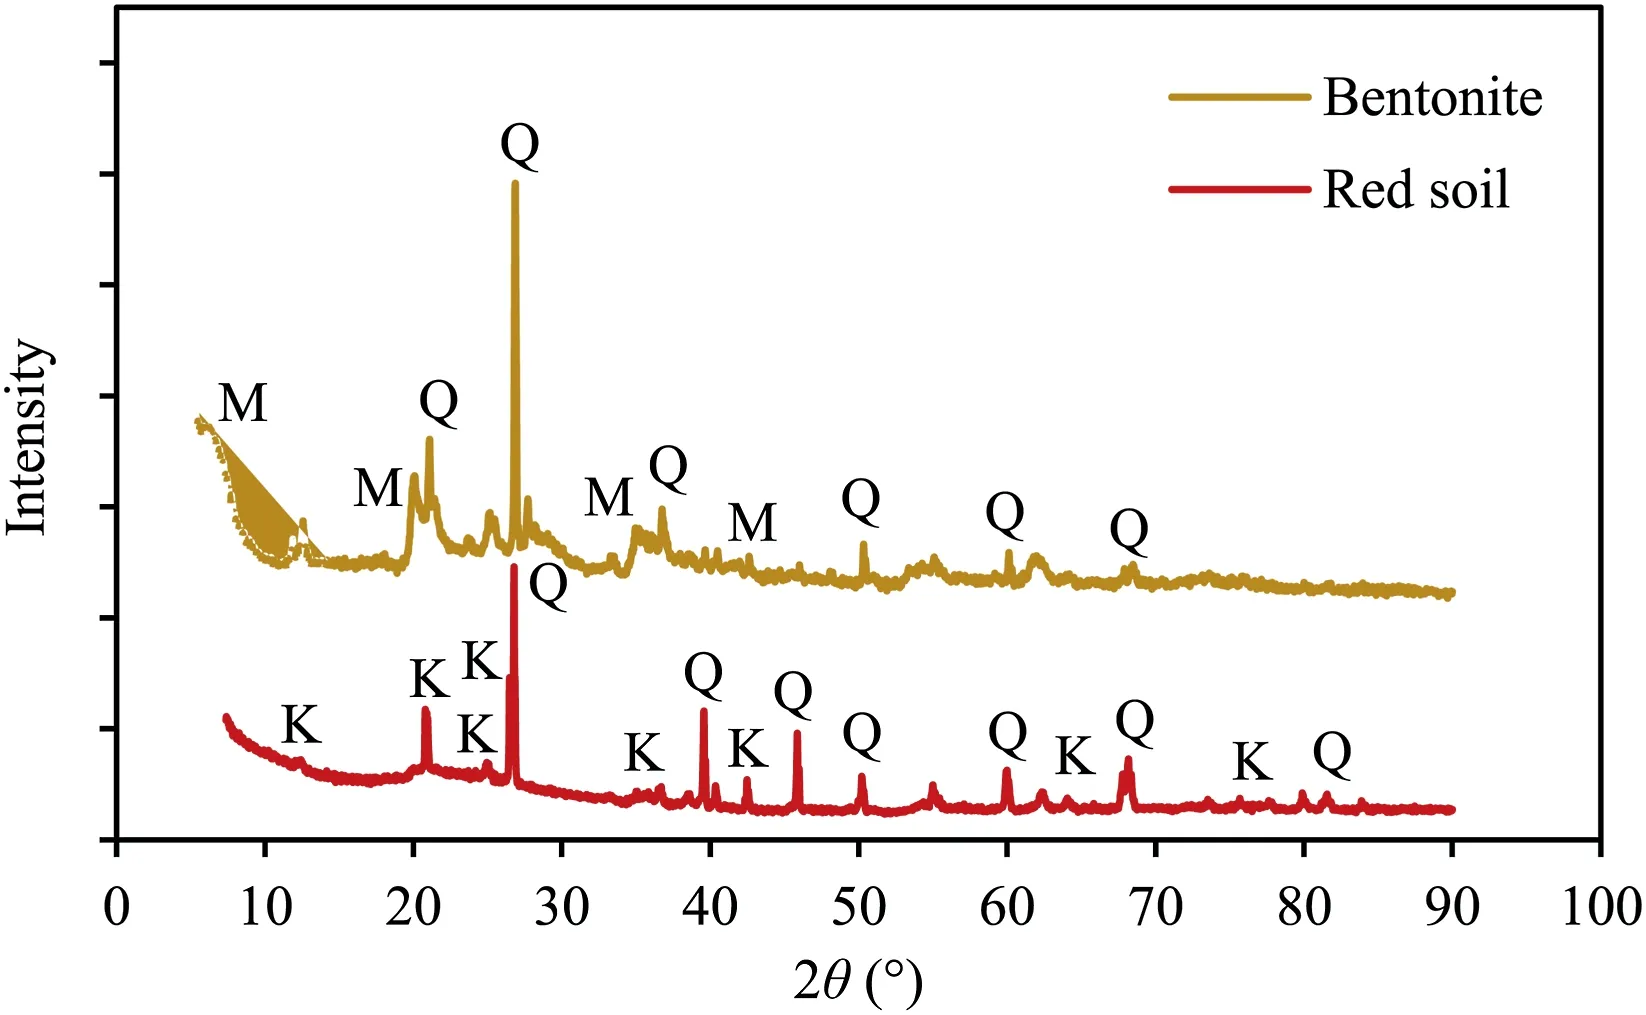
Fig.1.XRD diffraction pattern of red soil and bentonite.M -montmorillonite;K -Kaolinite;Q -Quartz.
3.Experimental program
The characteristic properties of the red soil,bentonite,and the red soil-bentonite mixtures were determined in accordance with the respective Indian Standard codes.The grain size distributions of the red soil and bentonite were determined as per IS 2720-4(1985),and the results are presented in Table 2.The Atterberg limits of the red soil and red soil-bentonite mixtures were determined as per IS 2720-5(1985)and IS 2720-6(1972),IS 2720-5(1985).The standard Proctor compaction characteristics of the soils were determined as per IS 2720-7 (1980).The red soil and bentonite are classified as clayey sand (SC) and inorganic clay of high plasticity (CH),respectively,according to the unified soil classification system(USCS).
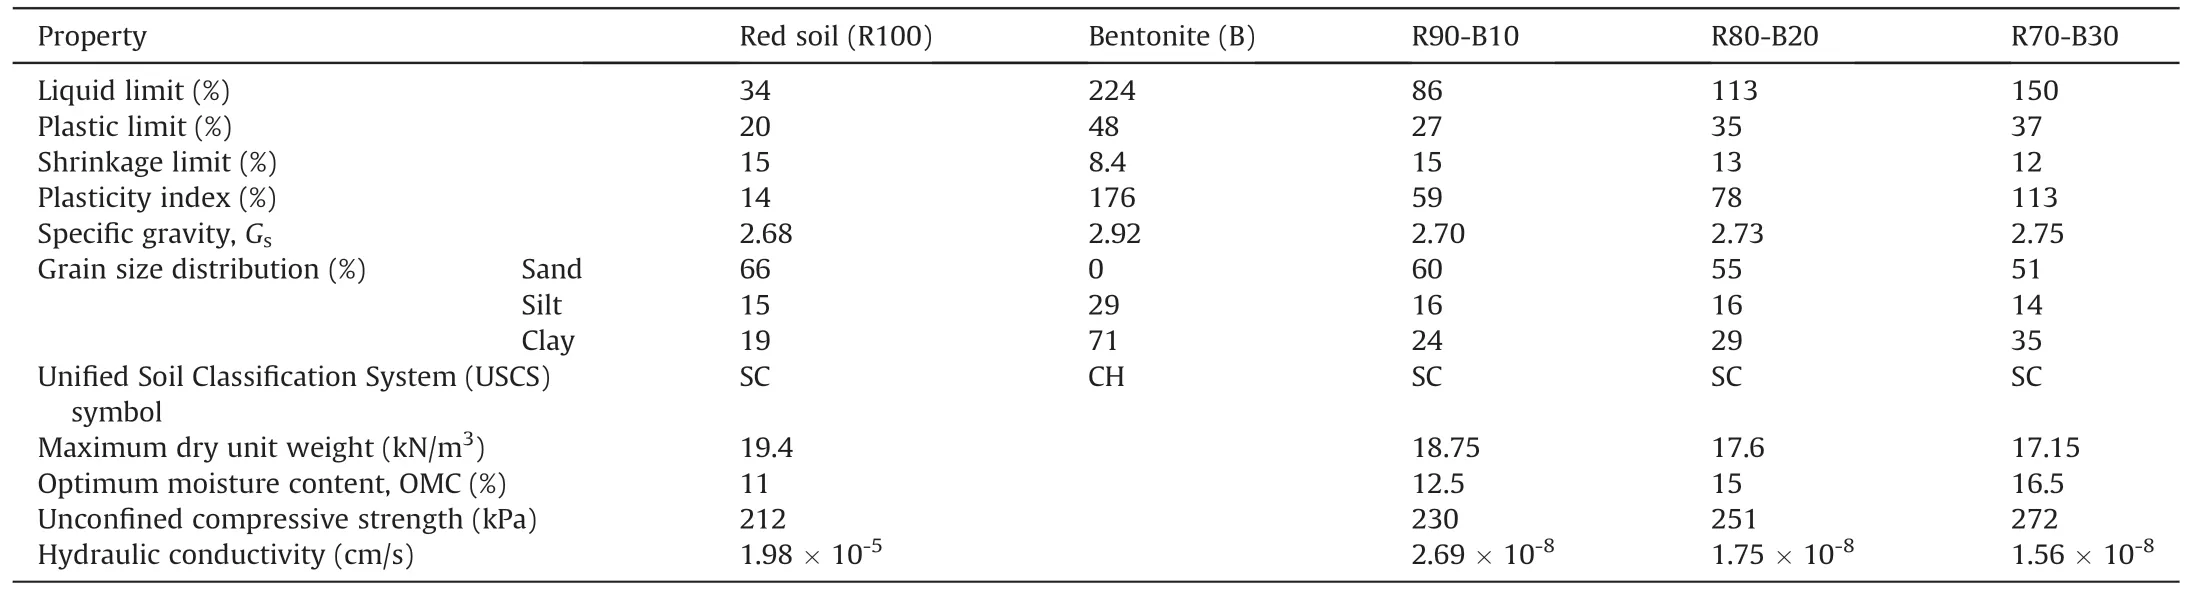
Table 2Properties of red soil,bentonite and red soil-bentonite mixtures(after Devapriya and Thyagaraj,2021).
For studying the volume change and hydraulic behaviour of the red soil and red soil-bentonite mixtures when subjected to alternate wet-dry cycles,the R100 (red soil alone),R90-B10,R80-B20 and R70-B30 mixtures were prewetted using distilled water (DW)to their respective optimum moisture content(OMC)and statically compacted to their corresponding standard Proctor maximum dry unit weight in the oedometer rings of 75 mm in diameter and 30 mm in height to an initial height of 20 mm.Identical specimens thus compacted were placed between two clean,dry porous stones along with two filter papers,and were placed in the oedometer cells.The oedometer cells were then mounted on the oedometer swell test set-ups,and a nominal surcharge of 12.5 kPa was applied.The specimens were then inundated using DW,and the vertical deformation was measured using the dial gauges of 0.002 mm least count.The final percentage swell was calculated by
where ΔHis the increase in the height of the soil specimen during wetting,andHis the initial as-compacted height of the soil specimen for the first wetting cycle and the height of the desiccated specimen at the end of drying cycles for the subsequent wetting cycles.
After complete swelling of the specimens,the inundating fluid was removed from the oedometer cells,and the specimens were taken out from the oedometer test set-ups.The specimens were then allowed to dry completely at a constant temperature of(45±2)°C under the same vertical load of 12.5 kPa.After complete drying,the weight,height and diameter of the dried specimens were measured,and the desiccated specimens were subjected to the next cycle of wetting.The process was repeated for five wet-dry cycles until the specimens reached equilibrium bandwidth.
The hydraulic conductivity of the specimens subjected to wetdry cycles was measured using the flexible wall permeability test set-ups in accordance with ASTM D5084-16a(2016).The tests were carried out on additional identical specimens after each wetting cycle.The hydraulic conductivity was measured using the constant head method on specimens consolidated under three effective confining stresses of 20 kPa,50 kPa and 100 kPa.
Mercury intrusion porosimetry (MIP) tests were conducted using the Thermo Scientific-Pascal Mercury Porosimeters(140,440 series) to analyse the changes in the microstructure of compacted soil specimens when subjected to repeated wet-dry cycles.Scanning electron microscopy (SEM) images were also captured using the high-resolution scanning electron microscope (Quanta 200).The samples for the microstructural testing were obtained after subjecting the additional identical specimens to different wetting cycles.The SEM and MIP tests were carried out on soil specimens extruded from the as-compacted specimens and selected swollen specimens after subjecting them to 8 h of freeze drying.
The image analysis technique was employed on the digital camera and XCT images of the specimens to understand further the microstructural changes that occurred due to wet-dry cycles.ImageJ Fiji software was used for quantifying the macropores on a selected representative area of the image of the soil specimens in the as-compacted state and after different wetting cycles.Digital camera images of the surface of compacted red soil and red soilbentonite mixtures were captured using a camera with effective pixels of 20.1 MP.XCT images of R80-B20 specimens in the ascompacted state and after different wetting cycles were obtained using the General Electric Phoenix Vtomex S X-ray tomography(XCT) scanner.XCT images obtained at the mid-depth of the specimens during each stage were used for the analysis.For the image analysis,first,the required image was opened in the ImageJ Fiji software.The image was then scaled using the known diameter of the soil specimen,and a representative area of 4 cm2was selected on the soil specimen.The selected area was then cropped and used for the analysis.The image was then converted into a binary image by thresholding.A threshold number of 73 was found to be most appropriate for the XCT images (Saba et al.,2014).Whereas the binary images of the digital camera images were obtained using threshold values ranging from 73 to 100,based on visual observation of the macropores captured on the binary and digital camera images (Ramesh and Thyagaraj,2022a).The binary image thus obtained was used to capture the macropores on the compacted soil surface (or mid-depth,in the case of the XCT images),whose areas were also obtained through the ImageJ software.The macropores were assumed to be circular,and the areas obtained were used for arriving at the diameters of pores.
“What do you mean?” Debbie inquired, more than a little puzzled. Looking at her with love-filled eyes, Tommy said, “Just think of all those years we didn’t know each other.
4.Results and discussion
4.1.Evaluation of red soil as a potential liner material
The red soil collected for the study was tested to determine its various characteristic properties.The properties measured are listed in Table 2.Atterberg limits indicate that thePIof the red soil is 14%.Based on the grain size distribution and the plasticity characteristics,the red soil is classified as clayey sand (SC),with 0%gravel and 34%fines.This is within the prescribed limits proposed by various Environmental Protection Agency (EPA) guidelines(Table 1).Table 1 shows that only the UK EA (2014a) and CPHEEO(2016) have the prescribed limits for the liquid limit (LL) values.LLof 34% is much lower than the 90% limit of the UK EA (2014a)while it is slightly greater than the maximum limit of 30% listed by the CPHEEO (2016).As the higherLLwould give a lower hydraulic conductivity,and thePIis well within the limits prescribed by all the EPAs,anLLof 34% can be accepted.Further,the unconfined compressive strength (UCS) of the red soil was found to be 212 kPa,which is higher than the prescribed minimum value of 200 kPa and also satisfies the undrained strength criterion of all the EPAs (Daniel and Benson,1990).
It should be noted here that the guidelines prescribed by various EPAs are mainly governed by the hydraulic conductivity requirement of 1×10⁻⁷cm/s.However,the hydraulic conductivity test on the red soil in its as-compacted state gave a very high hydraulicconductivity value of 1.98 × 10⁻⁵cm/s.Thus,it is evident that despite satisfying the criteria of selection based on the index properties for the acceptable liner materials prescribed by different EPAs (Table 1),the selected red soil did not satisfy the hydraulic conductivity requirement.Therefore,the locally available kaolinitic red soil was ameliorated with bentonite so as to meet the hydraulic conductivity criterion of the liners.In the subsequent sections,the basic characteristics of the red soil-bentonite mixtures and the volume change,microstructure,and hydraulic behaviour of the compacted red soil-bentonite mixtures in the as-compacted state and after different wet-dry cycles are presented and discussed.
4.2.Effect of bentonite on characteristic properties of red soil
The index and engineering properties of the red soil-bentonite mixtures (R90-B10,R80-B20 and R70-B30) are listed in Table 2,along with the properties of red soil(R100).The effect of bentonite content on the characteristic properties of the red soil-bentonite mixtures is discussed in this section.Also,the properties of the red soil-bentonite mixtures are compared with various EPA selection criteria available for the selection of natural clays.
Fig.2 shows the variation ofLL,plastic limit(PL),shrinkage limit(SL) andPIwith bentonite content of the red soil-bentonite mixtures.With the addition of bentonite,theLL,PLandPIof the red soil increased,whereas the SL reduced.It is well known from the literature that the plasticity behaviour of the soil is governed by its clay content and the type of clay mineral (Seed et al.,1964;Sivapullaiah and Sridharan,1985;Polidori,2007).Even for a nominal increase in the clay content with the montmorillonite clay particles from 19% to 24% in the case of the R90-B10 mixture,the plasticity characteristics were altered significantly,which is evidenced by the marked increase inPIfrom 14% to 59%.Further,it should be noted here that the R90-B10 mixture withLLof 86%andPIof 59%satisfied the guideline requirements of the UK EA(2014a),while the R80-B20 and R70-B30 mixtures withLLof 113%and 150%,andPIof 78% and 113%,respectively,are much higher than the upper limits of UK EA(2014a) criteria for the natural clays.

Fig.2.Variations of LL, PL, SL and PI of red soil-bentonite mixture with increase in bentonite content.
Fig.3 shows the variation of maximum dry unit weight(γdmax)and OMC with the bentonite content.The maximum dry unit weight decreased from 19.4 kN/m3to 18.75 kN/m3,17.16 kN/m3and 17.15 kN/m3,and the OMC increased from 11% to 12.5%,15% and 16.5%,with the addition of 10%,20% and 30% bentonite to the red soil,respectively.The OMC of the red soil-bentonite mixtures increased with the increase in bentonite content owing to the increase inPI(Holtz et al.,2011).
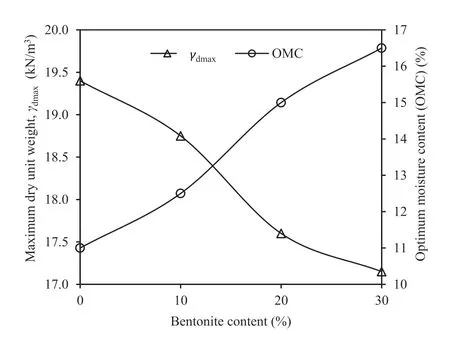
Fig.3.Variations of maximum dry unit weight(γdmax)and optimum moisture content(OMC) with bentonite content in red soil-bentonite mixture.
Fig.4 presents the variation of UCS of red soil with the bentonite content.The average value of three determinations of UCS was used for the plotting.Fig.4 also shows the maximum and minimum values of UCS for red soil and red soil-bentonite mixtures.The red soil has a UCS value of 212 kPa,which further increased to 230 kPa,251 kPa and 272 kPa,with the addition of 10%,20% and 30%bentonite,respectively.The increase in the UCS value with the increase in bentonite content is attributed to the changes in the soil structure.As mentioned earlier,the compacted clayey soils are characterized by a double structure consisting of microstructure and macrostructure.With the increase in the bentonite content,the volume of micropores in the red soil-bentonite mixtures increased owing to the very high swelling ability of bentonite with respect to the kaolinite clay fraction in the red soil.This results in an increase in the volume of micropores,leading to a decrease in the volume of macropores with increase in the bentonite content.The microstructural studies are presented and discussed in detail in the subsequent section.Further from Figs.3 and 4,it is evident that even though the dry density decreased with the increase in the bentonite content,the UCS increased due to the decrease in the size and volume of macropores.The increase in the UCS with bentonite content can also be explained through the aid of the loadingcollapse (LC) curves of different red soil-bentonite mixtures in σv-sspace,where σvis the net vertical stress andsis the soil suction.The initial LC curves of the red soil-bentonite mixtures move rightward with the increase in the bentonite content due to the macrostructural contraction (i.e.hardening) during loading(Gens and Alonso,1992).Thus,the UCS of the red soil-bentonite mixtures increases with the increase in bentonite content.Further,the UCS values of all the red soil-bentonite mixtures were higher than the minimum requirement (of 200 kPa) for the liners(Daniel and Benson,1990).
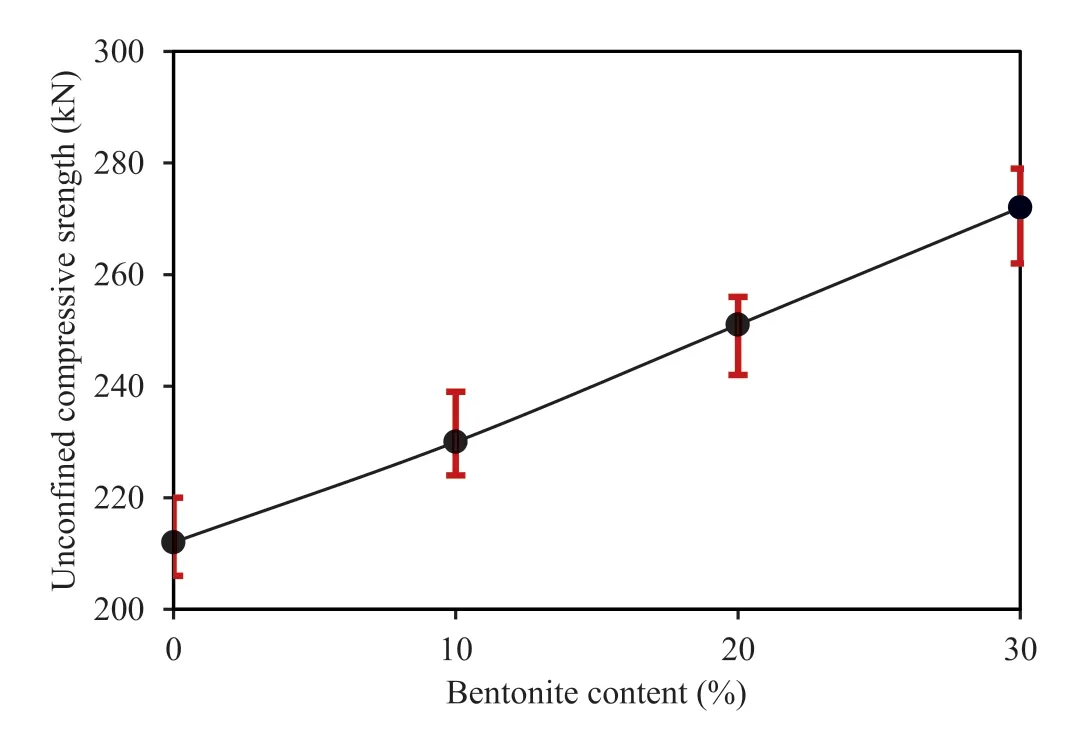
Fig.4.Variation of unconfined compressive strength with increase in bentonite content in red soil-bentonite mixture.
Fig.5 presents the variation of the hydraulic conductivity with bentonite content of the red soil-bentonite mixtures.It is evident from the figure that with the increase in bentonite content,the hydraulic conductivity of red soil-bentonite mixtures decreased significantly when tested from the as-compacted state (Fig.5 and Table 2).Bentonite with a very high specific area has large diffuse double layer(DDL)thickness,which increases the volume of bound water and,thus,the volume of micropores.This,in turn,leads to a reduction in the size and volume of macropores.Firoozfar and Khosroshiri (2017) also reported that the bentonite fills the interclod pores and thus reduces the macropores volume.Consequently,the microstructural changes drastically decreased the hydraulic conductivity of the red soil-bentonite mixtures with the bentonite content.Even though the hydraulic conductivity of all the red soil-bentonite mixtures in the as-compacted state is less than the design requirement of 1×10⁻⁷cm/s,the alternate wettingdrying cycles may affect their behaviour,and the same is discussed in detail in the subsequent section.
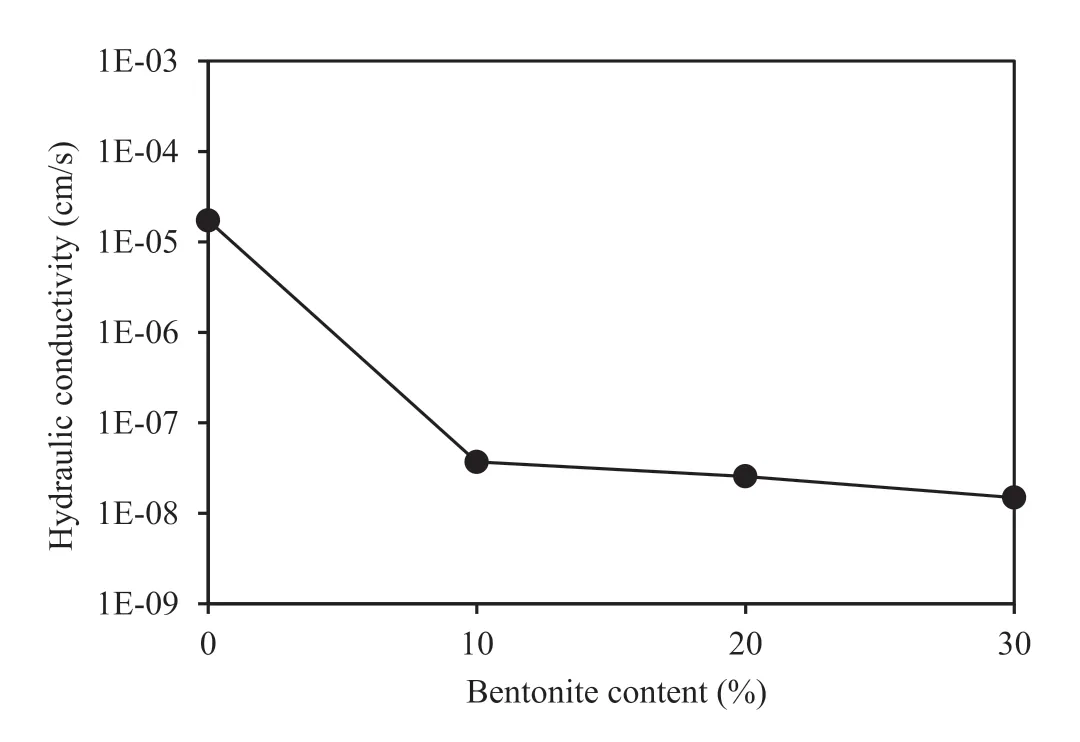
Fig.5.Variation of hydraulic conductivity of compacted red soil-bentonite mixtures with bentonite content.
4.3.Effect of wet-dry cycles on volumetric behaviour of red soilbentonite mixtures
As discussed earlier,the climatic and other factors lead to fluctuations in the water content of clay liners in the field.Thus,to simulate the water content variations that occur in the field in the current laboratory testing,the compacted red soil-bentonite mixtures were subjected to alternate wet-dry cycles,and their volume change was monitored.Fig.6a-c compares the variation of vertical,lateral and volumetric deformation of R100,R90-B10,R80-B20 and R70-B30 specimens with alternate wet-dry cycles,respectively.The vertical swell of the red soil (R100) was zero during all wet-dry cycles,while the red soil-bentonite mixtures exhibited swell.The magnitude of the swell increased with the increase in bentonite content.As discussed earlier,the swelling in clays is greatly influenced by the type of clay mineral.The swell potential of the red soil is very low compared to the bentonite,as the kaolinite is the predominant clay mineral in red soil,while the montmorillonite is the predominant clay mineral in the bentonite (Yong and Warkentin,1975).Montmorillonite,with a very high specific surface area,has many hydration sites,and upon inundation with distilled water,the water molecules are bound to the crystal lattice,leading to an increase in the DDL thickness,which in turn increases the volume of soil(Sallfors and Oberg-Hogsta,2002;Srikanth and Mishra,2016).
From Fig.6,it is evident that the percent swell during the first wetting cycle is the least (0.98%-2.95%) for the red soil-bentonite mixtures.Further,it can be observed that the second swelling is the highest for the R70-B30 mixture(4.76%),and the third swelling is the highest for R90-B10 and R80-B20 mixtures(1.58%and 3.11%).As the matric suction in the as-compacted state of the red soilbentonite specimens (with relatively higher water contents) is lower in comparison to the same specimens at the end of the drying cycles,the first wetting yielded lower swell (Tripathy and Rao,2009;Ramesh and Thyagaraj,2022b).The lower vertical swell of the red soil-bentonite specimen with lower bentonite content is also a result of macrovoid swelling that can be corroborated with the MIP data presented subsequently.
Similar to the vertical swell behaviour,the red soil (R100)specimen exhibited the least deformation due to shrinkage,whereas the R70-B30 specimen underwent the highest shrinkage deformation.During the first drying cycle,the red soil (R100)specimen showed a very nominal shrinkage of 0.0098% in the vertical direction and 0.45%in the lateral direction.The vertical and lateral shrinkage increased with the increase in the bentonite content as the plasticity of the mixtures increased.Fig.6 shows that R90-B10,R80-B20,and R70-B30 specimens attained a volumetric shrinkage of 2.54%,6.99%,and 8.33%,respectively,during the first drying cycle.The shrinkage deformation during the first drying cycle is the highest,and the shrinkage deformation reduced during the subsequent drying cycles.After the fourth wet-dry cycle,the difference between the two consecutive swell-shrink volumetric deformation decreased,indicating that the soil specimens have reached an equilibrium,beyond which the swell-shrink paths become reversible.Similar findings were reported by Day (1994),Tripathy et al.(2002),Alonso et al.(2005),and Tripathy and Rao(2009).
The red soil (R100) with zero bentonite content exhibited the least deformation in both vertical and lateral directions during swelling and shrinkage and attained equilibrium with bandwidths of 0.0098%,0.45% and 0.46% for vertical,lateral and volumetric deformation,respectively.The bandwidths of red soil-bentonite mixtures increased with the increase in bentonite content.The highest vertical,lateral,and volumetric equilibrium bandwidths of 3.25%,3.48%,and 6.70%,respectively,were attained by the R70-B30 specimen.
4.4.Effect of wet-dry cycles on the microstructure of red soilbentonite mixtures
As described in Sections 2 and 3,the SEM and MIP studies were carried out on the as-compacted specimens and after subjecting the specimens to the 1st,2nd/3rd,and 5th wetting cycles.It should be noted here that as the highest swelling occurred during the third wetting cycle for R90-B10 and R80-B20 specimens and the second cycle for the R70-B30 specimen,the microstructural tests were carried out at those cycles.Fig.7a and b presents the PSD function,and cumulative intruded mercury void ratio (eHg) plots,respectively,of red soil(R100)and red-soil bentonite mixtures in the ascompacted state.The PSDs show a bimodal distribution for all the specimens,indicating the presence of macropores and micropores in the as-compacted state.Comparison ofeHgplots of R100,R90-B10,R80-B20 and R70-B30 specimens shows that the cumulative intruded void ratio reduced with an increase in the bentonite content even though the void ratio of red soil specimens increased with bentonite content (Fig.3).The red soil (R100) specimen with zero bentonite content has the leasteHg.This is attributed primarily to the presence of large undetected macropores (>135 μm) in the compacted red soil(R100) specimen(Monroy et al.,2010;Ramesh and Thyagaraj,2022a).Further from the PSD plots (Fig.7a),it is evident that the microvoids peak mode of the red soil and red soilbentonite specimens are almost of the same size(11-12 nm),while the macrovoid peak mode shifted leftward with the increase in bentonite content.Macropores peak mode shifted from 64 μm of the R90-B10 specimen to 41 μm in the R80-B20 specimen and 26 μm in the R70-B30 specimen.Even though the R70-B30 specimen has the least dry unit weight (i.e.highest void ratio),Fig.7 shows that the cumulative intruded void ratio is the lowest and has the least macropores peak mode compared to the values of R90-B10 and R80-B20 specimens.As the OMC increased with the increase in the bentonite content (Fig.3),the bound water molecules in the crystal lattice increased,and resulted in the increase in the volume of micropores,which in turn led to the decrease in the macropores volume.Thus,the macropores peak mode reduces with increase in the bentonite content in red soil.Further,the examination of bottom surface digital camera images and the binary images of the selected area (4 cm2) of red soil and red soilbentonite mixtures in the as-compacted state (in Fig.8) confirms that the size and volume of the macropores decreased with the increase in bentonite content.The binary images of the bottom surface clearly show that the total area of macropores and the area of macropores greater than 135 μm decreased from 0.61 cm2to 0.59 cm2in the case of compacted red soil to 0.085 cm2and 0.056 cm2in case of R70-B30 specimen.
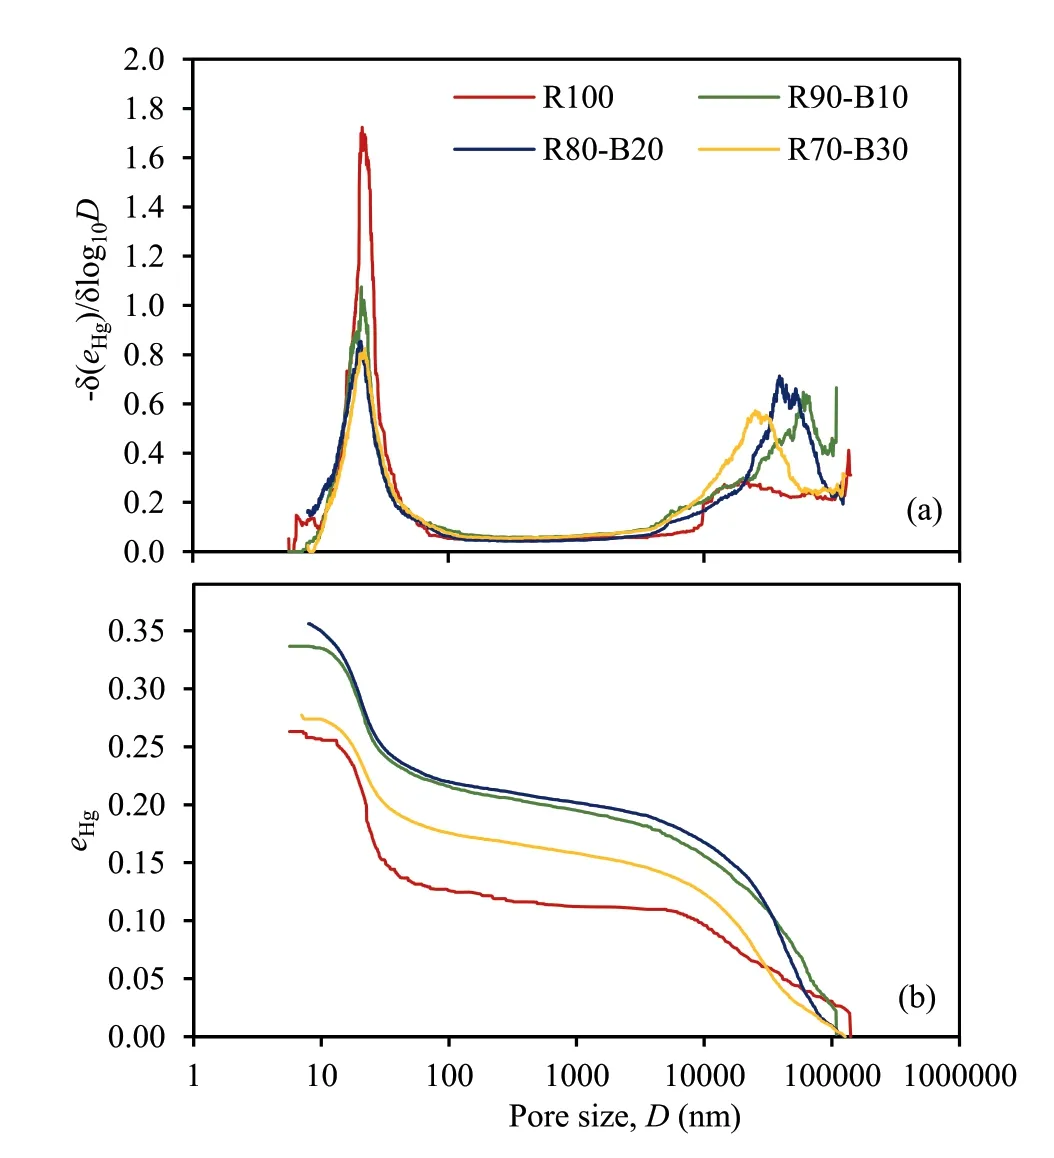
Fig.7.Comparison of (a) PSDs and (b) eHg plots of R100,R90-B10,R80-B20 and R70-B30 in the as-compacted state.

Fig.8.Digital camera images,selected area and the corresponding binary images of compacted red soil and red soil-bentonite mixtures in their as-compacted state.

Fig.9.Comparison of variations of (a) PSDs and (b) eHg plots of R90-B10,in the ascompacted state and after 1st,3rd and 5th wetting cycles.

Fig.10.Comparison of variations of (a) PSDs and (b) eHg plots of R80-B20,in the ascompacted state and after the 1st,3rd and 5th wetting cycles.

Fig.11.Comparison of variations of (a) PSDs and (b) eHg plots of R70-B30,in the ascompacted state and after the 1st,2nd and 5th wetting cycles.
Figs.9a and b,10a and b,and 11a and b compare the PSD andeHgplots in the as-compacted state and after 1st,3rd(or 2nd)and 5th wetting cycles of R90-B10,R80-B20 and R70-B30 specimens,respectively.The plots indicate a leftward shift of the macropores peak mode of R90-B10,R80-B20 and R70-B30 specimens to 31 μm,22 μm and 18 μm from the as-compacted values of 64 μm,41 μm and 26 μm,respectively,indicating the reduction in the macropores volume due to the increase in the micropores volume from the increase in DDL thickness during the first wetting cycle.TheeHgplots lie below the as-compacted stateeHgplot,indicating the closure of macropores due to swelling.Regardless of the slightly lower dry unit weight after the first wetting cycle of red soilbentonite mixtures,the cumulative intruded pore volume decreased in the swollen state with respect to their as-compacted state,which indicates that during the wetting cycles,the red soil in the red soil-bentonite mixtures shows negligible swelling,stay inert owing to the inactive kaolinite mineral in the red soil,while the bentonite undergoes the volume changes.The cumulative intruded pore volume reduces as the bentonite swells and fills the macropores in the red soil-bentonite mixtures.This is similar to the findings reported by Romero (2013) of the behaviour exhibited by sand-bentonite mixtures during wetting.MIP tests on red soilbentonite specimens after the second/third wetting cycle show a further leftward shift in the macropores peak mode of R90-B10,R80-B20 and R70-B30 specimens to 22 μm,18 μm and 9 μm,respectively,indicating further closure of macropores due to the increase in micropores volume from the DDL expansion.A slight increase in the micropores peak is also visible at this stage compared to other cycles.Further,the reduction in the size of macropores with the wet-dry cycles is illustrated through the middepth XCT images of the R80-B20 specimen,as shown in Fig.12.The XCT and binary images of R80-B20 specimen captured at the middepth show that the area and number of macropores greater than 135 μm decreased from 0.14 cm2to 67 corresponding to ascompacted state to 0.0327 cm2and 23 after 3rd wetting cycle.After the 5th wetting cycle,the PSD shows a rightward shift of the macropores peak mode,resulting in a larger mode of size of 61 μm,45 μm and 23 μm for R90-B10,R80-B20 and R70-B30 specimens,respectively.TheeHgalso indicates an increase in the cumulative intruded pore volume after the 5th wetting cycle.

Fig.12.XCT image,selected area and the binary image of the selected area of R80-B20 in the as-compacted state and after selected wetting cycles.

Fig.13.Digital camera image,selected area and the binary image of the selected area of R90-B10 in the as-compacted state and after different wetting cycles.

Fig.14.Digital camera image,selected area and the binary image of the selected area of R80-B20 in the as-compacted state and after different wetting cycles.

Fig.15.Digital camera image,selected area and binary image of the selected area of R70-B30 in the as-compacted state and after different wetting cycles.
It should be noted here that the Thermo Scientific -Pascal Mercury Porosimeter (140,440 series) captures the pore size distribution ranging between 5 nm and 135 μm,and the pore sizes beyond this range remain uncaptured.The slightly higher macropores peak mode of all the red soil-bentonite mixtures during the 5th wetting cycle may be attributed to the redistribution of pore sizes,wherein the pores greater than the 135 μm size in the red soil-bentonite specimens after 1st to 3rd wetting cycles could have been changed into the pores smaller than the 135 μm size after the 5th wetting cycle due to redistribution.
Further,to understand the pore size distribution beyond the 135 μm size,the bottom surface digital camera images and the corresponding binary images of the selected area (4 cm2) of R90-B10,R80-B20 and R70-B30 specimens in the as-compacted state and after different wetting cycles are compared in Figs.13-15,respectively.The images clearly confirm that the size and volume of macropores decreased with the increase in wet-dry cycles and bentonite content.
Fig.16 compares the macropores volume (>4 μm) of R90-B10,R80-B20 and R70-B30 specimens.It can be observed that at all conditions,the macropores volume of the R70-B30 specimen is the least in comparison to the other two specimens.Even though the macropores peak mode of the R80-B20 specimen is lower than that of the R90-B10 specimen in the as-compacted state,the cumulative intruded volume is slightly higher for the R80-B20 specimen in the as-compacted state.However,the macropores volume of the R80-B20 specimen reduced with the expansion of DDL and attained a lower value than the R90-B10 specimen after the 1st and 5th wetting cycles.SEM micrographs captured at the as-compacted state and after the 1st,3rd,and 5th wetting cycles of R80-B20 specimens further corroborate with the MIP test results that the soil fabric was changing with the wet-dry cycles (Fig.17).

Fig.16.Comparison of cumulative intruded macropore volume of R90-B10,R80-B20 and R70-B30 in the as-compacted state and after the 1st and 5th wetting cycles.
4.5.Effect of wet-dry cycles on hydraulic conductivity of red soilbentonite mixtures
Fig.18a,b and c brings out the effects of wet-dry cycles and bentonite content on the hydraulic conductivity of red soil at confining pressures of 20 kPa,50 kPa and 100 kPa,respectively.As brought out earlier,the red soil satisfied all the plasticity characteristics stipulated by the EPAs for the compacted clay liners except for the hydraulic conductivity criterion.The addition of bentonite to the red soil improved the hydraulic conductivity considerably.The R70-B30 specimen exhibited the least hydraulic conductivity among the three red soil-bentonite mixtures due to its higher bentonite content.It is evident from Fig.18 that the hydraulic conductivity increased with the increase in wet-dry cycles for all the red soil-bentonite mixtures except for the negligible variations during the highest swelling cycle (2nd or 3rd cycle).R70-B30 specimen did not follow this trend at a confining pressure of 50 kPa.However,the variations in the hydraulic conductivity with wet-dry cycles were negligible for the R70-B30 specimen.R90-B10 specimen satisfied the hydraulic conductivity criterion ofk<1×10⁻⁷cm/s during the first three wet-dry cycles,and it did not satisfy the criterion at the end of the fourth and equilibrium wet-dry cycles even under the higher confining pressure of 100 kPa.Further,Fig.18 shows that the hydraulic conductivity of all the red soil-bentonite specimens decreased with the increase in confining pressure due to the reduction of macropores size and closure of the existing unhealed shrinkage cracks(if any)that act as the preferential flow paths (Sivakumar et al.,2015).At a confining pressure of 100 kPa,the difference in hydraulic conductivity between R80-B20 and R70-B30 specimens is marginal.
The variation in the hydraulic conductivity of red soil-bentonite mixtures with the increase in wet-dry cycles is attributed to the changes in the pore size distribution with the alternate wet-dry cycles.The R90-B10 specimen was characterized with the highest volume of macropores among the three red soil-bentonite mixtures at the end of all wetting cycles (Figs.9-11,13-16),and thus the hydraulic conductivity of this specimen was greater than the other specimens after each wetting cycle.Romero (2013) also reported that the hydraulic conductivity of compacted soils is dependent on the macropores volume.A slight dip in the hydraulic conductivity after the 3rd wetting cycle (or 2nd wetting cycle in the R70-B30 specimen) can be observed with reference to the value of the previous cycle,during which the maximum swell occurred in the specimens.The hydraulic conductivity of the R90-B10 specimen increased drastically after the third cycle,and the value was greater than the design value of 1×10⁻⁷cm/s due to preferential flow from the unhealed desiccation cracks as the amount of bentonite was insufficient.
5.Preparation of red soil-bentonite mixtures for field application
Currently,two main methods are used for mixing the soil and bentonite to obtain a good-quality bentonite enriched soil(BES)for the field application,i.e.the rotavation method and the batch mixing method (UK EA,2014b).The rotavation mixing method involves the spreading of the red soil uniformly such that it has equal thickness at all places.Then the required amount of bentonite is spread over the layer of red soil.Finally,the bentonite is mixed with the red soil using the rotavators for obtaining the red soilbentonite mixture.Further,for improving the uniformity of the mixture,the bentonite could also be added in stages and mixed using the rotavators.Alternatively,the batch mixing method can also be employed,wherein the red soil and the bentonite are mixed in a mixing vessel for a specific period and transported to the site.The method to be adopted for the field application is site-specific and should be determined based on the testing of mixtures and the cost.
6.Conclusions
The present experimental study evaluates the suitability of an Indian red soil as a compacted clay liner material in terms of its plasticity characteristics and wet-dry durability.The experimental results reveal that even though the selected red soil satisfied the selection criteria based on the index properties for clay liners according to different EPAs,it failed to satisfy the hydraulic conductivity criterion.Hence,the red soil was ameliorated with bentonite in different proportions,i.e.R90-B10,R80-B20 and R70-B30,which met the hydraulic conductivity requirement of liners as well.
Further,LL,PLandPIincreased,andSLdecreased with the increase in the bentonite content.Even though the maximum dry unit weight decreased and the OMC increased with the increase in the bentonite content,the UCS increased linearly with the bentonite content.The addition of bentonite to the red soil increased the micropores volume in the compacted red soilbentonite specimens,which in turn led to the macrostructural hardening during loading and increased the UCS.The decrease in macropores volume with the bentonite content is illustrated with the aid of PSDs of the red soil-bentonite mixtures in the ascompacted state.
To further evaluate the durability of the red soil-bentonite mixtures due to the moisture fluctuations,the compacted red soil-bentonite mixtures were subjected to five alternate cycles of wetting and drying,until the specimens reached the volumetric equilibrium,and the hydraulic conductivity was measured after each wetting cycle.The kaolinitic red soil showed no vertical swelling during wetting cycles,and upon enhancing with the bentonite,the red soil-bentonite mixtures exhibited swell.The swelling results in the closure of the macropores in the specimen or any microcracks formed during the drying cycles,which may otherwise act as the preferential flow paths.All of the red soilbentonite mixtures satisfied the hydraulic conductivity after the first wetting cycle.However,the R90-B10 specimen with the least bentonite content exhibited the least swelling among all the red soil-bentonite mixtures and lost its healing ability when subjected to alternate wet-dry cycles.The R90-B10 specimen failed to satisfy the hydraulic conductivity criterion at the end of five cycles of wetting and drying.
From the present study,R80-B20 and R70-B30 mixtures may be used as suitable liner materials as they satisfy the hydraulic conductivity criterion at the end of wetting cycles.The suitability of the red soil-bentonite mixtures may be further evaluated by subjecting the mixtures to chemical contamination during the wetting cycles.
Declaration of competing interest
The authors declare that they have no known competing financial interests or personal relationships that could have appeared to influence the work reported in this paper.
 Journal of Rock Mechanics and Geotechnical Engineering2024年2期
- Journal of Rock Mechanics and Geotechnical Engineering的其它文章
- Determination of uncertainties of geomechanical parameters of metamorphic rocks using petrographic analyses
- Evaluation of excavation damaged zones (EDZs) in Horonobe Underground Research Laboratory (URL)
- On the calibration of a shear stress criterion for rock joints to represent the full stress-strain profile
- Effect of dynamic loading orientation on fracture properties of surrounding rocks in twin tunnels
- Experimental study on the influences of cutter geometry and material on scraper wear during shield TBM tunnelling in abrasive sandy ground
- Effect of fracture fluid flowback on shale microfractures using CT scanning