
Theoretical characterization of the adsorption configuration of pyrrole on Si(100)surface by x-ray spectroscopy
2024-02-29 09:19HaoQingLi李好情JingMing明静ZhiAngJiang姜志昂HaiBoLi李海波YongMa马勇andXiuNengSong宋秀能
Chinese Physics B 2024年2期
关键词:海波
Hao-Qing Li(李好情), Jing Ming(明静), Zhi-Ang Jiang(姜志昂), Hai-Bo Li(李海波),Yong Ma(马勇), and Xiu-Neng Song(宋秀能)
School of Physics and Electronics,Shandong Normal University,Jinan 250358,China
Keywords: pyrrole,silicon surface,x-ray photoelectron spectroscopy(XPS),near-edge x-ray absorption fine structure(NEXAFS)
1.Introduction
The semiconductor silicon material is the most important semiconductor material.It can be directly or indirectly used in the preparation of semiconductor devices, and plays a significant role in the microelectronic industry.With the development of the microelectronic industry, in addition to the requirements of technology and equipment, it has also put forward newer and higher requirements for semiconductor silicon materials.In order to meet the requirements, researchers have chemically modified the silicon surface,[1]and have synthesized a great many widely used organic functional semiconductors,[2,3]which promotes the development of silicon technology.In the development of silicon materials,the study of the Si(100) surface is one of the most popular fields, and there are many studies on Si(100)surfaces[4–6]because of the complex reactivity of the Si(100) surface.[7]The combination of organic molecules with the silicon surface helps to develop new properties of semiconductors and expand the applied range.[8,9]Through covalent bonding,[10]the semiconductors can have the unique functions of organic molecules.Aromatic molecules are a great choice for adsorbing on the silicon and other surfaces.[11]Its interaction with the silicon surface is complex, which produces various adsorption configurations.[12–14]Pyrrole is a five-element heterocyclic compound containing a nitrogen heteroatom.Its derivatives are widely used as raw materials for organic synthesis and medicine,utilized as a chromatograph to analyze standard material,and also applied to organic synthesis and the pharmaceutical industry.The pyrrole molecules maintain their aromatic properties after binding with the silicon surface,[10,15]helping silicon to be more widely used as an organic semiconductor.Pyrrole molecules are bonded to the silicon surface through the Si–C bonds or the Si–N bonds, forming different adsorption configurations.Different adsorption structures lead to different properties, therefore, it is of much importance to identify these adsorption configurations.
In the field of surface science, infrared, Raman spectroscopy and x-ray spectroscopy can effectively detect the electronic structure of matter.[16–19]In soft x-ray spectroscopies,x-ray photoelectron spectroscopy(XPS)and the nearedge x-ray absorption fine structure(NEXAFS)spectrum are often used to study the interfacial structure of organic molecular surfaces.[20,21]The XPS involves the ionization of electrons in the nuclear orbit,which can be used to detect the surface chemical composition and the chemical state of elements contained therein,[22,23]and to provide information about the nuclear orbit.NEXAFS involves that the nuclear orbital electrons are excited to the unoccupied orbit,which can offer unoccupied orbital information,and conduct the quantitative and qualitative analysis of the elements through the spectrum generated by the electron transition in the inner layer of the element.In this work, we used XPS and NEXAFS spectra to theoretically investigate the structures of pyrrole adsorbed on Si(100), identifying them by the sensitivity of two spectra to these adsorption configurations.The study of pyrrole adsorbed on Si(100)will provide more useful information for the design of new silicon-based devices, which can contribute to the development of semiconductor-based molecular devices and new hybrid materials, and promote the progress of the microelectronics industry.
2.Calculation details
Based on previous experimental and theoretical studies,[10,15,24–26]we predicted 13 possible structures of pyrrole adsorbed on the Si(100) surface, as demonstrated in Fig.1, namely, mode I and mode II (two adjacent carbon atoms of the pyrrole molecule form two strong covalent Si–C bonds with atoms on the silicon dimer),mode III and mode IV(two separated carbon atoms form two strong covalent Si–C bonds with atoms on the silicon dimer),mode V,mode VI,and mode VII(two carbon atoms or a carbon atom and a nitrogen atom in a pyrrole molecule pass through two dimers to form two covalent Si–C bonds or a Si–C bond and a Si–N bond),mode VIII, mode IX, and mode X (four atoms of the pyrrole molecule form four covalent Si–C bonds or the Si–N bond on two adjacent dimers), mode XI, mode XII and mode XIII(on the basis of mode VIII,mode IX and mode X,the pyrrole molecule rotates for 90◦to form four covalent bonds with two adjacent dimers).The silicon clusters used contain 17, 31 and 29 silicon atoms for mode I–mode IV,mode V–mode VII and mode VIII–mode XIII, respectively.The silicon atoms in the silicon dimer are connected to four silicon atoms by four covalent bonds,and the bond lengths are shown in Fig.1.After constructing the model, we optimized the predicted 13 adsorption structures using the B3LYP functional and 6-31G(d, p) basis set in the Gaussian16 package.[27]The XPS and NEXAFS spectra of these adsorption configurations at the C-1s edge were then calculated by the StoBe program[28]with the density functional theory (DFT) method.For the accuracy of the calculations, the gradient corrected Becke(BE88)exchange functional[29]and the Perdew(PD86)correlation functional[30]were utilized to provide precise oscillator strength consistent with the experimental results[31,32]According to the basis set, the IGLO-III (localized orbit) matrix,[33]DZVP(double-ζplus valence polarization)and TZVP(tripleζplus valence polarization) were used to describe the coreexcited carbon atoms, silicon atoms and others, respectively.In order to promote the convergence of the self-consistent field, various auxiliary groups and model nuclear potentials were also applied to the corresponding atoms.Additionally,in the transition dipole moment and transition energy calculation of the nuclear excitation, an extended diffusion group (19s,19p,19d)[34]was added.
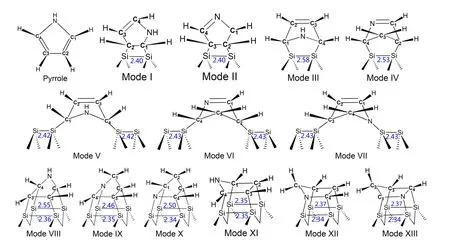
Fig.1.All possible structures of pyrrole adsorbed on the Si(100)surface,and the bond length(˚A)of the Si–Si bond is also marked in the figure.Mode I and mode II are called “tilted” structures, mode III and mode IV are called “butterfly” structures, mode V–mode VII and mode VIII–mode XIII are known as“cross-row-bridge”structures and“tight-bridge”structures,respectively.
We calculated the ionization potential(IP)of the C-1s by means of the ∆Kohn–Sham (∆KS) method,[35,36]which fully considered the relaxation produced by the introduced nuclear pore.The ionization energy is calculated as follows:
where IP stands for the energy difference between the fully optimized core-ionized state and the ground state (GS).We obtained XPS spectra by Gaussian broadening centering on ionization energy.The NEXAFS includes the nuclear excited state (initial state) and the ground state (final state).The final state rule[37,38]shows that an accurate absorption spectrum can be gained by calculating the final state wave function.Furthermore,we calculated the NEXAFS spectra by the the fullcore hole(FCH)approximation method,which approximately takes the core ionization state as a reference state and can display the features of all transitions.By the dipole approximation, we estimated the absorption oscillator strength in thex,y,andzdirections;the formula is
whereψiandψfrepresent the molecular orbits of the initial state i and the final state f in the x-ray absorption,respectively.To obtain the most accurate energy positions of the peaks,we further utilized the ∆KS method to calibrate the spectral peaks,which calculated the transition energy from the 1s orbit to the lowest unoccupied molecular orbit(LUMO):
Then, the transition energy was calibrated by the energy difference between GS and the fully optimized nuclear excited state.Taking into account the relativistic effect, a shift constant of 0.2 was taken into account in the spectral calculation.When calculating the XPS,the resulting IP was convoluted by full width at half maximum(FWHM)of 0.2 eV in a Gaussian function.As for NEXAFS, considering the vibrational interaction fully,a convolution with an FWHM of 0.3 eV was utilized by a Gaussian function in the region below the IP,while the continuous part above IP was convolved by the Stieltjes imaging method.[39]
3.Results and discussion
3.1.Structures
As shown in Fig.1, there are 13 possible configurations of pyrrole molecules bound to a Si(100) surface.mode I–mode IV are pyrrole molecules bound to a silicon dimer with two covalent bonds.Among them, mode I and mode II form[2+2]cycloaddition products,which are called“tilted”structures,while mode III and mode IV form[4+2]cycloaddition products called “butterfly” structures.In mode V–mode VII,the pyrrole molecules are adsorbed on two dimers in a continuous arrangement,which are known as“cross-row-bridge”structures.For mode VIII–mode XIII, the pyrrole molecules form four covalent bonds with two adjacent dimers, called“tight-bridge”structures.
The higher the binding energy of the adsorption configuration,the more stable its structure will be.We calculated the binding energies of the optimized adsorption structures,which is defined as
whereEC4H5Nis the total energy of a single pyrrole molecule,ESiis the energy of the corresponding silicon surface, andEC4H5N/Siis the total energy of the entire adsorption configuration.The binding energies of 13 adsorption structures are demonstrated in Table 1.The calculated binding energies based on Table 1 show that among these adsorption configurations,“cross-row-bridge”structures have higher binding energies than other structures and the structures are the most stable.As for the “tilted” structure, the binding energies of mode I and mode II are similar, but mode I is 0.04 kcal/mol higher than mode II,so mode I is more stable than mode II.Similarly,for the“butterfly”structure, the stability of mode III is better than that of mode IV.As regards the“tight-bridge”structure,mode IX has a higher binding energy and more stable structure.

Table 1.The number of non-equivalent carbon atoms Cnon,as wellas the binding energies of 13 structures at DFT level.
3.2.XPS spectra
According to the number of bonds formed by the combination of pyrrole molecules and the Si(100) surface, the adsorption configurations can be divided into two categories.In mode I–mode VII and mode VIII–mode XIII, the pyrrole molecules form two and four covalent bonds with the silicon surface, respectively, and the C-1s XPS spectra of these 13 adsorption configurations are demonstrated in Fig.2.Table 2 shows the energy values corresponding to the obvious characteristic peaks.As can be seen from the spectrogram,mode III has only one characteristic peak,which can be taken as evidence to distinguish it from other structures.Mode II,mode V, mode VIII, and mode XI have two characteristic peaks.Among them, the energy interval between peakaand peakbin mode II is larger, about 1.3 eV, while the energy interval between the two peaks in the other three modes is relatively small.The spectral features of the mode V,mode VIII,and mode XI peaks are similar, so that the three structures cannot be precisely identified.In the XPS spectra, mode IV,mode VI, mode VII, mode IX, mode X, and mode XIII have three spectral features.Specifically,in mode IV,the strength of the characteristic peakbis greater than peakaand peakc,and the energy intervals between the three peaks are 0.8 eV and 1.2 eV, respectively.For mode VI and mode IX, the strength of peakais greater than peakband peakc,and the strength of peakband peakcis identical.But the peakaof mode VI has a wider energy range,at about 288.6 eV–288.8 eV.The intensity of the mode VII peakcis greater than that of peaksaandb,and the energy range of peakcis about 289.5 eV–289.7 eV.As for mode X and mode XIII,both the spectral outlines and the energy positions of the peaks are similar.For the spectra of mode I and mode XII,there are four obvious characteristic peaks.In mode I,peakband peakcshow a shoulder characteristic,and peakaand peakdhave almost the same intensity.As for mode XII,peakaand peakbshow a shoulder characteristic,and the intensity of peakcis the same as that of peakd.By the XPS spectra,we cannot fully identify the structures of pyrrole adsorbed on the Si(100)surface,so NEXAFS spectra are needed for further identification.

Table 2.Energy values (eV) of the characteristic peaks of configurations of pyrrole adsorbed on the Si(100) surface in the XPS spectra.
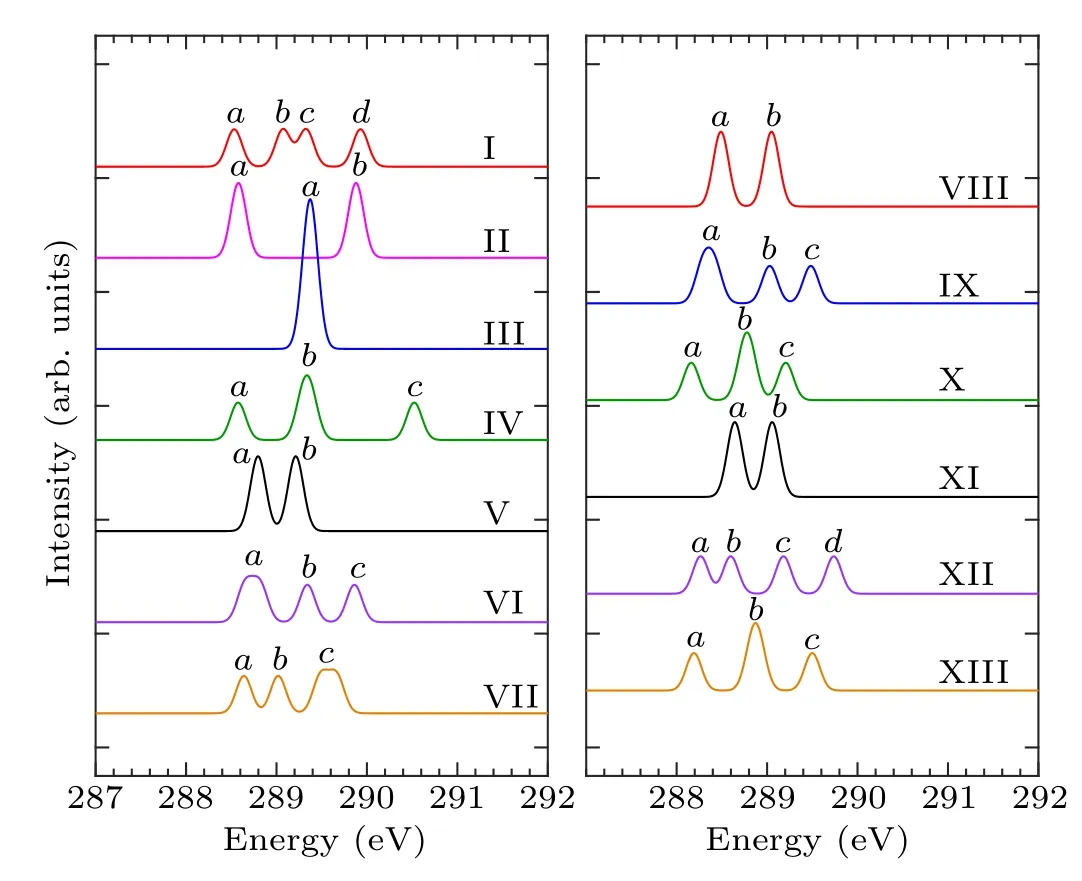
Fig.2.Calculated C-1s XPS spectra of the configurations of pyrrole adsorbed on the Si(100)surface and the major features are labeled.
3.3.NEXAFS spectra
In order to identify these adsorption structures more precisely, we simulated the NEXAFS spectra of these 13 structures.According to the number of binding bonds, the NEXAFS spectra of these adsorption configurations are demonstrated in Fig.3.The NEXAFS spectrum reflects the spectral distribution and the energy positions of the characteristic peaks, and Table 3 shows the specific energy values of the main characteristic peaks in the spectrum.For the “tilted”structure (mode I and mode II), there are four characteristic peaks in the spectrum of mode I.A weak shoulder peakcarises at about 285.9 eV on the right of peakband the energy interval between peakcand peakdis about 2.3 eV.In mode II,there is a distinct characteristic peakb,at about 285.9 eV,and its intensity is significantly greater than the other peaks,which helps to distinguish the two configurations.As for the “butterfly” structure (mode III and mode IV), the intensity of the four characteristic peaks of mode III decreases in turn, while in mode IV, the strength of peakbis greater than peakaandpeakc, but the strength of peakaand peakbis not considerably different, which can serve as strong evidence that distinguishes the two structures by the C-1s NEXAFS spectra.With regard to the“cross-row-bridge”structure(mode V–mode VII), peakaand peakb, peakcand peakdshow the shoulder features,and the spectral intensities of peaksa,bare stronger than that of peaksc,din mode V.Both in the spectra of mode VI and mode VII,peakbis a weak shoulder peak on the left of peakc, and the strength of peakain mode VI is greater than the other two peaks,whereas in mode VII,the opposite is true.These spectral features of mode V–mode VII can be taken as evidence to distinguish them from other adsorption structures.With respect to the“tight-bridge”structure(mode VIII–mode XIII), both mode IX and mode XII have a distinct characteristic peak,where peakaof mode IX and peakcof mode XII are at about 284.7 eV and 289.1 eV respectively and mode XII has other peaks.In the spectra of mode VIII,mode X and mode XIII, peakaand peakbshow a shoulder feature.In mode VIII and mode X, peakais a weak shoulder on the left of peakb.But the intensity of peakaand peakbof mode XIII is almost the same, larger than that of peakc.In the spectrum of mode XI,peakahas the greatest intensity with a position around 283.8 eV.The above discussion can help to distinguish the“tight-bridge”adsorption structures.By the NEXAFS spectroscopy,the studied adsorption systems can be distinguished from each other,that is to say,the 13 possible adsorption structures have different NEXAFS spectra.
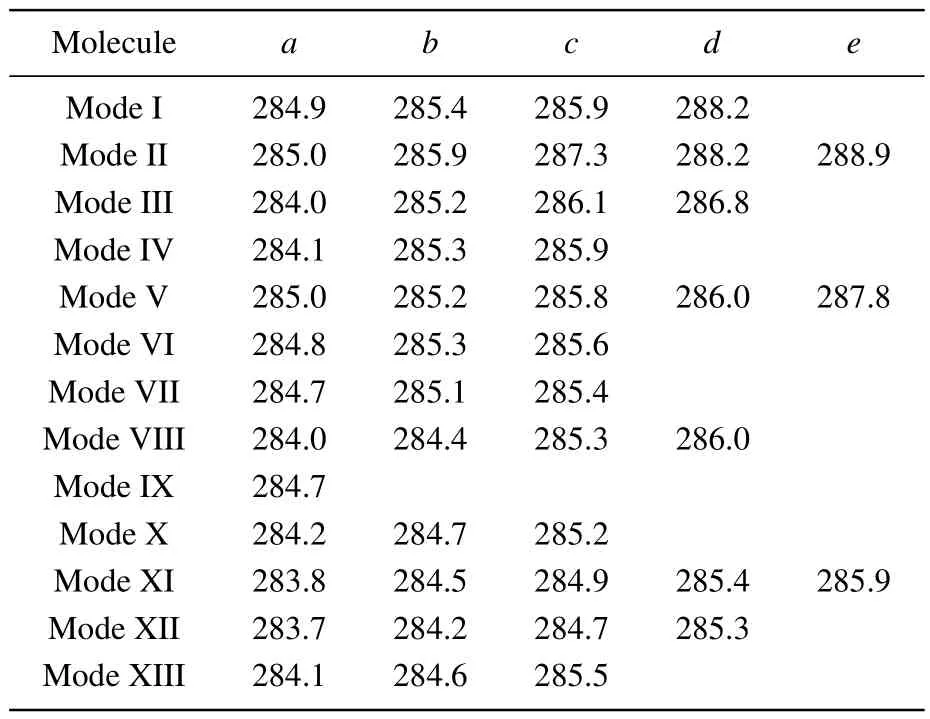
Table 3.Energy values (eV) of characteristic peaks in the NEXAFS spectra for the absorption configurations.
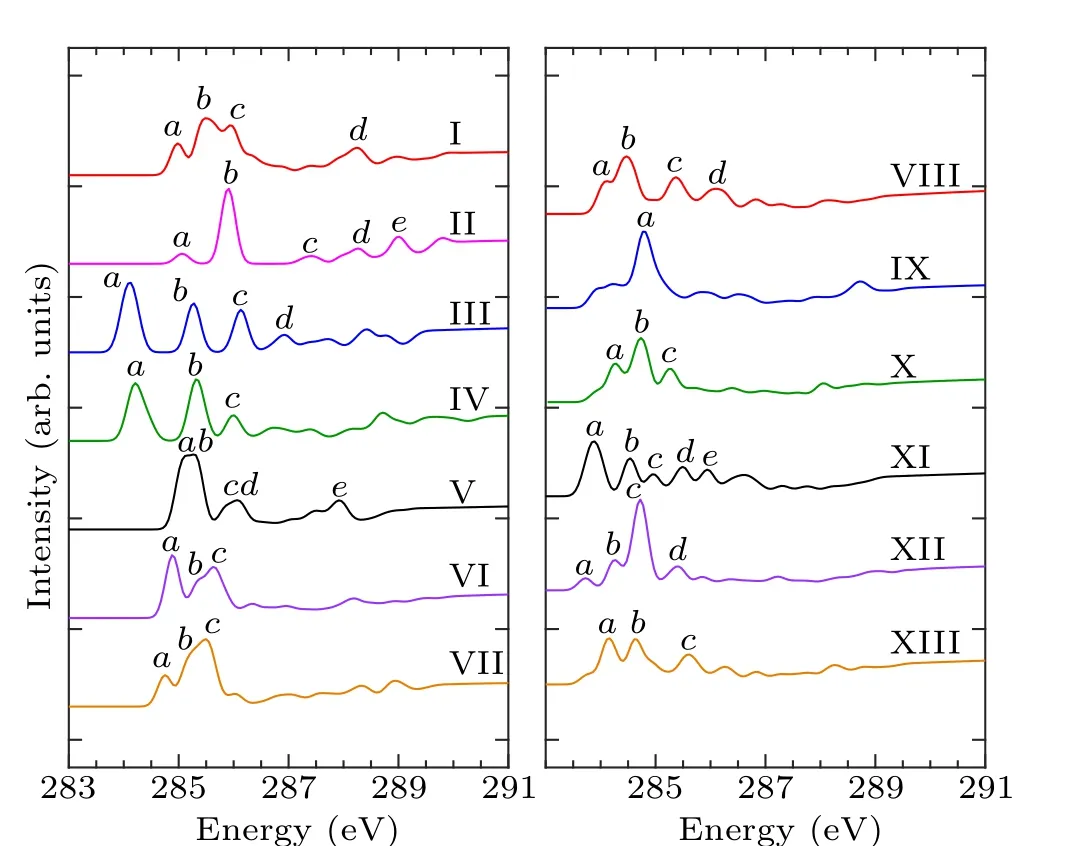
Fig.3.Calculated C-1s NEXAFS spectra of the configurations of pyrrole adsorbed on the Si(100)surface and the major features are labeled.
Figures 4–6 show the C-1s NEXAFS spectra of the 13 configurations for pyrrole adsorbed on the surface of Si(100),and the spectral composition of the non-equivalent carbon atoms in various local environments.As shown in mode I of Fig.4, featureaoriginates from C2, featurebderives from C1, C3, and featurecis generated by C4.The featurebof mode II is from C1.The C1 and C2 of mode III contribute to featurea,and featureband featurecare generated by C2 and C1,respectively.The C2,C3,and C4 of mode IV contribute to featurea,and featurebis generated by C1 and C2.In Fig.5(a),featureaand featurebare from C2 and C1, respectively.In both mode VI and mode VII,C1 contributes to featurec,while featureain mode VI is generated by C2 and C3.As shown in Fig.6,in mode VIII,C1 contributes to featureb.Featureaof mode IX and featurecof mode XII both originated from C1 and C4.Featurebof mode X is generated by C3 and C4,and featureaof mode XI is generated by C1 and C2.In mode XIII,featureaand featurebare from C2 and C4, respectively.By analyzing the contribution of the decomposed spectra of the 13 adsorption configurations to the total spectra,we found that the carbon atoms non-binding to silicon atoms contribute more to the main characteristic peaks in the absorption spectra.In the absorption spectrum of mode II,the spectrum generated by C1 non-binding to the silicon atom has a similar profile to the total spectrum.While for the other adsorption models,except mode VIII and mode XI,the four carbon atoms in them exhibit more detailed spectral differences.Compared with the spectra of the “tight-bridge” structures (modes VIII–XIII), the other structures have more concise spectral profiles,but the characteristics of these spectra all show a clear dependence of the NEXAFS spectra on the environment of carbon atoms.
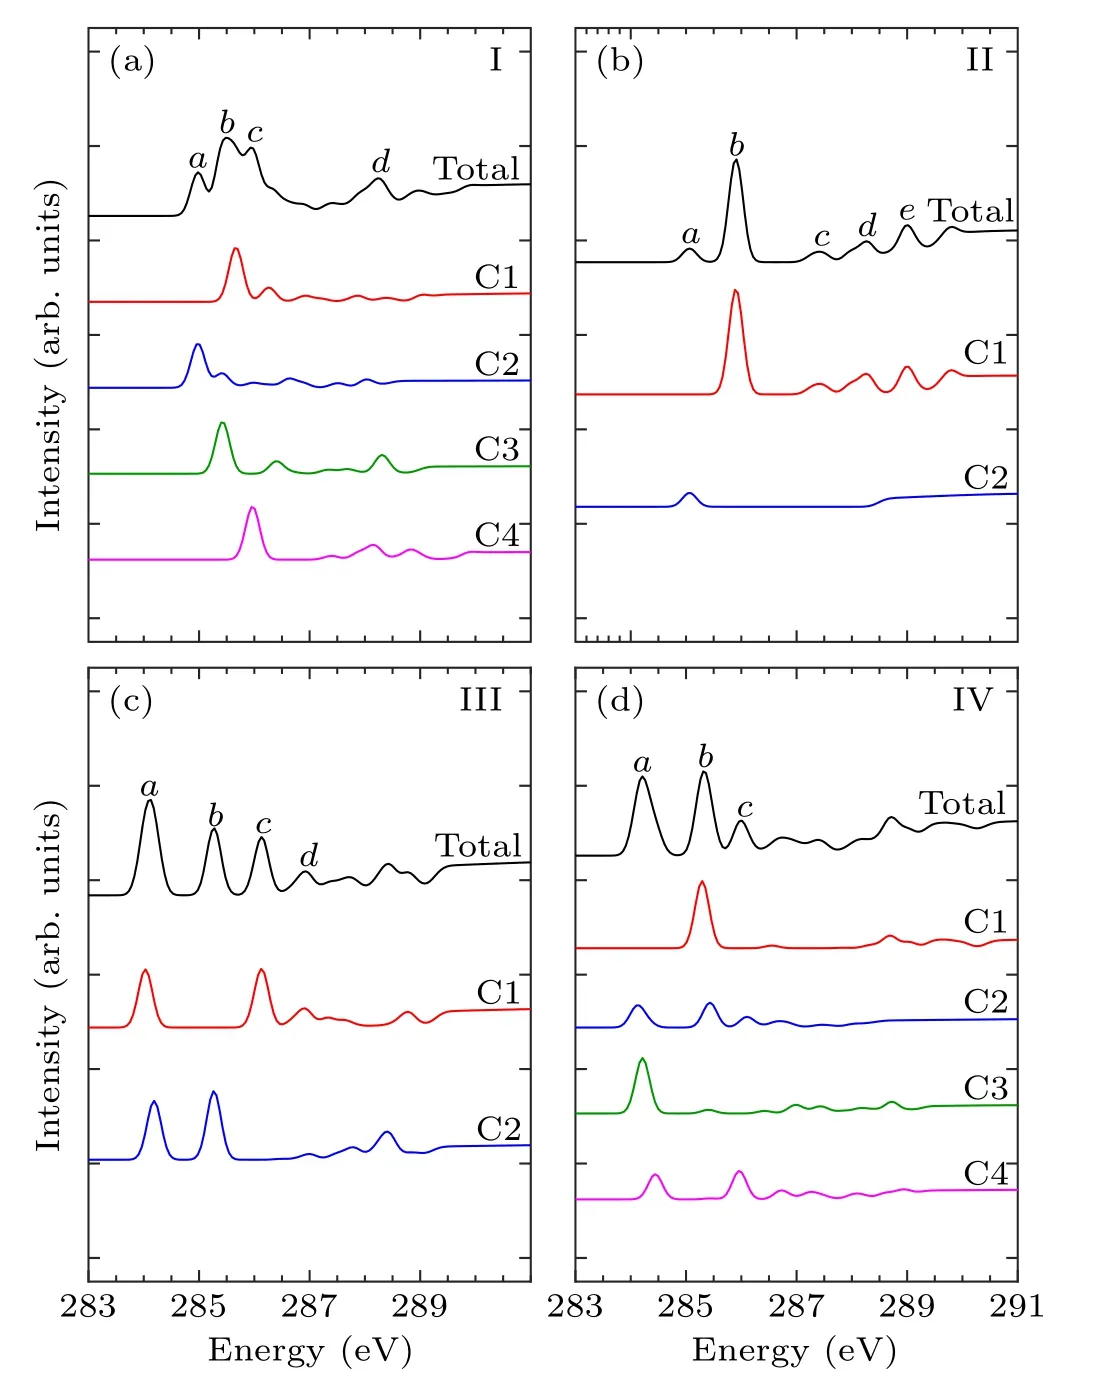
Fig.4.Calculated C-1s NEXAFS spectra of the “tilted” structures(mode I and mode II) and the “butterfly” structures (mode III and mode IV) of pyrrole on the Si(100) surface and their decompositions based on symmetry-independent carbons.
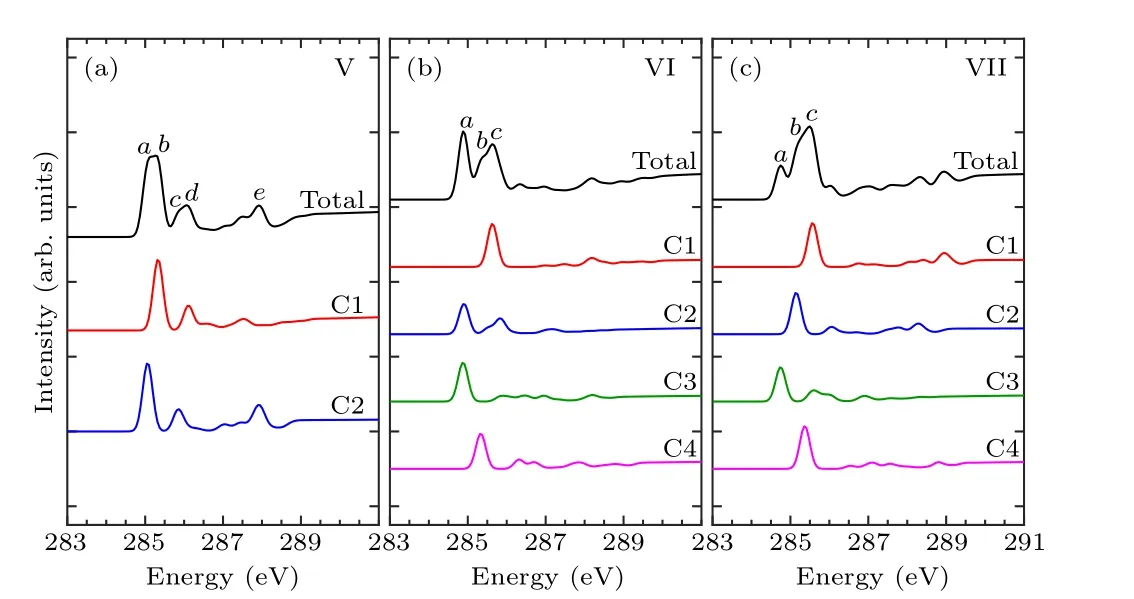
Fig.5.Calculated C-1s NEXAFS spectra of the“cross-row-bridge”structures(mode V–mode VII)of pyrrole on the Si(100)surface and their decompositions based on symmetry-independent carbons.
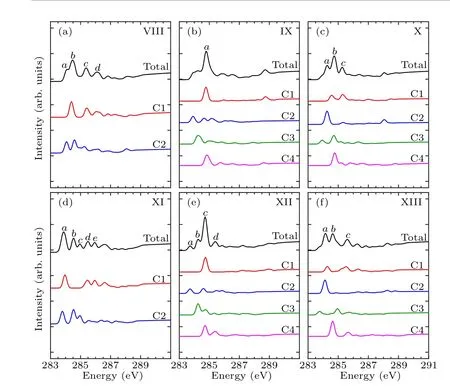
Fig.6.Calculated C-1s NEXAFS spectra of the“tight-bridge”structures(mode VIII–mode XIII) of pyrrole on the Si(100) surface and their decompositions based on symmetry-independent carbons.
4.Conclusion
We constructed 13 adsorption systems of pyrrole absorbed on a Si(100)surface,and calculated their x-ray photoelectron spectroscopy (XPS) and near-edge x-ray absorption fine structure (NEXAFS) spectra by density functional theory (DFT) and clusters.Based on the calculation results of the binding energy, several adsorption configurations of the“cross-row-bridge”structure have higher binding energies and more stable structures.The XPS spectra cannot fully distinguish the 13 adsorption structures;nevertheless,the NEXAFS spectra are highly structure-dependent and more sensitive to these adsorption configurations,which can accurately identify these adsorption systems.For the NEXAFS decomposition spectra produced by non-equivalent carbon atoms, we found that the main source of the spectral features is the type of carbon atoms and their structural environment.
Acknowledgment
Project supported by the Shandong Provincial Natural Science Foundation, China (Grant Nos.ZR2022MA025 and ZR2020MA077).
猜你喜欢
科教新报(2023年25期)2023-07-10
科教新报(2023年22期)2023-06-26
新农村(浙江)(2022年3期)2022-03-22
科教新报(2020年2期)2020-02-14
应用数学(2019年4期)2019-10-16
河北书画研究(2019年1期)2019-09-25
小溪流(画刊)(2017年9期)2017-10-12
小溪流(画刊)(2016年11期)2017-01-05
新农村(浙江)(2016年11期)2016-12-28

- Chinese Physics B的其它文章
- Unconventional photon blockade in the two-photon Jaynes–Cummings model with two-frequency cavity drivings and atom driving
- Effective dynamics for a spin-1/2 particle constrained to a curved layer with inhomogeneous thickness
- Genuine entanglement under squeezed generalized amplitude damping channels with memory
- Quantum algorithm for minimum dominating set problem with circuit design
- Protected simultaneous quantum remote state preparation scheme by weak and reversal measurements in noisy environments
- Gray code based gradient-free optimization algorithm for parameterized quantum circuit