
Numerical simulation for the initial state of avalanche in polydisperse particle systems
2024-02-29 09:17RenHan韩韧TingLi李亭ZhipengChi迟志鹏HuiYang杨晖andRanLi李然
Chinese Physics B 2024年2期
关键词:李然
Ren Han(韩韧), Ting Li(李亭), Zhipeng Chi(迟志鹏), Hui Yang(杨晖), and Ran Li(李然)
School of Optical-Electrical and Computer Engineering,University of Shanghai for Science and Technology,Shanghai 200093,China
Keywords: avalanche,initial state,polydisperse particle systems,propagation
1.Introduction
The moving particles go through constant compaction and rearrangement to complete a collapse, which is also known as an avalanche.In each avalanche, there is an initial state, which refers to the interval that begins with the presence of particle motion and ends when the number of moving particles reaches a steady state.The existing works have made much progresses in the initial state of the monodisperse particle system.Whereas in natural disasters and industrial production,[1,2]avalanches of polydisperse particle systems are common phenomena,and the exploration of the initial state in polydisperse particle systems is still an open issue.
Some research has been conducted on the initial state of particle systems.[3,4]Various factors such as coordination number,velocity,and volume fraction have been examined in existing works.[5,6]In the monodisperse collapse system, the transition process from the initial state to the steady state has been studied.[6]One finding is noted that in the initial state the volume fractions of the passive layer at different depths are distinct, and local volume fractions are also various.Examining the characteristics of nucleation points and propagation velocity in a monodisperse particle system,Hanet al.[7]found that the probability of nucleation points appearing at any point on the surface of the drum is the same.They also established a relationship where the upward propagation velocity is twice as much as the downward propagation velocity.But the propagation characteristics in polydisperse particle systems are not achieved.Chenet al.[8]measured the volume fraction and particle temperature of irregular glass sand particles in a sinking state.Xiaoet al.[9]quantified the performance of mixed particles in terms of time and investigated the effect of the active layer area in the rotating drum.Additionally, Yuet al.[10]investigated the flow behavior of polydisperse particles by analyzing particle velocity,residence time,mixing,and axial dispersion in different regions within the drum.
Discrete element method (DEM) simulation and physical experiments are two main methods to investigate the initial state.Baselet al.[11]used DEM to evaluate the mixing of polydisperse particles in the drum and concluded that the segregation effect decreased with increasing polydispersity.Sylvainet al.[12]conducted experimental measurements on the instantaneous velocity of the active layer during an avalanche and found that velocity predictions in depth and width are similar in unstable avalanches.Liet al.[13]used synchronous speckle visibility spectroscopy to analyze avalanche characteristics and discovered that the stable flow time of particle avalanches follows a normal distribution.
In this paper, we use DEM simulation to investigate the initial state of avalanche in particle systems.By comparing the monodisperse particle system, we explore the distinctive characteristics exhibited by polydisperse particle systems in the initial state.The paper is organized as follows.In Section 2,we introduce the simulation system design and parameter settings.In Section 3,the nucleation and propagation are demonstrated in monodisperse and polydisperse particle systems.The characteristics of avalanche propagation and moving particles in the initial state are discussed.Finally,the conclusion is shown in Section 4.
2.Simulation method and parameters
In this paper, DEM is used to simulate periodic avalanches of particles in a low-speed rotating drum (usually the Froude number(Fr)is between 10-5and 10-3,Fr=ω2R/g).[14]In order to investigate the characteristics of the particles under the slumping regime, a soft-ball discrete element model is used with Hertz–Mindlin non-sliding contact forces.Particles’translation and rotation can be described by the Newton’s second law of motion.[15]The interaction forces between particles, drum walls, and free surfaces[16]are also considered.For two particlesiandj, their interaction can be represented by the following equations:
whereuiandωirepresent the translational and angular velocity of particleirespectively;mirepresents the particle mass,Iirepresents the moment of inertia of the particle,andGirepresents the particle gravity.The forces between particlesiandjinvolved are normal contact forceFcn,i jand tangential contact forceFdn,i j,the damping forcesFct,i jandFdt,i j.The torque of two particles is caused by two components, the tangential forceTt,ijand the rolling frictionTr,i j.[17]
2.1.Simulation system design
Two polydisperse particle systems are considered.A tridisperse particle system consists of particles with three different sizes and a pentadisperse particle system consists of particles with five different sizes.As a comparison,we also consider a monodisperse particle system.[18–20]
Figure 1 shows the polydisperse simulation systems used in the experiment.Figure 1(a) is the tridisperse particle system,and Fig.1(b)is the pentadisperse particle system.Thexaxis represents the axial direction and they-axis represents the radial direction.The experimental settings for the three particle systems are identical,except that they are filled with particles of different sizes.The parameters of the simulations are shown in Table 1.The simulation process is conducted in three phases.(i)Particles are filled into the drum.In this phase,the number of particles of different sizes follows a normal distribution.(ii) Particles are settled to the bottom naturally.In this phase, the particles are randomly distributed.(iii) Drum rotates at a fixed speed.In this phase, periodic avalanches of particles occur in the rotating drum.For a polydisperse particle system,with similar particle sizes,during a short period of time after the drum begins to rotate,the particles are still randomly distributed and involved in periodic avalanches.So we select the experimental data from the first 200 s.Every 0.1 s,experimental data are recorded such as particle ID, velocity,coordination number,position,etc.
We have conducted some experiments before preparing this paper.Our previous work[7]has reported that by comparing with the physical experiments, the simulation system can effectively model the periodic avalanches in a rotation drum,which provides a reliable basis for the experimental system in this paper.
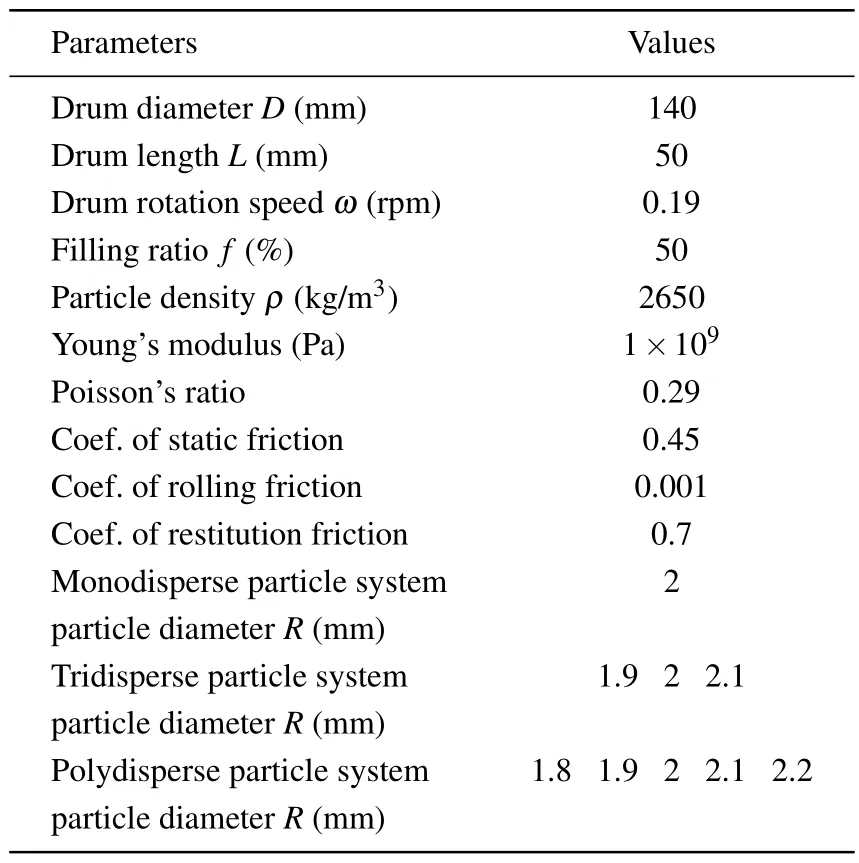
Table 1.Parameters used in DEM simulation.
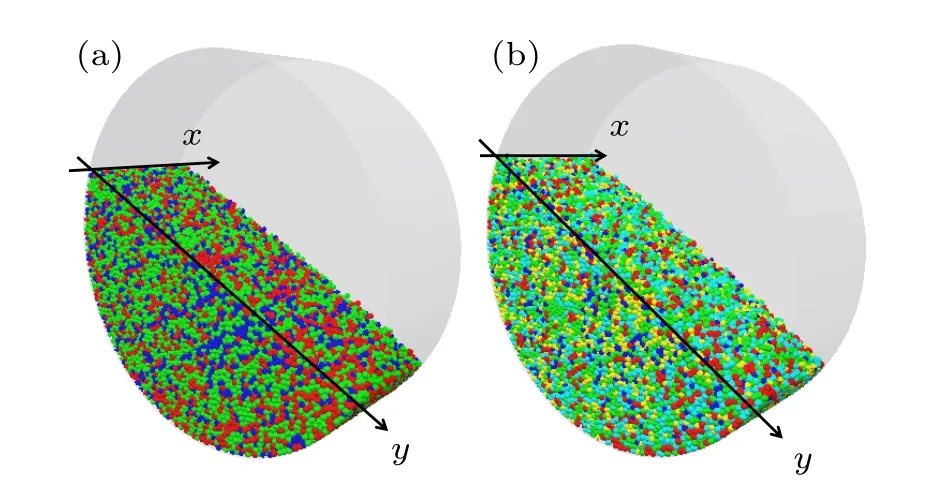
Fig.1.The 3D model for the simulation of particles.The x-axis represents the axial direction,the y-axis represents the radial direction,and the drum rotates in a clockwise direction.(a)Tridisperse particle system: the drum is filled with particles of three different sizes, and we mark these particles by using three different colors.(b) Pentadisperse particle system: the drum is filled with particles of five different sizes,and we mark these particles by using five different colors.
2.2.Parameters of the simulation system
In this experiment, we investigate three particle systems and compare a monodisperse particle system with two polydisperse particle systems.For most particle systems,their particle sizes are not uniform and there are size deviations.In industry,errors can also occur when producing particles with a uniform size,which often follow a normal distribution.The particle size difference is also very small in the investigated polydisperse particle systems.[21]In order to obtain better experimental results, we set up several particles with similar sizes in the polydisperse particle systems.The number of particles of different radii follows a normal distribution.In the tridisperse particle system,the radii of particles are set to 0.95 mm,1 mm, 1.05 mm, and the ratio of the number of corresponding particles is 0.243:0.514:0.243.In the pentadisperse particle system, the radii of particles are set to 0.9 mm, 0.95 mm,1 mm, 1.05 mm,1.1 mm,and the ratio of the number of corresponding particles is 0.112:0.236:0.304:0.236:0.112.In the monodisperse particle system,the particles have the same radius of 1 mm.[22]
The experimental device and particles are made of dry and non-cohesive glass.The reliability of this model has been confirmed in our existing works.[10]For the three particle systems, the filling ratios of the drum are all 50%.The specific simulation parameters are shown in Table 1.
A 32-core Intel Xeon,a memory with a capacity of 32 GB and a GPU with a capacity of 16 GB are used for the simulation.The time step is set to 3×10⁻⁷s, and 120 cycles of continuous avalanches are simulated with a total time of 150 h.
3.Experimental results
3.1.Nucleation and propagation
Three particle systems are considered in the experiments,which contain particles with uniform size,three different sizes,and five different sizes, respectively.In each experiment, the particles are evenly distributed and accumulated at the bottom of the drum.As the drum rotates at a fixed speed, the particles inside the drum are involved in periodic avalanches.The avalanche scale and particle motion are recorded from the first stable avalanche period.As a result, we want to explore the distinctions in particle avalanche characteristics among different particle systems.
Figure 2 depicts avalanches occurring on the surface layers of the three particle systems in the first 0.6 s.The coordinate system of the surface layer is consistent with that represented in Fig.1.It can be seen that there exist the nucleation and propagation phenomena in all three particle systems.Nucleation in this paper refers to the initial transition of a few particles from a static state to a moving state on the surface of the particle bed,disrupting the stable state of the surrounding particles.Propagation is the process by which particles in a moving state repeatedly perturb other particles, causing them to enter a moving state(marked in blue in Fig.2).As a result,the unstable area continuously grows all around.The moving particle that leads to the propagation is considered as nucleation point.In this paper,the selected nucleation points(marked in red in Fig.2)are the first nucleation points in every avalanche period, as avalanches are initiated by the appearance of the first nucleation point.We determine the nucleation points by setting a threshold on the velocity of the moving particles.We believe that the occurrence of an avalanche begins with a nucleation point.Nucleation and propagation process results in an increasing range of local avalanches until the majority of particles in the surface layer are involved in these avalanches.For each particle system, the number of particles involved in the avalanche continues to increase during the first 0.6 s,while it hardly changes after 0.6 s.Therefore, the first 0.6 s can be considered as the initial state of the avalanche.However,there are distinct characteristics of moving particles growth among the three particle systems.In the case of the monodisperse particle system, nucleation and propagation contribute to a consistent and steady number growth of moving particles in the initial state.Conversely,the tridisperse and pentadisperse particle systems exhibit a slow growth in the number of particles involved in avalanches from 0.1 s to 0.4 s,followed by an explosive growth from 0.4 s to 0.6 s.Thus, the pentadisperse particle system exhibits more vigorous propagation in its initial state compared to the tridisperse particle system.
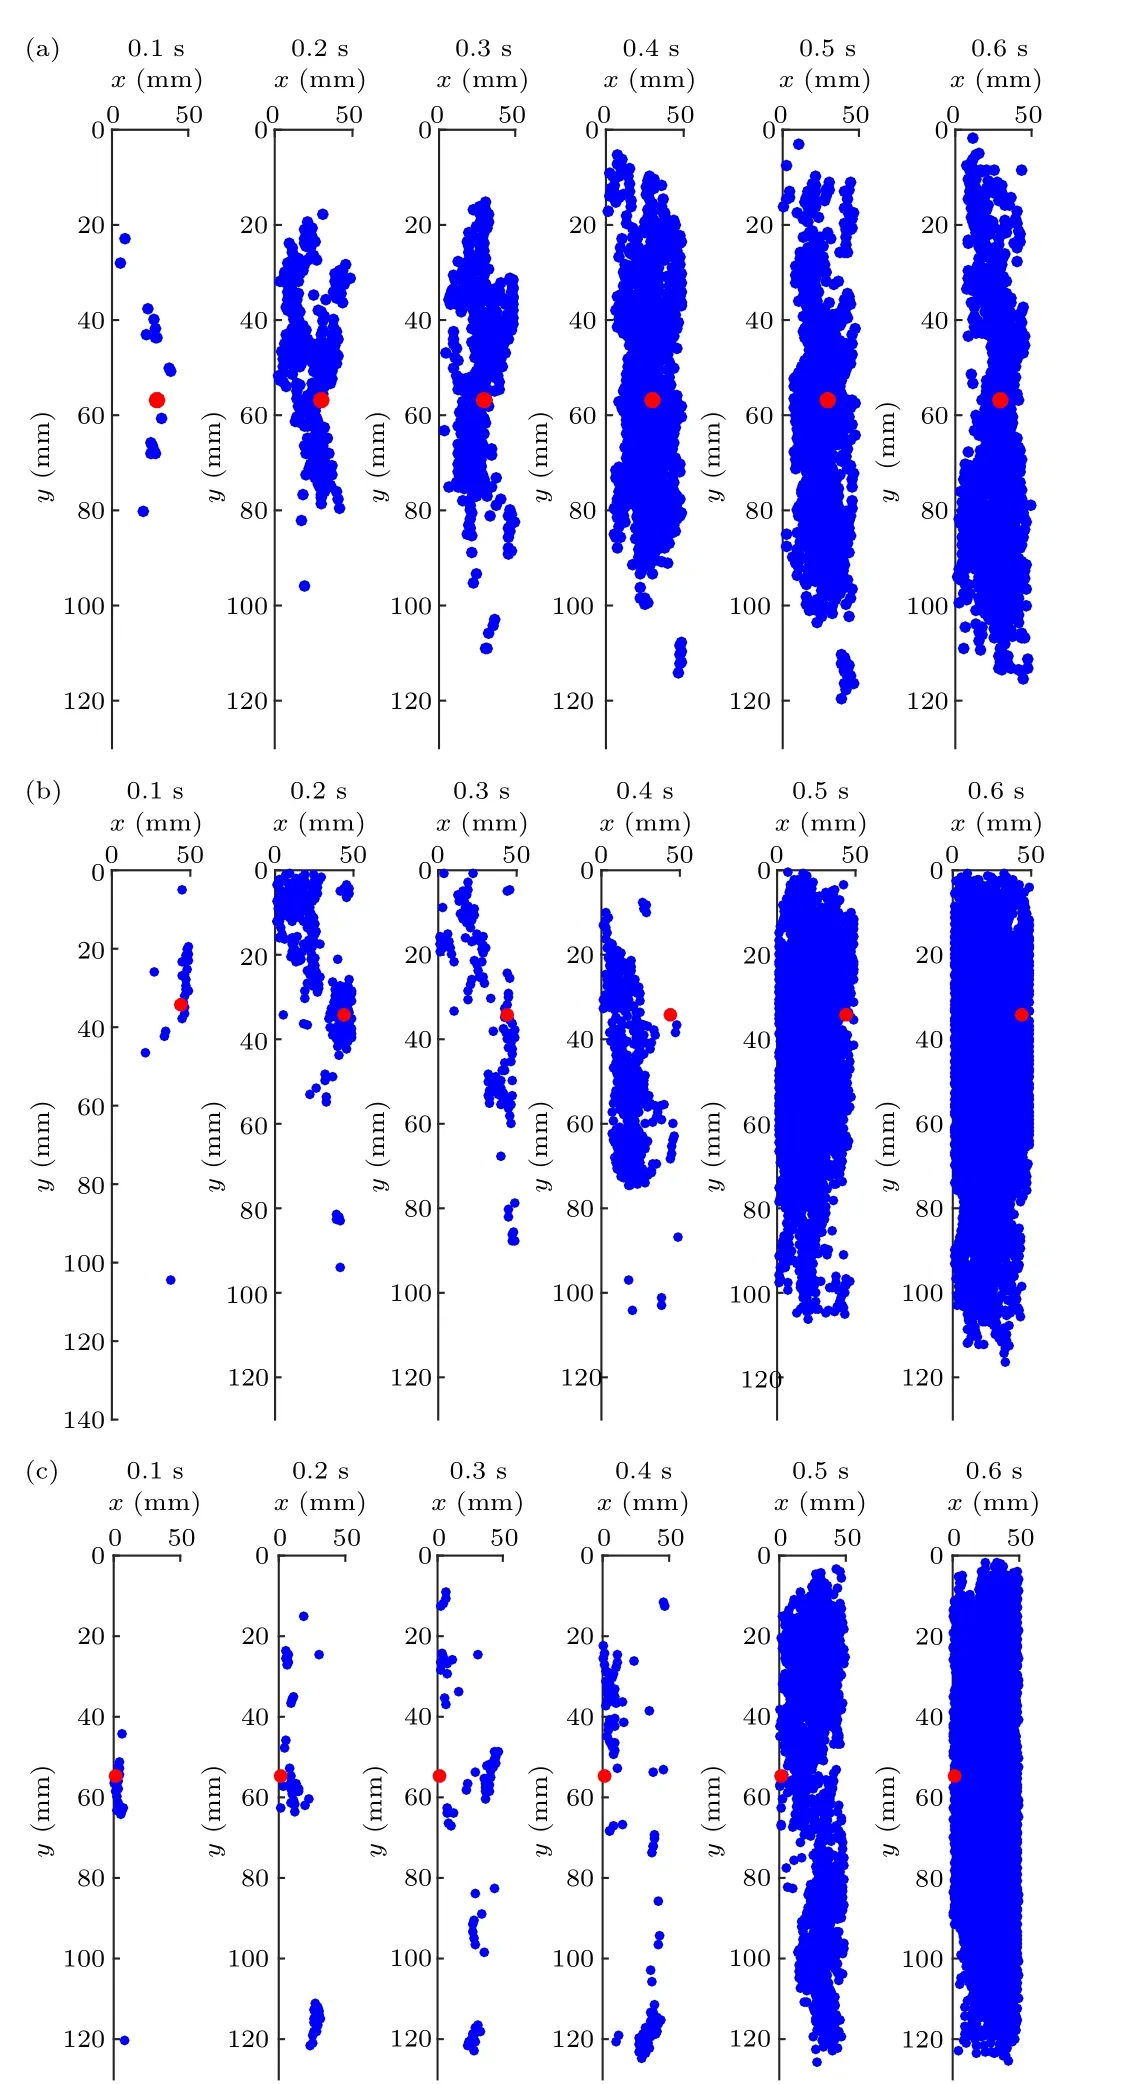
Fig.2.Nucleation and propagation(nucleation point is marked in red,and the particles involved in the avalanche are marked in blue).(a)Monodisperse particle system.(b) Tridisperse particle system.(c) Pentadisperse particle system.
For each particle system, the average number of moving particles is counted at each time slot in the initial state of thirty avalanches.To better reflect the changing trend of particles involved in the avalanche,a fitting formula is accepted as follows:
whereNrepresents the number of particles involved in avalanches,trepresents time, anda,bandcin Eq.(3) are all fitting parameters and they take different values in the three particle systems which are shown in Table 2.The curves generated by the formula are also illustrated in Fig.3.The number of particles involved in the avalanche displays a growing trend in all three particle systems,which can be seen in Fig.3.However,in the monodisperse particle system,the number of particles involved in the avalanche is always larger than those in the polydisperse particle systems from 0 s to 0.4 s.Conversely,from 0.4 s to 0.6 s,the number of particles involved in the avalanche in the monodisperse particle system is smaller than those in the polydisperse particle systems.Furthermore,it is noted that the number of moving particles is higher in the tridisperse particle system than that in the pentadisperse particle system from 0 s to 0.4 s, while from 0.4 s to 0.6 s, the former is lower than the latter.
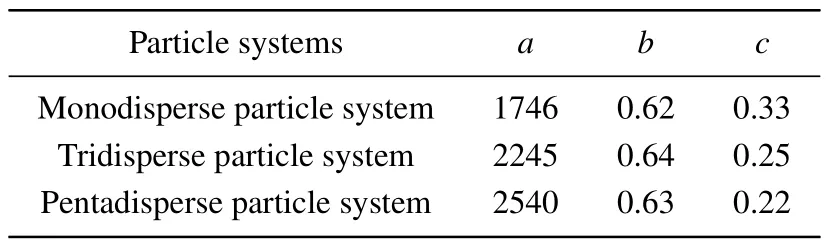
Table 2.Values of a,b and c in the three particle systems.

Fig.3.Variation of the number of particles involved in avalanches in the initial state for three particle systems.The blue curve indicates the monodisperse particle system, the green curve indicates the tridisperse particle system and the purple curve indicates the pentadisperse particle system.
For the above findings,one possible explanation is that at 0.1 s–0.4 s, the particles in the monodisperse particle system are loosely packed,resulting in a uniform increase in the number of particles involved in the avalanche.On the other hand,the polydisperse particle systems at 0.1 s–0.4 s display more stability, with fewer particles involved in the avalanche.Interestingly, the polydisperse particle systems are more stable than the monodisperse particle system at 0.1 s–0.4 s, but become looser and more violent than the monodisperse particle system at 0.4 s–0.6 s.Based on these findings, we can conclude that as the dispersion of the particle system increases,the scale of the avalanche will also expand in the initial state.
3.2.Three stages of the initial state
This section focuses on the avalanche scale in the initial state.We first consider the avalanche propagating scale in the surface layer.As can be observed in Fig.2, for the three particle systems, the avalanche propagates along thexaxis and they-axis in the surface layer.It is important to note that the avalanche propagates to the farthest distance along they-axis within 0.4 s.To elaborate on this phenomenon, a schema Fig.4(a)is given.The nucleation point appears within 0.1 s,the avalanche near the nucleation point starts propagating along they-axis at 0.2 s, the avalanche propagation continues at 0.3 s, and the avalanche arrives at the farthest distance along they-axis direction at 0.4 s.In each time interval,the farthest distance reached by moving particles is called the propagation front.[1]However, it is also clear from Fig.2 that propagation is going and the number of moving particles keeps rising after 0.4 s.Especially in polydisperse particle systems,the increase in the number of such particles is more drastic.Therefore,the avalanche scale can be further expressed in terms of the number of moving particles.
We examine the tridisperse particle system as the instance.Figure 4(b)shows the change in the number of moving particles in the initial state.Before 0.4 s,the number of moving particles is relatively small and growing slowly.However,after 0.4 s,the number of moving particles abruptly increases and the avalanche grows dramatically to cover the entire surface layer.Consequently, 0.4 s can be considered as a critical point for exploring the avalanche scale.To gain a better understanding of the change in avalanche scale in the initial state, we investigate the slope of the number growth of moving particles which is shown in Fig.5 is obtained by fitting the resulting values,which are derived from Eq.(3).
As shown in Fig.5,it is clear that 0.4 s serves as a turning point in the initial state.The growth slope continues to rise until 0.4 s,while it decreases and ultimately reaches zero after 0.4 s.As mentioned above,the avalanche propagation and the number of moving particles before 0.4 s also exhibit different properties compared to those after 0.4 s.Consequently, 0.4 s can be considered the boundary between the different stages in the initial state.It is important to note that the nucleation point appears before 0.1 s, which marks the beginning of the avalanche.Consequently, the initial state of the avalanche is divided into three distinct stages illustrated in Fig.4(b).T1 stage (0 s–0.1 s) represents the nucleation stage.T2 stage(0.1 s–0.4 s) represents the propagation stage, the avalanche propagates the farthest distance along they-axis, the number of particles involved in the avalanche grows slowly, but the growth slope increases continually.T3 stage(0.4 s–0.6 s)represents the overall avalanche stage,the number of particles involved in the avalanche grows dramatically, but the growth slope decreases continually.
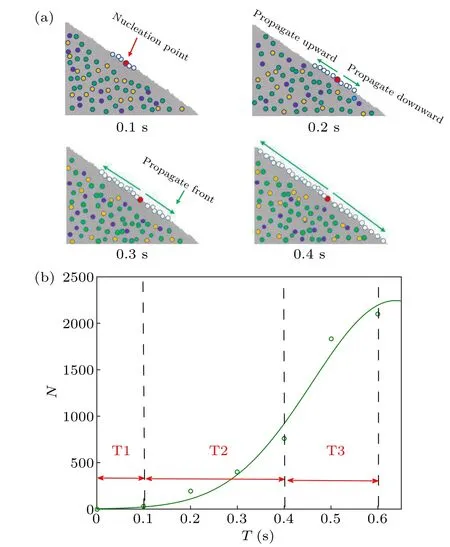
Fig.4.(a) Side views of particle bed along the x-axis direction.They illustrate the nucleation and propagation in the surface layer of the tridisperse particle system.Different particle sizes are represented by various colors,red point indicates the nucleation point and white points indicate particles participating in the avalanche.At each time interval, the farthest distance reached by the green arrow refers to the propagation front.(b) According to the change in the number of particles involved in the avalanche, the initial state can be divided into three stages: T1 for 0 s–0.1 s,T2 for 0.1 s–0.4 s,and T3 for 0.4 s–0.6 s.
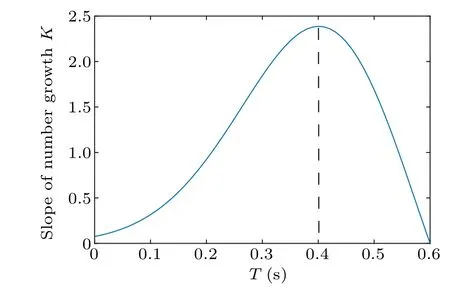
Fig.5.Slope of number growth of moving particle in the initial state.The slope increases from 0 s to 0.4 s,followed by a decrease from 0.4 s to 0.6 s.
3.3.Characteristics of avalanche propagation in the three particle systems
When the nucleation point appears, the propagation occurs.In this subsection, we identify the avalanche propagations along four directions in the surface layer.The directions can be defined by the coordinate system illustrated in Figs.1(a)and 1(b).The upward and downward directions correspond to the negative and positive directions of they-axis,respectively.The rightward and leftward directions correspond to the positive and negative directions of thex-axis, respectively.By observing Fig.2, we notice that the characteristics of avalanche propagation in the polydisperse particle systems are different from those in the monodisperse particle system in the T2 stage(0.1 s–0.4 s).We consider the nucleation point as the start point of the avalanche propagation.For each direction, the propagation distance is defined as the distance from the propagation front to the nucleation point along this direction.
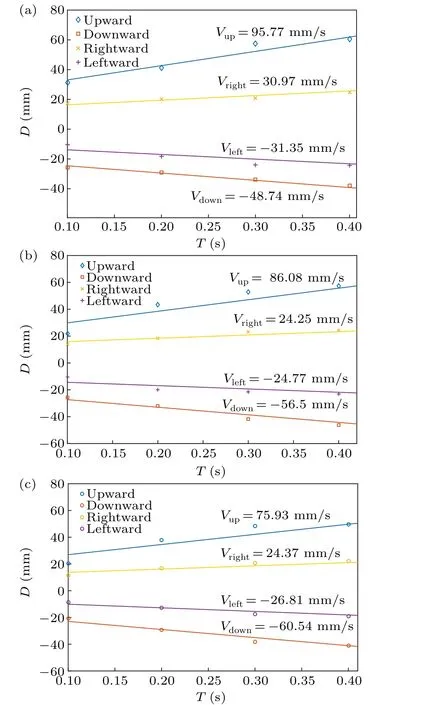
Fig.6.Propagation distances of the three particle systems in the T2 stage.(a)Monodisperse particle system.(b)Tridisperse particle system.(c)Pentadisperse particle system.In all four directions,the propagation distance D shows an approximately linear variation with time T and fitted curves are given.The slopes of these curves can be thought as average propagation velocities in the corresponding directions.For a value of velocity,the negative sign is only used to indicate the direction.
For each particle system, we consider thirty avalanches and achieve the average avalanche propagation distance in the T2 stage, which is shown in Fig.6.In the three particle systems, the propagation distances show an approximately linear variation with time in the four directions.In the T2 stage,we can examine the relationship between propagation distanceDdirand timetin each direction as follows:
whereddiris the value ofDat 0.1 s in Fig.6,Vdiris the slope of the equation,which also can be considered as average propagation velocities in the corresponding direction.Fitting curves with an error less than 5% are acquired in four directions as shown in Fig.6.Average propagation velocities are also marked in Fig.6.For a value of velocity, the negative sign is only used to indicate the direction.We focus on the propagation characteristics of particles in they-axis of the surface layer.
For each particle system, we further investigate the ratio of avalanche propagation distances in two directions along they-axis which can be expressed as
whereDupis the distance in the upward direction,Ddownis the distance in the downward direction,Vupis the velocity in the upward direction,Vdownis the velocity in the downward direction.Thedupandddownare the specific value in the upward and downward directions, respectively.tis the time and its value range is 0.1 s–0.4 s.
In each particle system, the average propagation velocities noted in Fig.6 are brought into Eq.(5).We can derive equations for the ratio of propagation distances in various particle systems in the initial time.
Monodisperse particle system
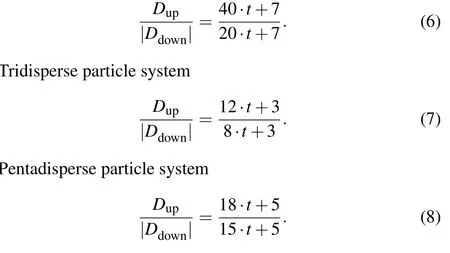
Based on Eqs.(6)–(8),we suspect that the ratio of propagation distances becomes large as time increases.In the monodisperse particle system,at 0.1 s the ratio is 1.22 and at 0.4 s the ratio increases to 1.53.In the tridisperse particle system, at 0.1 s the ratio is 1.11 and at 0.4 s the ratio increases to 1.26.In the pentadisperse particle system, at 0.1 s the ratio is 1.05 and at 0.4 s the ratio increases to 1.11.According to the experimental results, we can discover that as the dispersion of the particle systems increases,the ratio of the propagation distances decreases.This phenomenon might be attributed to that in polydisperse particle systems a more stable structure between particles in the T2 state,which comes from the mixing of a variety of particles.Consequently,a few moving particles are not enough to cause a large avalanche.Conversely, in a monodisperse particle system where the particles are initially loosely arranged,even a small fraction of moving particles can easily trigger a widespread avalanche, resulting in a long upward propagation distance.
In addition to propagation distance, there exists a fixed relationship between the propagation velocities in the two directions along they-axis for each particle system.This relationship can be expressed as
whereKis the ratio coefficient of the propagation velocities on both sides of they-axis in the initial state.The coloration coefficientKis various in different particle systems.Specifically, in the monodisperse particle system,Kis equal to 2 which is confirmed in existing work.[1]Furthermore, we detect that in the tridisperse and pentadisperse particle systems,Kis 1.5 and 1.2 respectively.This implies that with changes in the particle systems, the velocity relationship of the particles propagating on the surface layer also changes.To be precise,with increasing particle dispersion,it is observed that the gap between the two propagation velocities narrows, resulting in a smaller propagation coefficient.It is observed that in the monodisperse particle system,the ratio coefficientKis the largest,which indicates that the avalanche on the left side propagates further than that on the right side at the same time interval.As the dispersion of the particle system increases,the ratio coefficientKdecreases,which indicates that the gap in propagation distance between the two directions also decreases.It may be that polydisperse particle systems exhibit stability in the T2 stage leading to a decrease in the ratio of the propagation velocities in the two directions and a gradual convergence of thisKto 1.
We conduct an analysis to investigate the variation in avalanche scales and propagation distances in different particle systems.It is speculated that the nucleation leads to variations in the coordination number and velocity of moving particles.In the T2 stage, nucleation has a huge influence on particles’motion in the following time.Considering these factors, we record the average coordination number and average velocity of particles involved in the motion at 0.1 s for thirty avalanches.We analyze the distribution characteristics of the average coordination number and average velocity.
Figure 7 illustrates the distribution of average coordination number around the nucleation points in three different particle systems.The horizontal axis represents the coordination number, and the vertical axis represents the frequency of occurrence.At 0.1 s,nucleation has occurred and the avalanche has begun to propagate.In the monodisperse particle system,the coordination number is predominantly distributed in the range of 2.3–3.3,and the highest proportion is found at 2.5.In the tridisperse particle system, the coordination number primarily falls between 2.5 and 3.5, with the highest proportion at 2.8.In the pentadisperse particle system, the coordination number is mainly distributed in the range of 2.8–3.6,with the highest proportion at 3.2.It is evident that the more dispersed the particle system is,the higher the coordination number will be.Therefore,it can be inferred that polydisperse particle systems have better stability in the T2 stage.
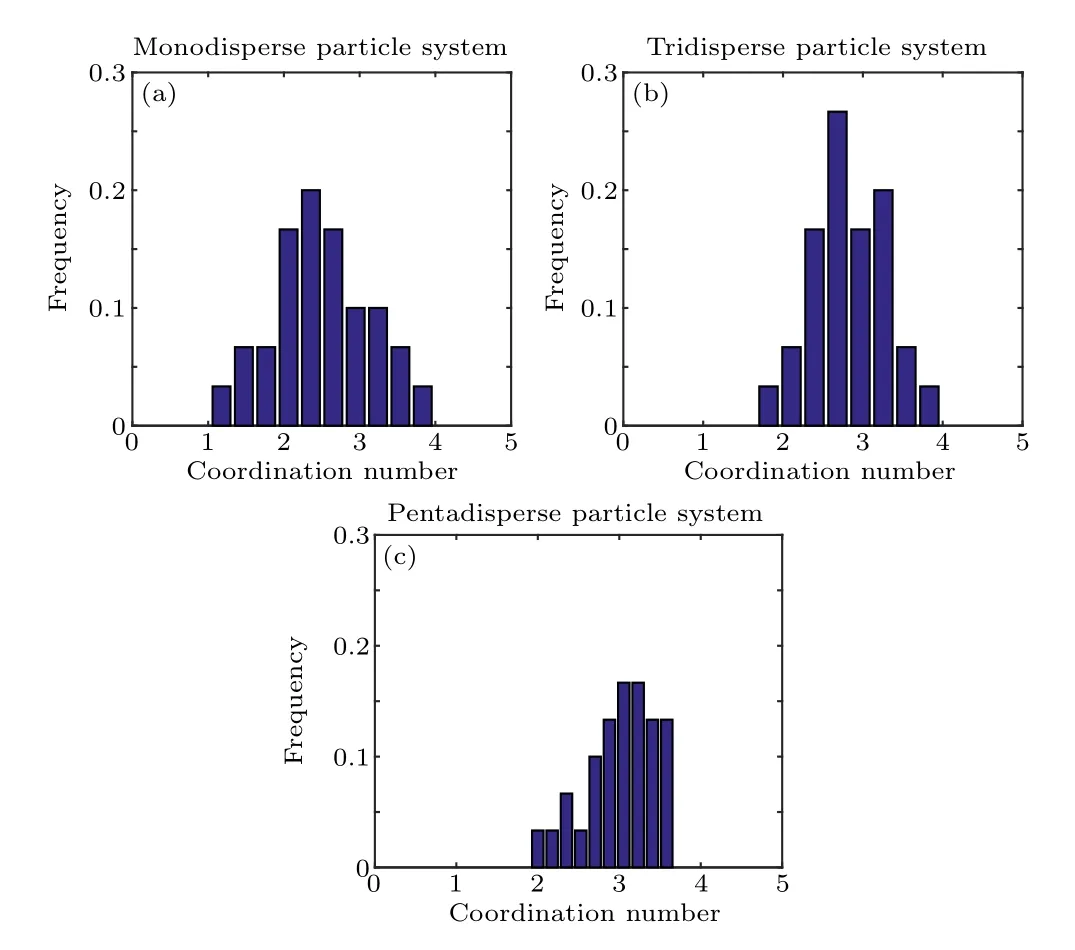
Fig.7.Coordination number distribution at 0.1 s in the three particle systems.(a) In the monodisperse particle system, the coordination number value that accounts for the maximum proportion is 2.5.(b)In the tridisperse particle system,the coordination number value that accounts for the maximum proportion is 2.8.(c)In the pentadisperse particle system,the coordination number value that accounts for the maximum proportion is 3.2.
The distribution of the average velocity of particles around the nucleation point in thirty avalanches is discussed.As shown in Fig.8,the horizontal axis represents particle velocity, and the vertical axis represents the frequency of occurrence.In the monodisperse particle system, there is a velocity distribution in the range of 0.45 mm/s–1 mm/s, with the highest proportion observed at 0.7 mm/s.In the tridisperse particle system,velocity distribution is within 0.4 mm/s–0.8 mm/s,with the highest proportion at 0.6 mm/s.In the pentadisperse particle system, the velocity distribution is in the range of 0.2 mm/s–0.6 mm/s, with the highest proportion at 0.55 mm/s.As the degree of particle dispersion system increases, the average velocity of particles around the nucleation point decreases.This observation supports the conclusion drawn from the above coordination number analysis, indicating that polydisperse particle systems are more stable in the T2 stage.
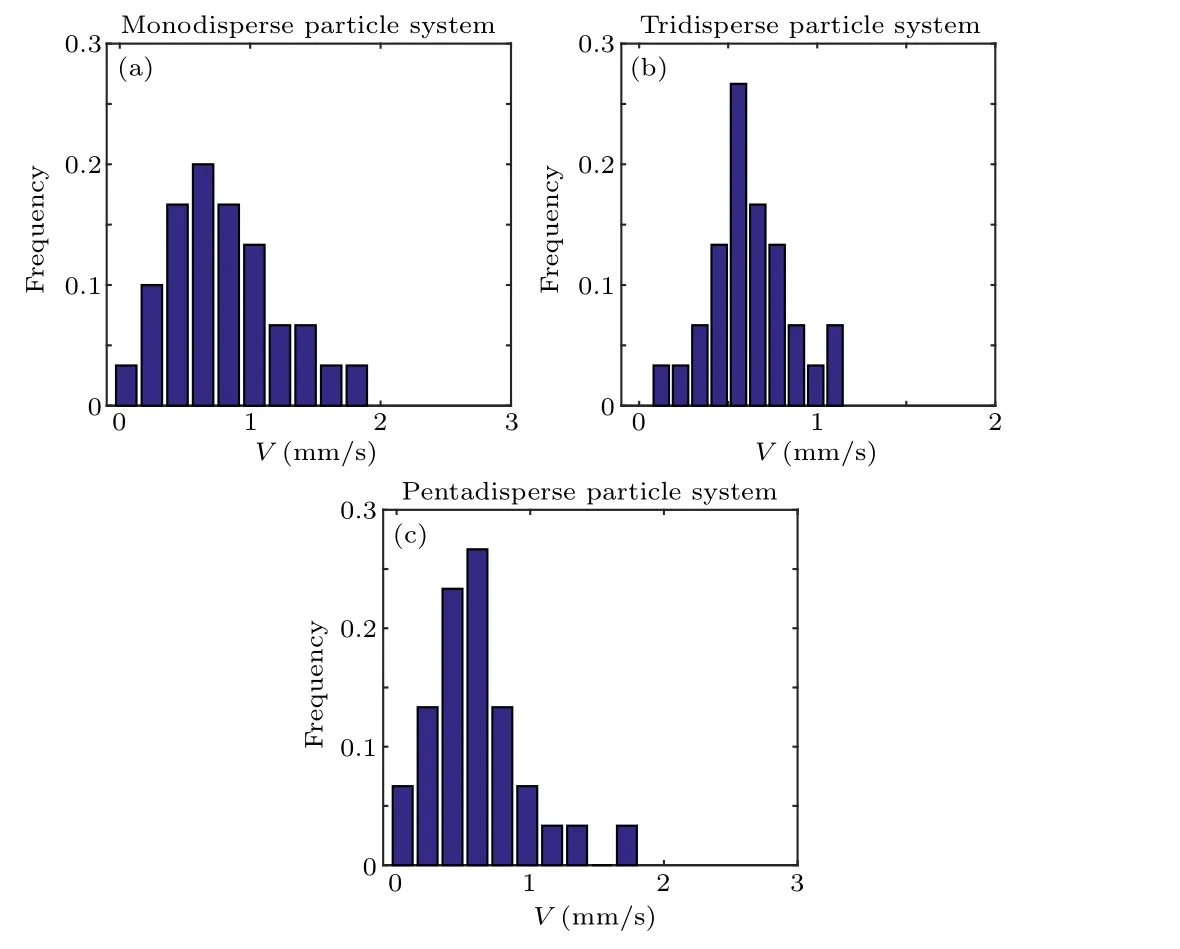
Fig.8.Particle velocity distributions at 0.1 s in the three particle systems.(a)In the monodisperse particle system,the velocity value that accounts for the maximum proportion is 0.7 mm/s.(b) In the tridisperse particle system, the velocity value that accounts for the maximum proportion is 0.6 mm/s.(c)In the pentadisperse particle system,the velocity value that accounts for the maximum proportion is 0.55 mm/s.
4.Conclusion
The characteristics of moving particles in the initial state of avalanches are investigated in the three particle systems.Nucleation and propagation exist in all three particle systems.The avalanche propagations in the initial state of polydisperse particle systems are more violent than that in monodisperse particle system.We can conclude that as the dispersion of the particle system increases, the change in avalanche scale gets great.By examining the propagation distance along they-axis,the number of moving particles and the slope of the number growth of moving particles,we observe that 0.4 s is a turning point.These metrics before 0.4 s exhibit distinct properties compared to those after 0.4 s.Considering that the appearance of the nucleation point is a special stage,the initial state is divided into three stages:T1 stage,T2 stage,and T3 stage.In the T2 stage,the propagation distance increases almost linearly in both axial and radial directions in all particle systems.The higher the degree of dispersion of the particle system is, the smaller the ratio of propagation distances in two opposite radial directions becomes.The ratio of propagation velocities in the two directions shows the same trend.We discuss the distribution characteristics of the average coordination number and average velocity for the moving particles at the beginning of the T2 stage.The results support that the polydisperse particle systems are more stable in the T2 stage.
Acknowledgments
Project supported by the Qingdao National Laboratory for Marine Science and Technology(Grant No.2015ASKJ01)and the National Natural Science Foundation of China(Grant Nos.11972212,12072200,and 12002213).
猜你喜欢
Chinese Physics B(2022年11期)2022-11-21
考试与评价·七年级版(2021年2期)2021-08-14
考试与评价·七年级版(2020年4期)2020-10-23
娃娃乐园·绘本(2020年9期)2020-09-28
中华建设(2019年10期)2019-11-12
中学生博览(2019年2期)2019-01-23
娃娃乐园·综合智能(2017年16期)2017-02-24
水动力学研究与进展 B辑(2016年4期)2016-10-18
小小说月刊(2015年11期)2015-05-14
- Chinese Physics B的其它文章
- Unconventional photon blockade in the two-photon Jaynes–Cummings model with two-frequency cavity drivings and atom driving
- Effective dynamics for a spin-1/2 particle constrained to a curved layer with inhomogeneous thickness
- Genuine entanglement under squeezed generalized amplitude damping channels with memory
- Quantum algorithm for minimum dominating set problem with circuit design
- Protected simultaneous quantum remote state preparation scheme by weak and reversal measurements in noisy environments
- Gray code based gradient-free optimization algorithm for parameterized quantum circuit