
Design of tightly linked dual ring antenna and imaging of magnetic field distribution using a diamond fiber probe
2024-02-29 09:18QingYunYe叶青云YaWenXue薛雅文FeiYueHe何飞越XuTongZhao赵旭彤YuChenBian卞雨辰WenTaoLu卢文韬JinXuWang王金旭HongHaoChen陈鸿浩ShengKaiXia夏圣开MingJingZeng曾明菁andGuanXiangDu杜关祥
Chinese Physics B 2024年2期
关键词:青云
Qing-Yun Ye(叶青云), Ya-Wen Xue(薛雅文), Fei-Yue He(何飞越), Xu-Tong Zhao(赵旭彤),Yu-Chen Bian(卞雨辰), Wen-Tao Lu(卢文韬), Jin-Xu Wang(王金旭), Hong-Hao Chen(陈鸿浩),Sheng-Kai Xia(夏圣开), Ming-Jing Zeng(曾明菁), and Guan-Xiang Du(杜关祥),†
1College of Telecommunications and Information Engineering,Nanjing University of Posts and Telecommunications,Nanjing 210003,China
2College of Science,Nanjing University of Posts and Telecommunications,Nanjing 210003,China
3School of Computer Science,Nanjing University of Posts and Telecommunications,Nanjing 210023,China
4Bell Honors School,Nanjing University of Posts and Telecommunications,Nanjing 210023,China
Keywords: nitrogen vacancy(NV),microwave(MW)imaging,inhomogeneous broadening
1.Introduction
The center of diamond nitrogen vacancy (NV) is a luminous point defect in diamond crystal, which is formed by combining a carbon atom replaced by a nitrogen atom with an adjacent vacancy.[1]Recently,diamond NV center has gradually become a research hotspot in the field of quantum precision measurement due to its excellent quantum characteristics,including stable crystal structure, long coherence time, good biocompatibility, and being initialized and read out by optical means.This technology is known as the optically detected magnetic resonance(ODMR)technique.[2–7]
The electron spin of diamond NV centers can be manipulated by microwaves at around 2.87 GHz under zero field conditions at room temperature,and quantum state-dependent photoluminescence can be generated.[8–11]There are many traditional methods of generating microwaves, such as thin and straight conducting wires and circular multi turn coils.However, the former’s microwave field strength rapidly decreases with the increase of distance from the wire, resulting in poor uniformity.The latter has good uniformity but weak strength,and both structures will create shielding for the test sample.Therefore, designing near-field radiation antennas that can generate uniform microwaves is particularly important.
In this paper,we design a linked dual ring antenna by using CST Microwave Studio software (Version 2019) and the antenna possesses the following properties: (i) having a central resonant frequency of 2.87 GHz with a bandwidth of about 200 MHz.(ii) Generating a uniform magnetic field within a small ring of 0.75 mm in radius.Then,a fiber optic diamond probe is used to perform high-resolution imaging of the magnetic field in the antenna radiation area.
2.Antenna design analysis
In order to achieve accurately manipulate the central quantum state of diamond NV, the resonant frequency of the antenna should be set to about 2.87 GHz,and the field strength and bandwidth should be as large as possible.Figure 1(a)shows the whole structure of the antenna.It is mainly composed of two closely placed rings,and a small ring in the middle of the narrowest part, which is the working area, and the microwave field will radiate from the inside of this ring.
In order to better adjust parameters according to requirements the simulation process,it is necessary to perform circuit equivalence on the antenna, by equating the irregular patch shape to the most basic resistor–inductor–capacitor(RLC)circuit,and thereby determining the influence of each parameter on the various performance indicators of the antenna.[12–14]The equivalent resistanceR0of the antenna is directly proportional to the radius of the big ringR:R0∝R.The small ring contributes to the equivalent inductance:L0∝r, whereris the radius of the small ring.[14]The gap between the two rings contributes to the equivalent capacitance:C0∝(πR-2r)/d2,whered2is the gap width.As the radius of the small ring is fixed atr=0.75 mm,we can deduce thatC0∝R/d2.Although the actual equivalent RLC circuit of the antenna is more complex, we can still perform simple derivations and analysis to aid in designing the antenna for achieving the desired resonant frequency and bandwidth.
Then,the RLC resonant frequency equation gives
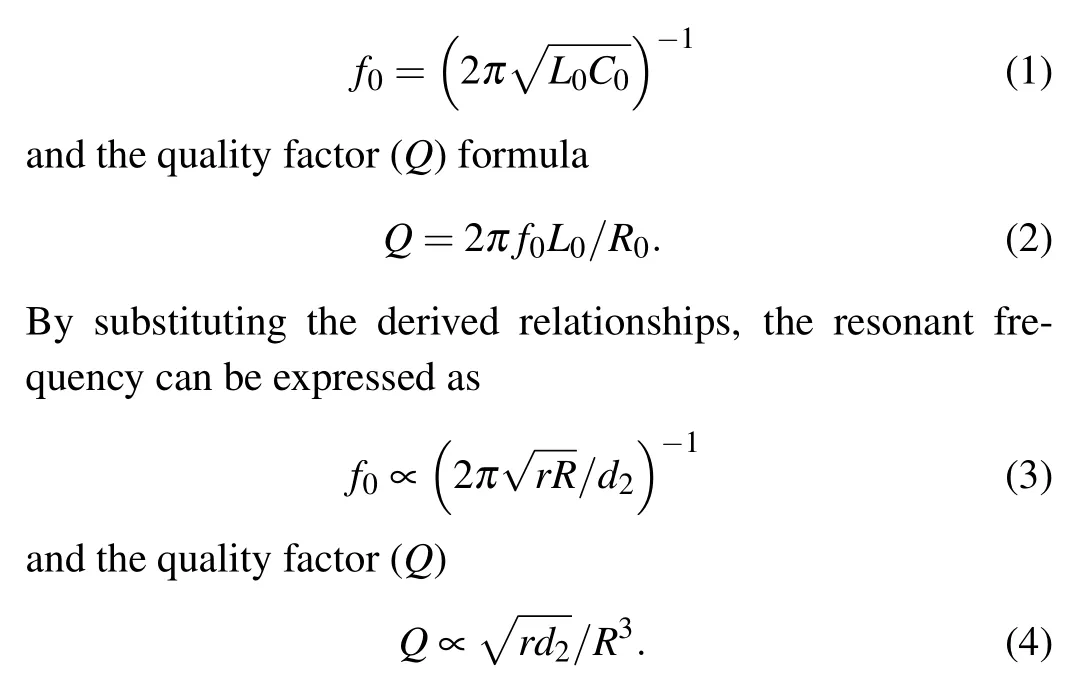
Here, the size ofris fixed (r=0.75 mm), representing the desired size of the uniform circular magnetic field.For this tightly linked dual ring antenna,to achieve a large bandwidth,a lowQis desirable.
According to Eqs.(3)and(4),d2andRhave the greatest influence on the performance of the antenna, and we will focus on analyzing these two parameters.Parameterd2affects the equivalent capacitance of the antenna, which in turn significantly influence theS11at the resonant frequency.Whend2=0.1 mm andR=10.55 mm, a very lowS11of approximately-18 dB can be achieved.However,d2=0.1 mm is the maximum manufacturing accuracy for the product available from many PCB manufacturers(Here,PCB stands for printed circuit board),and a small manufacturing error can have a significant influence on the antenna performance.Therefore,usingd2=0.15 mm withR=10.55 mm can reduce the risk of production errors.The simulation shows that there is still anS11of about-11.5 dB,which is sufficient for the experimental requirements.In accordance with Eq.(3),a larger value ofRleads to a smaller resonant frequency.The simulation results in Fig.1(c) also confirm this relationship.Since NV centers are used for ODMR,it is necessary to adjust the resonant frequency of the microwave antenna to match the electron spin resonance(ESR)frequency of the NV center.
Table 1 displays the design parameters of the tightly linked dual rings antenna in Fig.1(a), and the main parameters of the PCB in Fig.1(b).Based on these parameters,the designed antenna exhibits a resonant frequency of 2.87 GHz and a bandwidth of 200 MHz.
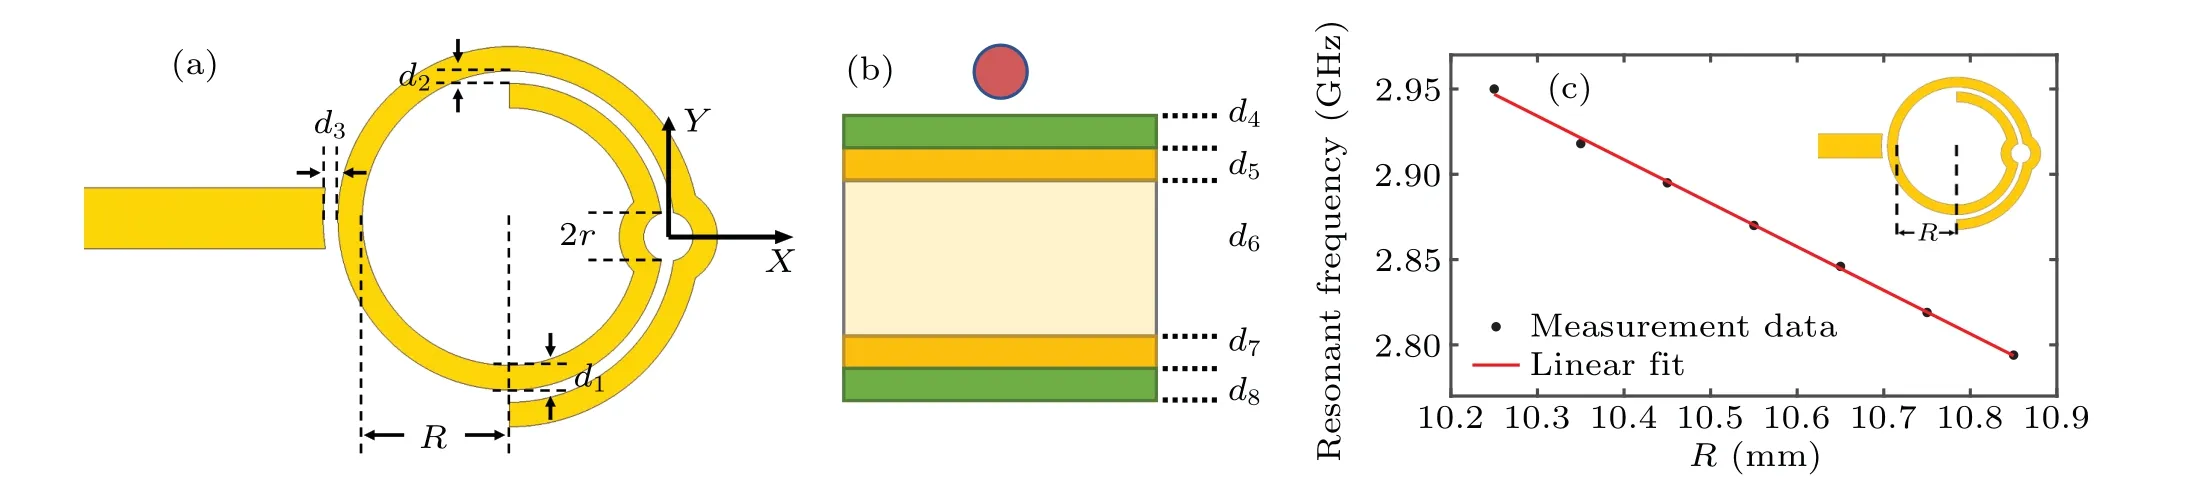
Fig.1.(a)Antenna design parameters and XY coordinate axis;(b)cross-section diagram of antenna,with NV center particle(red ball)placed above antenna;(c)variation of antenna resonant frequency f0 with R.
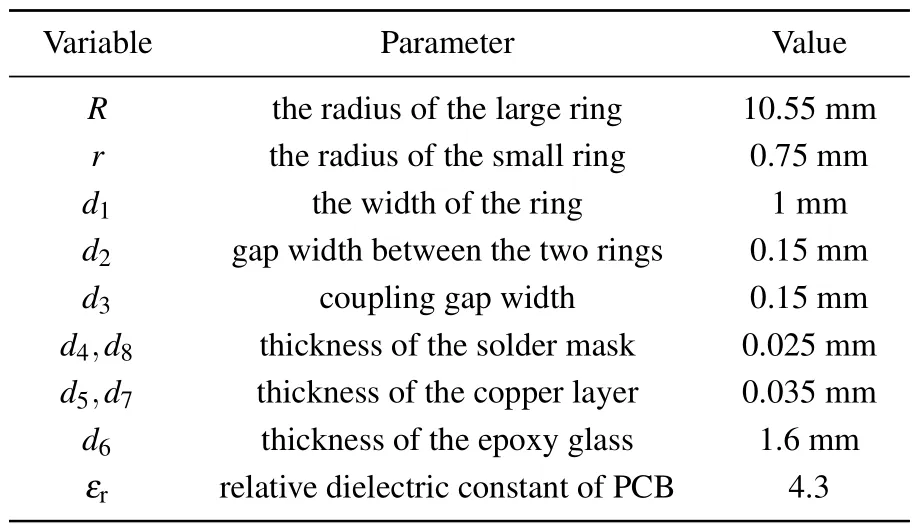
Table 1.Antenna design parameters and main parameters of PCB.
3.Antenna characterization experiment
3.1.Measuring S11 of antenna
Figure 2(a) shows the fabricated tightly linked dual ring antenna, which is 55-mm long and 40-mm wide.The microwave power is input from the SMA connector on the left.The antenna is connected to a vector network analyzer(Ceyear-3276D, 10 MHz–50 GHz) to measure theS11data.The measuredS11value can provide important information about the antenna’s performance and suitability for microwave imaging experiments.Figure 2(b)displays the collected data,with the blue line representing the simulated data from CST and the red line denoting the measured data from the vector network analyzer.The measured data indicate that the resonant frequency of the antenna is about 2.87 GHz,which aligns with the simulation expectation.The simulated reflection coefficientS11at the resonant frequency is about-11.5 dB.However, due to factors such as the PCB material, machining errors,and other uncertainties,the actual measurement ofS11may not be so ideal,but it is still about-8 dB,which has met the experimental requirements.The subsequent experimental results also suggest that the antenna’s performance is acceptable for the intended magnetic imaging experiments.

Fig.2.(a)Tightly linked dual rings antenna on PCB;(b)simulated and measured curves of S11 versus frequency.
3.2.Magnetic imaging on antenna surface
Figure 3 shows the schematic diagram of the magnetic imaging experimental setup.The NV center particle is attached to a tapered fiber and placed as close as possible to the antenna surface.The antenna is affixed to a stepping platform that can be precisely controlled by a computer, allowing the scanning of a specified area in a controlled manner.This setup enables magnetic imaging experiments to be performed on the surface of the antenna.

Fig.3.Schematic diagram of measuring device,including microwave power control circuit, avalanche photodetector, data acquisition system, and computer that controls the sensors and records the data,with green arrows denoting laser used to excite NV center,and red arrows representing fluorescent of NV centers.
The magnetic imaging experimental setup involves computer-controlled modulation of the green laser (532 nm)by using an acousto–optic modulator(AOM).The pulsed laser used to excite the NV center is focused on the tapered fiber.The microwave source generates a microwave signal at about 2.87 GHz, and the computer controls a microwave switch to convert the microwave signal into a microwave pulse signal.Then, the NV center is excited to generate red fluorescence,which is transmitted through the fibers to an avalanche photodetector(APD).The electrical signals from the APD are collected by a data acquisition card(DAQ)and transmitted to the computer for further analysis and processing.
In order to achieve magnetic imaging of the microwave antenna surface, we start with ODMR experiments.At room temperature, the ground state sub-sate level of the NV center arems= 0,ms=±1, with an energy difference of 2.87 GHz.[15]When an external static magnetic field is applied to the NV center, the ground state levelsms=±1 split intoms=+1 andms=-1 states due to the Zeeman effect.[16]The energy level difference increases with the strength of the applied static magnetic field.When the microwave frequency resonates with the transition fromms=0 toms=±1, a decrease in fluorescence intensity can be observed.[17]As the NV center has four axes, each with its own two-state transitions, a total of eight non-overlapping peaks are observed in the ODMR spectrum.[10,18,19]Figure 4(a) shows the ODMR spectrum obtained after a static magnetic field has been applied to the microwave antenna.The data in the figure are the modulation depth of the sideband signal,and eight distinct peaks can be observed.[20]
After conducting the ODMR experiment, we proceed with the Rabi oscillation experiment in the center of the small ring.The microwave frequency used for the Rabi oscillation is set to 2.89 GHz,which corresponds to one of the peak frequencies observed in the continuous wave ODMR spectrum.Due to the good bandwidth of the antenna, we are able to achieve anS11of about-8 dB,indicating a strong magnetic field in the region of the small ring of the antenna.By accurately aligning the NV center particle in the center of the small ring,we measure and record the Rabi oscillation data.The original data,along with their fitting curve,are shown in Fig.4(b).The amplitude of the Rabi oscillation follows an exponential decay and its frequency is proportional to the applied magnetic field.We can use the following expression to fit the Rabi oscillation spectrum[18]
whereA0is the fluorescence intensity at the carrier frequency,kis the coefficient related to the depth of modulation,A0is the fluorescence intensity at the sideband frequency,γis the gyromagnetic ratio of electron spin,BMWis the amplitude of the applied microwave magnetic field,tis the pulse duration of the microwave,andτis the Rabi dephasing time due to the limited spin lifetime and non-uniformity in static field and microwave field.
The frequency of the fitted curve in Fig.4(b)is 1.74 MHz,which corresponds to a microwave magnetic field intensity(BMW) of 0.62 Gs (1 Gs=10-4T).A complete Rabi oscillation can be obtained by scanning each position of the antenna,so as to obtain the microwave field intensity at this position.[21]However,it takes a lot of time to do so.According to Eq.(5),we can find that when the pulse duration of the microwave is very short,the Rabi oscillation curve can be regarded as a direct proportional function.This is also verified by the Rabi oscillation curve (Fig.4(b)): whentis very small (the blue line,t=50 ns),the Rabi oscillation curve can be regarded as a straight line.At the same time, there is a linear relationship between Rabi frequency and microwave magnetic field according to the following equation:
whereγis the gyromagnetic ratio of electron spin, ¯his the reduced Planck’s constant,andwRis the Rabi oscillation frequency.According to formulae (5) and (6), we can conclude that when the microwave action timetis very small, the intensity of fluorescence is proportional to the intensity of magnetic field.Therefore, in the later magnetic imaging experiments,we set the microwave pulse duration to about 50 ns to ensure a linear response of fluorescence intensity to the magnetic field intensity.This allows for more efficient and faster imaging of magnetic fields without spending excessive time at each location.[21–24]
Figure 5(a) shows the region of interest (ROI) for magnetic imaging,delineated by the dashed box.A stepping platform is utilized to accurately control the position of the microwave antenna,enabling scanning within the ROI.The scanning area spans a width of 2000µm and a length of 2000µm,in steps of 25 µm between each scanned point.Figure 5(b)shows the microwave antenna surface magnetic field distribution mapping obtained by CST software simulation, and the data are normalized for visualization and analysis.Figure 5(c)shows the measurement results of the distribution characteristics on the surface of the microwave antenna,with microwave power of 30 dBm.The diameter of the diamond particle used in our study is about 15 µm.The distance between the diamond particle and the PCB surface is kept at around 200µm.We employ industrial-grade diamond powder characterized by its smooth surface.The single-crystal diamond powder is synthesized by using the high-temperature high-pressure(HPHT)method.This synthesis involves irradiating the diamond powder with 3-MeV H+,causing carbon atoms to gradually deviate from their equilibrium positions,thus generating vacancies in the diamond structure.Nitrogen atoms are likely to be captured by these vacancies, forming NV centers.Subsequently,the diamond sample undergoes a vacuum annealing process at around 800◦C for about 2 h to enhance the nitrogen concentration and vacancy concentration.The comparison between Figs.5(b) and 5(c) reveals that the measured magnetic field distribution of the microwave antenna surface is in good agreement with the simulation data.The magnetic field is mainly distributed in the ring with a radius of 0.75 mm.
Figures 6(a) and 6(b) show comparisons of the data obtained along two different directions (line I and line II in Fig.5) on the ring of the microwave antenna.It should be noted that there may be some errors in both the simulation results and experimental data due to factors such as the difference between the simulated antenna material and the actual antenna material, and the errors in the distance between the scanning plane and the antenna surface.Despite these potential sources of errors, it can be observed that the mean error between the simulation results and experimental data is 2.5%and exhibits the same distribution trend,which further verifies the good consistency between simulation results and experimental data.
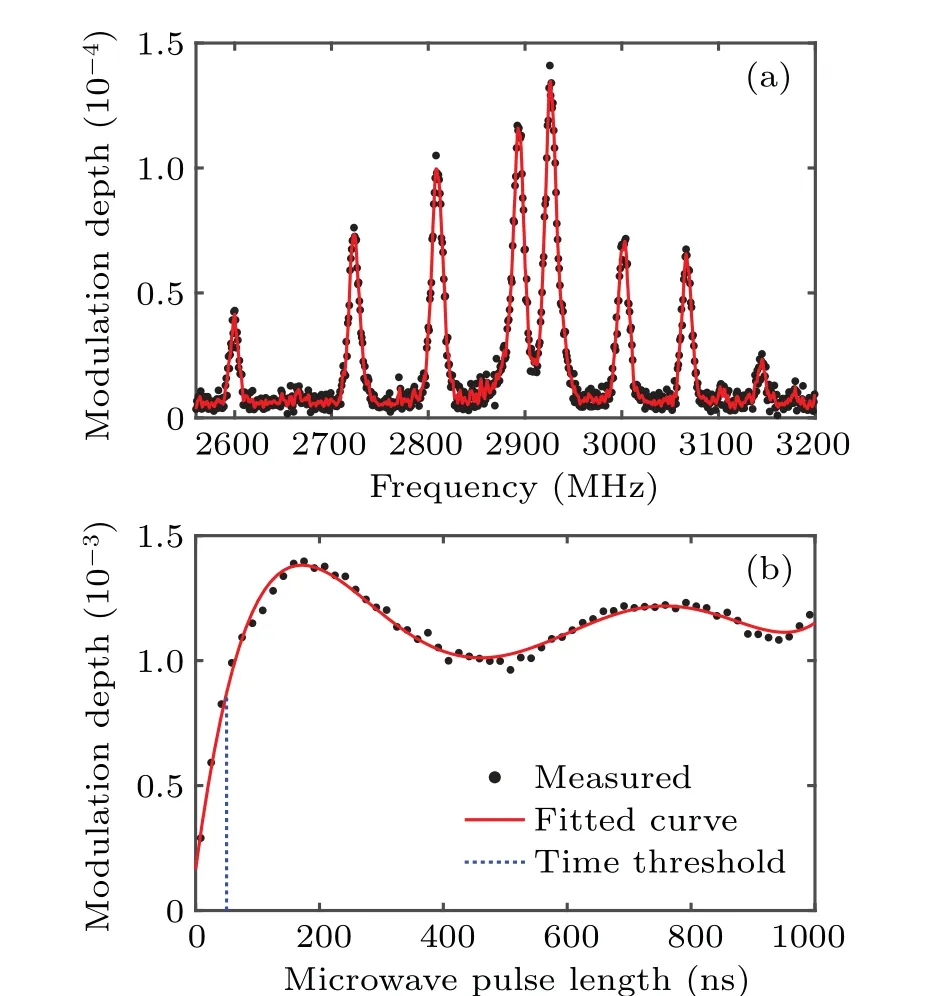
Fig.4.(a)ODMR spectra of NV center after applying static magnetic field,and(b)measurement data and fitting curves of typical Rabi oscillations at MW frequency of 2.89 GHz.
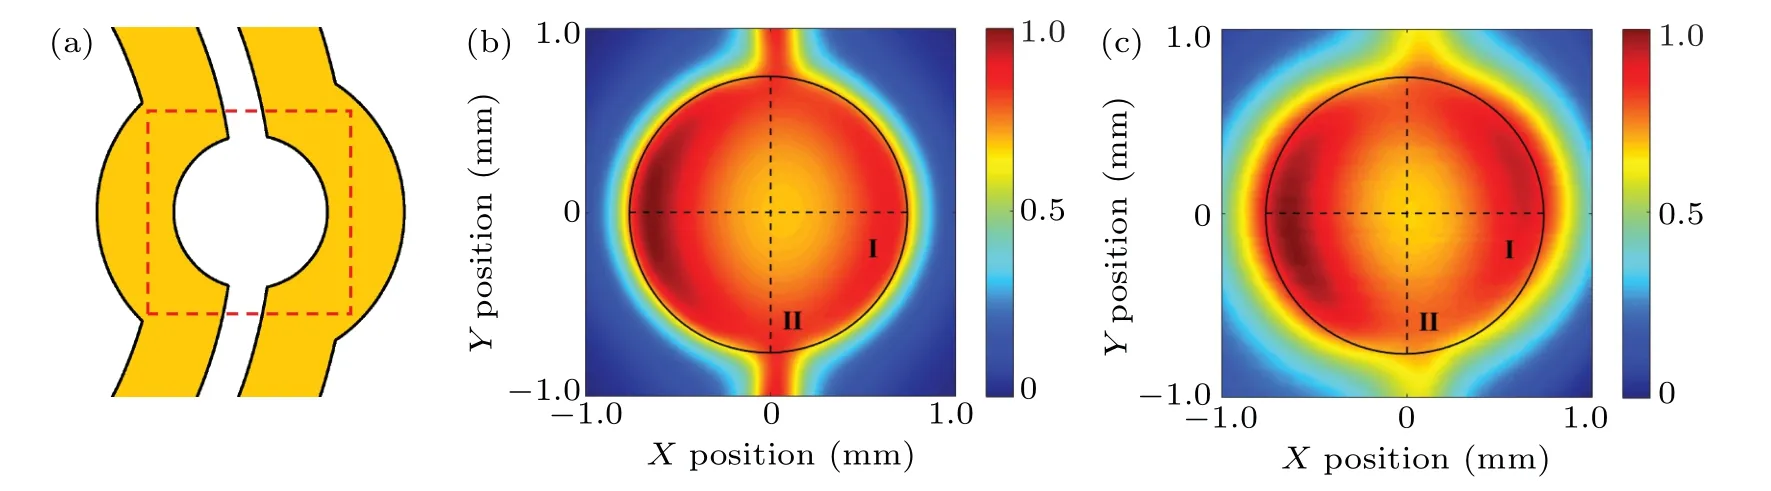
Fig.5.(a)Area inside red dashed box is the area to be imaged;(b)simulation results and(c)experimental scanning results of magnetic field distribution on the antenna surface,respectively.
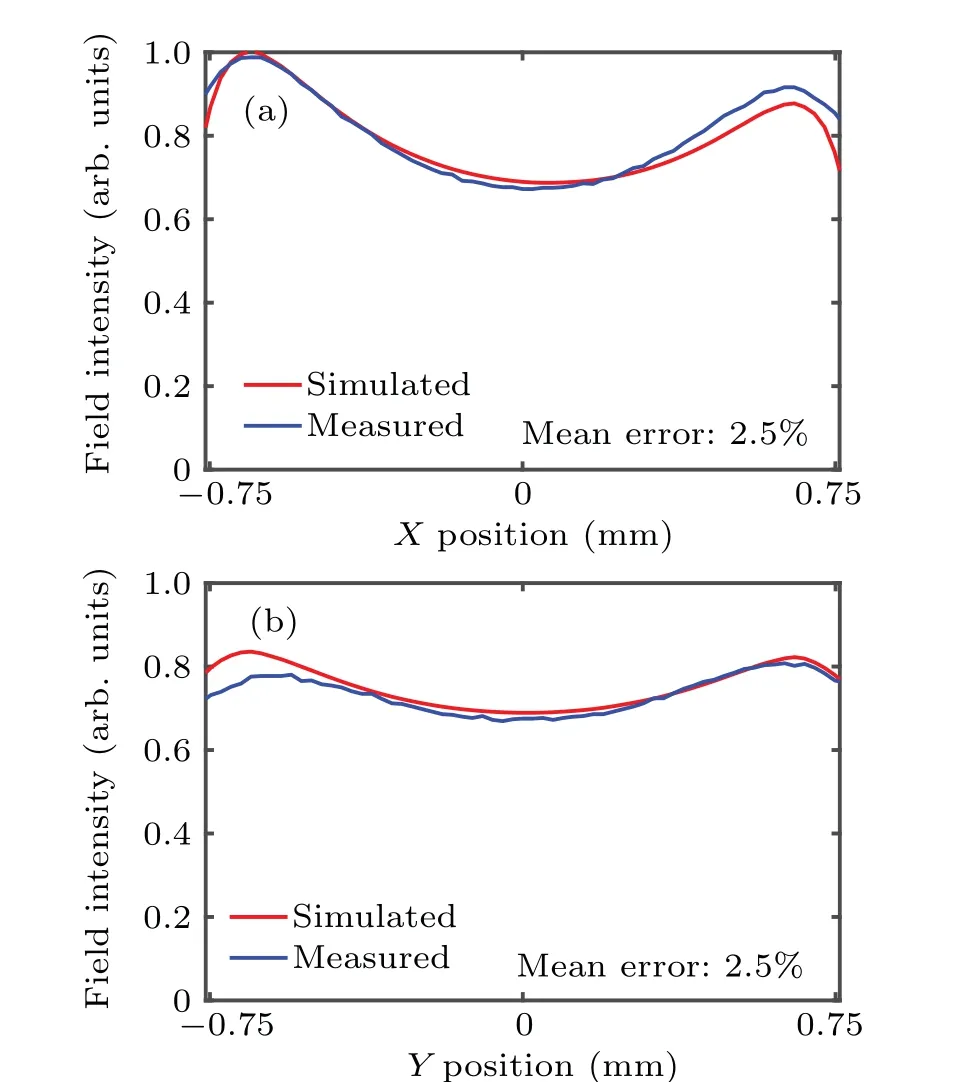
Fig.6.Comparison between simulation data (red line) and measurement data (blue line) along (a) dotted line I and (b) dotted line II in Fig.5,respectively.
In order to assess magnetic field fluctuations, the mean value and standard deviation of the magnetic field in different radius ranges are calculated by using Matlab.The results are listed in Table 2.The analysis of the data in Table 2 shows that the magnetic field tends to weaken as we get closer to the center of the circle,although the amplitude will be weakened slightly.Moreover, the fluctuations in the magnetic field distribution are smaller as we approach the center of the circle.

Table 2.Mean value and standard deviation of magnetic field in different radius ranges.
4.Investigation of inhomogeneous broadening in ODMR
From our previous magnetic imaging experiments, we have observed that this antenna can produce a fairly uniform magnetic field.In order to further analyze the magnetic field distribution, we calculate the absolute value of the magnetic field gradient along theXdirection,and the results are shown in Fig.7(a).The results reveal that the magnetic field in the center of the small ring exhibits a remarkably uniform distribution,with an almost negligible gradient(indicated by point D).However, when we move from the center towards-0.5 mm(indicated by point A), the gradient of the magnetic field increases gradually, indicating that the non-uniformity of the magnetic field increases.
In experiments, achieving a narrow ODMR linewidth is often desired.A narrower linewidth presents a higher resolution, enabling more accurate detection and analysis of subtle differences among different spin systems.Additionally,a wide linewidth results in a fuzzy line shape,making it challenging to accurately measure peak positions and characteristic parameters.A narrow linewidth enhances measurement accuracy and improves the reliability of experimental results.[25,26]Next,we will further investigate the influence of magnetic field uniformity on the broadening of ODMR.
To investigate the effect of magnetic field non-uniformity,it is important to minimize the influence of static magnetic field non-uniformity.This can be achieved by aligning the axis of the magnet with the NV center particle,which helps to reduce the gradient of the static magnetic field so as to minimize the influence of non-uniformity of the static magnetic field.[27]At the same time, it is important to consider the influence of power broadening in our experiments.Since the magnetic field gradient in the center of the ring is nearly zero,we can use this as a reference point.Referring to Fig.4(b),we observe that the action time of theπpulse is about 175 ns.To maximize the spin reversal efficiency and obtain stronger ODMR signals with a narrower linewidth, we conducte the ODMR experiment again,by setting the microwave pulse duration to 175 ns.It can be seen from Fig.7(a)that the absolute value of the magnetic field gradient increases gradually from D to A.Also, the magnetic field strength gradually increases from point D to point A,causing the Rabi oscillation frequency to increase,as shown in Fig.7(b).Therefore,when repeating the experiment with different magnetic field intensity gradients, it is crucial to carefully adjust the microwave power to maintain a constant Rabi oscillation period.This ensures that the action time of theπpulse is kept at 175 ns.By doing so,we can eliminate the influence of power broadening and focus solely on investigating the effects of magnetic field inhomogeneous on the broadening of ODMR.We conduct the aforementioned experiments at point D to point A respectively.By performing Lorentz fitting on the single peak near 2.89 GHz(the selected peak frequency in the Rabi experiment) within the ODMR spectrum, its half-height width can be calculated.The obtained results are presented in Fig.7(c).
The experimental results show that the non-uniformity of the magnetic field indeed influences the linewidth of ODMR.Specifically,it is observed that a decrease in the magnetic field gradient corresponds to a smaller broadening of the ODMR linewidth.In the scenario that high uniformity of the magnetic field is needed, such as in an atomic clock where magnetic field is applied to atoms,minimizing the inhomogeneous broadening of ODMR is important.[28]That is the purpose of designing such a antenna: to generate a uniform magnetic field.By achieving a uniform field, the antenna conduces to minimizing the inhomogeneous broadening of ODMR lines.Consequently, this reduction of broadening leads to narrower ODMR linewidths, thereby enhancing the sensitivity and accuracy of the experimental measurements.
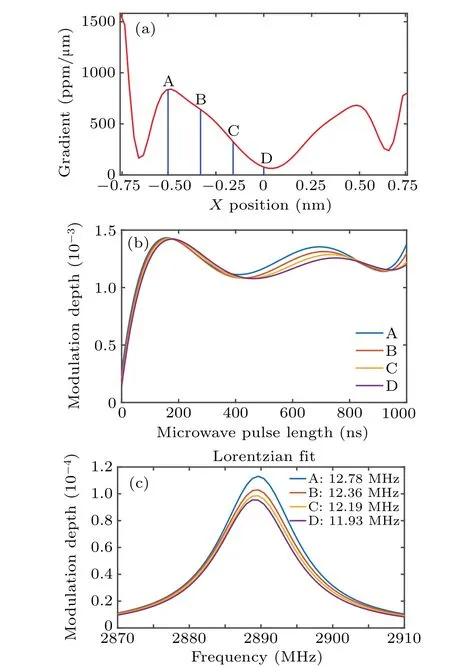
Fig.7.(a)Absolute value of magnetic field gradient varying along the dotted line I direction in Fig.5(c);(b)Rabi oscillation fitting curves at points A, B, C, and D, respectively; (c) Lorentzian fitting of ODMR spectra at points A, B, C, and D, with inset showing their respective half-height widths(in unit MHz).
5.Conclusions
In this work, we have successfully designed a tightly linked dual ring antenna that is capable of coupling a large area of uniform magnetic field to the NV center.The resonant frequency of the antenna is about 2.87 GHz,with a wide bandwidth that allows for addressing multiple peak frequencies in the ODMR spectrum.Furthermore, the antenna generates a fairly uniform magnetic field in a small ring region, which is confirmed by both experimental results and simulation data.
We utilized an optical fiber scanning probe with an NV center particle to characterize the magnetic field distribution on the antenna surface.The experimental results obtained closely match the simulation data,validating the performance of the antenna.The experimental results demonstrate that the magnetic field distribution on the antenna surface is highly uniform,with a normalized standard deviation of less than 6%in the circular region with a radius of 0.5 mm.These excellent characteristics make the tightly linked dual rings antenna suitable for scanning imaging and wide field of view imaging.Experimentally, we also explored the influence of magnetic field non-uniformity on the linewidth of ODMR.These findings provide some ideas for mitigating inhomogeneous broadening in ODMR and enhancing the device’s sensitivity and accuracy.
Acknowledgements
Project supported by the National Key Research and Development Program of China (Grant No.2021YFB2012600)and the Shanghai Aerospace Science and Technology Innovation Fund(Grant No.SAST-2022-102).
猜你喜欢
青年文摘(2020年22期)2020-12-21
文苑(2020年5期)2020-06-16
少儿美术(快乐历史地理)(2020年11期)2020-02-25
海峡姐妹(2019年10期)2019-11-23
童话王国·文学大师班(2017年9期)2017-10-13
治理现代化研究(2017年6期)2017-06-27
金秋(2016年22期)2016-05-04
清风(2014年4期)2014-06-24
清风(2014年1期)2014-06-24
茶博览(2013年1期)2013-01-04

- Chinese Physics B的其它文章
- Unconventional photon blockade in the two-photon Jaynes–Cummings model with two-frequency cavity drivings and atom driving
- Effective dynamics for a spin-1/2 particle constrained to a curved layer with inhomogeneous thickness
- Genuine entanglement under squeezed generalized amplitude damping channels with memory
- Quantum algorithm for minimum dominating set problem with circuit design
- Protected simultaneous quantum remote state preparation scheme by weak and reversal measurements in noisy environments
- Gray code based gradient-free optimization algorithm for parameterized quantum circuit