
Dependence of Rydberg-atom-based sensor performance on different Rydberg atom populations in one atomic-vapor cell
2024-02-29 09:18BoWu武博JiaweiYao姚佳伟FengchuanWu吴逢川QiangAn安强andYunqiFu付云起
Chinese Physics B 2024年2期
Bo Wu(武博), Jiawei Yao(姚佳伟), Fengchuan Wu(吴逢川), Qiang An(安强), and Yunqi Fu(付云起)
College of Electronic Science and Technology,National University of Defense Technology,Changsha 410073,China
Keywords: Rydberg atom population,Rydberg-atom-based receiver,stepped atomic-vapor cell
1.Introduction
In the past ten years, Rydberg atomic microwave sensors[1–3]have made significant progress due to ravishing characteristics that classical radio-frequency (RF) microwave(MW)technology does not have,including self-calibration,[4]high sensitivity,[5,6]broad operation frequency.[2,7–10]It has a wide range of applications, such as sensors for communication signals (amplitude modulated,[11–13]frequency modulated,[14]phase modulated signals[15–17]), Rydberg microwave frequency comb spectrometer,[18]and imaging.[19]
It has been theoretically demonstrated that measurement sensitivity limit of Rydberg atomic microwave sensor is-220 dBm/Hz,[20]which is far exceeding classical sensor sensitivity limit of-174 dBm/Hz(room temperature).[21]Further research has put forward solutions to improve experimental measurement sensitivity including atomic superheterodyne sensor,[22]enhanced metrology at the critical point of a many-body Rydberg atomic system,[23]resonator,[24,25]and multi-photon readout.[26]According to the quantum projection noise-limited sensitivity formula,[27]sensitivity grows by increasing the Rydberg atom population.Due to finite Alkali metal atoms density, longer cell length is often utilized to achieve larger Rydberg atom population.However, there remains elusive in no good consistency for multiple different length cells.Essentially,multiple different-length cells would make atomic population density and pressure of buffer gas different,making it unable to accurately capture actual response about Rydberg atom population effect.
In this paper, we propose a stepped atomic-vapor cell with five different path lengths under the same atomic population density and buffer gas pressure.We rigorously study how the Rydberg atom population affects the electromagnetically induced transparency (EIT) signal height, full width at half-maximum (FWHM), and sensitivity of superheterodyne atomic sensor, under saturated laser power conditions.First of all, when coupling, probe laser power reaches a specific value, the EIT height reaches saturation to investigate effect of Rydberg atom population.Additionally, we theoretically and comprehensively analyze effect of different Rydberg atom populations by utilizing coherent signal integration theory and atomic linear expansion coefficient method.The experimental and theoretical results verify the EIT signal height, FWHM,and sensitivity increase with Rydberg atom population in the case of shorter length cell.Specifically,the EIT signal height keeps a steady proportional upward trend with the cell length from 5 mm to 25 mm.Our results may provide helpful suggestions for the high-sensitivity Rydberg atomic microwave sensor design for practical applications.
2.Experimental setup
In this section, we introduce the stepped atomic-vapor cell, experimental setup, and energy diagram.As shown in Fig.1(a), the stepped atomic-vapor cell structure is adopted to investigate the Rydberg state population effect on Rydberg atomic microwave receivers.The stepped atomic-vapor cell is composed of the Schott BOROFLOAT material and has five different dimensions under the same atomic population density and buffer gas pressure.Figure 1(a)presents the measurement prototype geometry.To clarify structure of the stepped atomic-vapor cell more clearly, specific size is illustrated in Fig.1(b).
As shown in Fig.2(b),cesium atoms can be easily excited from the ground state to Rydberg states utilizing two-photon resonance.Compared to single-step excitation, two-step excitation has lower requirements for excitation laser frequency and a more significant transition dipole moment, resulting in a higher excitation efficiency.The experimental setup utilized to measure the effect of Rydberg-atom-based receiver performance utilizing stepped atomic-vapor cell is shown in Fig.2(a).In the first stage, probe laser and coupling laser counter-propagate and overlap through the center of cell.In the next step, the detector senses probe laser, which converts optical signal to electrical signal.Ultimately, the EIT spectrum can be obtained by scanning at 510.1 nm coupling laser at room temperature.The EIT signal within magnetic shielding tube serves as reference signal for our system.To generate MW field,we utilize two signal generators with an output power of up to 25 dBm.
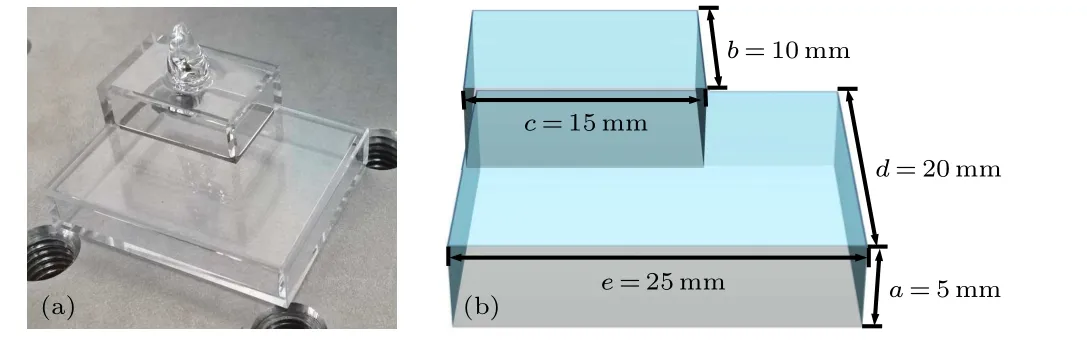
Fig.1.Geometrical details of the stepped atomic-vapor cell: (a) measurement prototype from front view,(b)specific size of stepped atomicvapor cell,a=5 mm,b=10 mm,c=15 mm,d=20 mm,e=25 mm.
The inter-atomic collisions with the increased temperature are considered to be the primary reason for widening the EIT width.Thus, in the case of the given Rabi frequency of the probe and coupling laser,increasing the temperature of the cell will lead to increase of the EIT width.On the other hand,as the temperature rises,the atomic density inside the cell will increase,which will increase the absorption of the probe laser.In other words, more atoms will be involved in the quantum correlation effect which reduces the EIT width.[28]In a word,temperature has an effect on the EIT width that is a mix of two opposite effects: at lower temperatures, the effects of increased interatomic collisions from rising temperature dominate, making the EIT width greater; at higher temperatures,the effects of increased atomic density from rising temperature dominate, making the EIT width smaller.To control the variables,the experimental conditions were room temperature.
3.Results and discussion
This section introduces a Rydberg atomic microwave receiver with a stepped atomic-vapor cell to investigate receiver performance.
3.1.Determination of saturation coupling and probe laser power
Theoretically, the EIT signal intensity can be enhanced by increasing laser power, but signal intensity does not grow indefinitely.In order to find a set of saturation coupling and probe laser powers appropriate for five different lengths,Fig.3(a) presents probe laser’s power concerning absorption spectrum’s depth.It is seen that absorption depth rises with power, i.e., the more the atoms, the deeper the absorption at two energy levels.The absorption depth reaches saturation when probe power reaches a specific value (about 4.5 mW).The relationship among coupling,probe laser power,and EIT signal height is investigated as shown in Figs.3(b) and 3(c),where the EIT height can be obtained by Lorentzn fitting.It can be seen that the EIT height increases with coupling, and probe laser power, i.e., the more the Rydberg atom population,the stronger the EIT signal.When coupling,probe laser power reaches a specific value(about 105 mW,4.5 mW),the EIT height reaches saturation so as to investigate effect of Rydberg atom population.
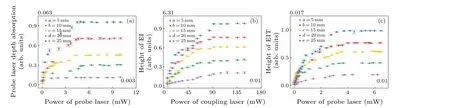
Fig.3.(a) Depth of probe laser absorption spectrum versus probe laser power.(b) The height of EIT signal versus coupling laser power.(c)The height of EIT signal versus probe laser power.The purple,green,yellow,red,and blue curves represent the five lengths of 5 mm,10 mm,15 mm,20 mm,and 25 mm,respectively in Fig.1(b).The error bars correspond to the standard deviation.
3.2.EIT signals height and FWHM
As shown in Fig.4(a),the EIT signals are obtained when coupling amd probe laser powers are 105 mW amd 4.5 mW,respectively.Figure 4(b) presents the EIT signal height experiencing an upward trend from cell length (L=5–25 mm).As is expected, the signal is coherent integration while noise is non-coherent.Thus,signal amplitude is proportional to the Rydberg atom population,and noise amplitude is proportional to root of Rydberg atom population.Power is squared to amplitude,so EIT signal height is proportional to Rydberg atom population.Notably,due to the stepped atomic-vapor cell with five different lengths under the same atomic population density, EIT signal height is proportional to the Rydberg atom population involved in the measurement.
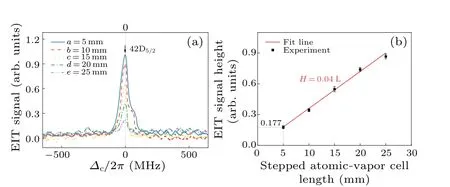
Fig.4.(a)Measured EIT signals versus coupling laser detuning.(b)Measured EIT signal height versus the cell length.The error bars representing standard deviation of EIT signal height.
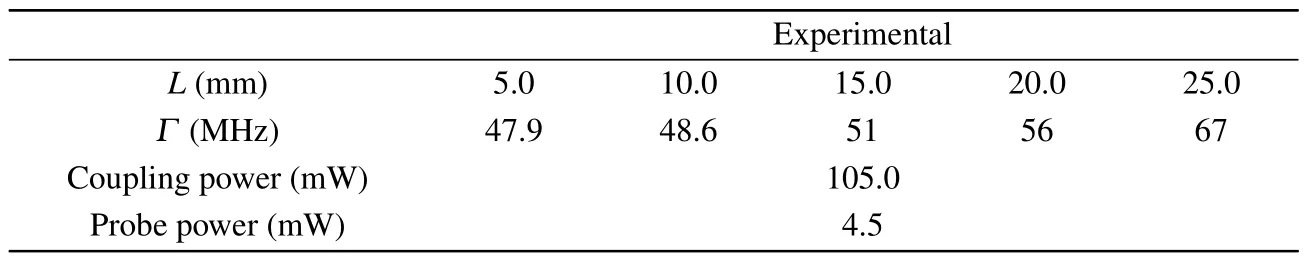
Table 1.Performance comparisons of Γ with the increment of cell length.
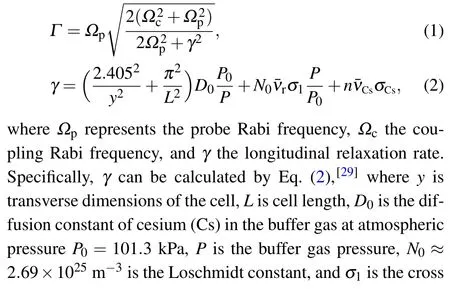
Table 1 summarizes specific evolutions of the EIT full width at half maximum(Γ)with the increment of cell length.Table 1 shows thatΓslightly rises with the increment ofL.TheΓis defined as[22]

3.3.Sensitivity of Rydberg atomic microwave receivers
In order to investigate the Rydberg atomic microwave superheterodyne receivers sensitivity, which is theoretically defined as minimum detectable power when the signal-to-noise ratio (SNR) decreases to 1, two frequency signal generators are employed as shown in Fig.2(a).The 9.937 GHz resonant frequency is selected as the local oscillator(LO)source,while MW weak signal(SIG)frequency is 9.937 GHz+13 kHz.In the time domain,electric fieldsELOandESIGare expressed as
whereAandBare the electric field strengths ofELOandESIG,fLOandfSIGrepresent their frequencies, andϕLOandϕSIGare their phases.The 13 kHz detuning frequency means that once the coupling laser is set, the probe laser intensity will oscillate at a beat-note frequency of 13 kHz.The LO and SIG signals are transmitted into a horn antenna through a resistive power divider.The output signal intensity of the detector is measured by a spectrum analyzer with resolution bandwidth of 1 Hz(one-second averaging time).Due to the AC Stark effect,the EIT will have a prominent AT splitting phenomenon when the MW electric fieldEis strong.As shown in Fig.5(a), the original EIT peak splits into two transparent absorption peaks,known as two dressed states.The AT splitting is proportional to the fieldEand is perceived as[11,30]
whereΩMWis the Rabi frequency of the Rydberg state transition,µis the transition dipole moment of the adjacent Rydberg states, ¯his the reduced Planck constant, and∆ATis AT split peak spacing.On the basis of the electric field intensity superposition,[31]the superposition fieldEatomscan be expressed as

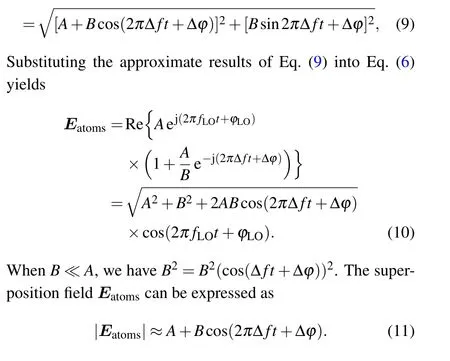
From Eq.(11), the nonlinear response of the Rydberg atom to the superposition fieldEatomscan be equivalent to envelop detection.After mixing quantum beat-note frequency signalEIF(intermediate frequency) including the amplitudeESIG,frequency offset ∆fand phase offset ∆ϕ.Once the coupling laser is set, the probe laser intensity will oscillate at a beat-note frequency, which means that the weak signalESIGcan be detected.In this paper, only the amplitudeEatomsis discussed.
From Eqs.(4)and(11)we have
whereΩDCis direct current(DC)component andΩACis alternating current(AC)component.
When the coupling laser is locked,as shown in Fig.5(a),the transmitted probe laser powerPTat the locked frequency point with different MW Rabi frequenciesΩMWis extracted.The relationship betweenPTandΩMWis obtained, as shown in Fig.5(b).Additionally, the blue dashed line is the result of the red curve linear fitting in Fig.5(b),and the purple sine function curve in Fig.5(d)depicts theΩMWwith timet,and the orange sine function curve in Fig.5(c)depicts thePTwith timet.Figure 5(b)depicts thatPTdecreases with increasingΩMW,andPTis linearly related to theΩMW, where the blue dashed line coincides with the red curve.When theΩMWis too small or too large, influenced by the shape of the EIT-AT splitting spectrum,ΩMWand thePTwill show an obvious non-linear relation.WhenΩMWis in the linear interval.The relationship ofPTtoΩDCandΩACcan be expressed as
whereκ(β) is the AC (DC) component ratio of thePTAC(PTDC),κdescribes the variation rate ofPTACwithΩAC.[22]Moreover,theκis adopted as an auxiliary reference index to characterize the superheterodyne receiver sensitivity changes.Based on Eq.(13),the greater the value ofκ,the stronger the responsiveness of the Rydberg atom to the weak electric field,and thus the better the sensitivity performance.

Fig.5.Numerical simulation response mechanism of Rydberg atoms to MW signal.
The process of the weakESIGsignal measured by the Rydberg atomic superheterodyne receiver is depicted in Fig.6.TheESIGis mapped by the Rydberg atom into fluctuations in theΩAC,which are further mapped into fluctuations in thePTACafter locking the probe and coupling laser frequency,and then into fluctuations in the photocurrent signalIACvia the photodetector.Finally,the signal in the form of the photocurrent signal power is output from the photodetector.
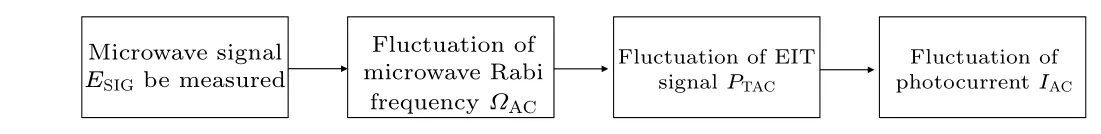
Fig.6.The process of receiving microwave signal by Rydberg atomic superheterodyne receiver.
Figure 7(a)depicts that the spectrum analyzer is utilized to gather the 13 kHz detuning frequency and amplitude of this beat-note signal by Rydberg-atom superheterodyne where purple curve, green curve, yellow curve, red curve, and blue curve refer to 5 mm, 10 mm, 15 mm, 20 mm, and 25 mm,respectively.Figure 7(b) illustrates that the beat-note signal intensity of the photodetector from the spectrum analyzer is approximately linear proportional to theESIGfor the cases with five different dimensions where∆1,∆2,∆3, and∆4refer to the difference between the blue curve and the red curve(20 mm→25 mm), the difference between the red curve and the yellow curve (15 mm→20 mm), the difference between the yellow curve and the green curve (10 mm→15 mm),the difference between the green curve and the purple curve(5 mm→10 mm), respectively.¯∆represents the mean value of the experimental data, where ¯∆1=4.1 dB, ¯∆2=3.2 dB,¯∆3=2.9 dB, ¯∆4=4.8 dB.As indicated by the curves,the beatnote signal power grows froma=5 mm toe=25 mm under the same laser power conditions.This reveals that atomic superheterodyne receiver sensitivity increases with the Rydberg atom population to a certain extent.
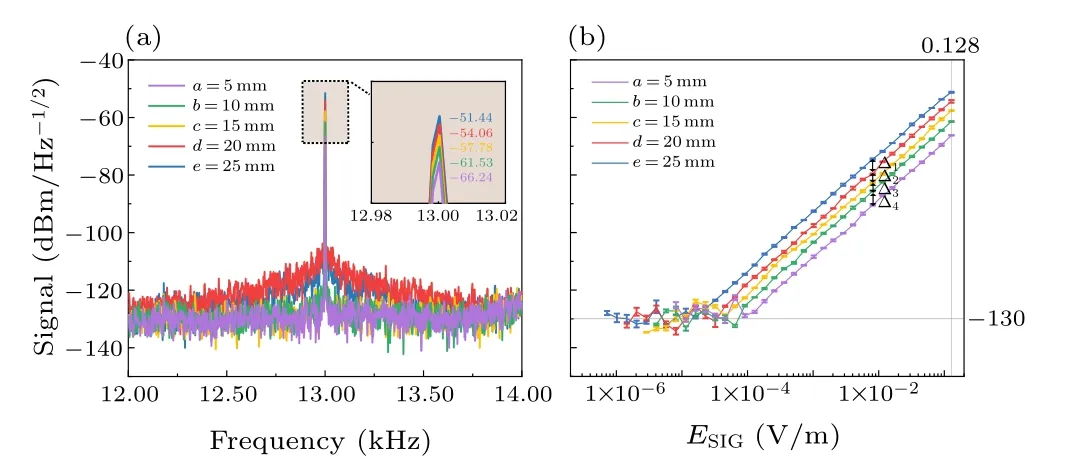
Fig.7.(a)Measured spectrum analyzer results of 13 kHz detuning frequency signal.(b)Results from the Rydberg-atom superheterodyne,the output power plots of the spectrum analyzer versus ESIG,the error bars representing the standard deviation of sensitivity.
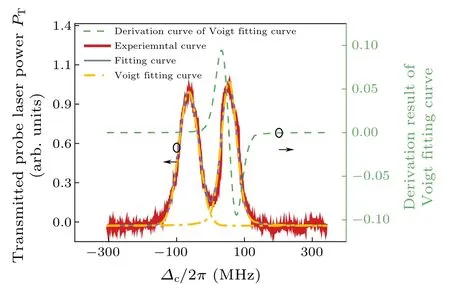
Fig.8.Experimental EIT-AT signal versus coupling laser detuning.The cell length is 25 mm.Red curve presents the experimental EIT-AT data.Yellow curve and blue curve present the fittings.Green curve presents the derivation of Voigt fitting.
To thoroughly understand the reason of sensitivity experienced an upward trend froma=5 mm toe=25 mm,a series ofE-field enhancement factors byκwith five different dimensions are calculated based on the AT splitting approach,as shown in Fig.8 and Table 2.Here,κcan be calculated utilizing a Voigt function fitting to the experimental results.The yellow curves are two roughly identically Voigt function curves,which are symmetrical regarding the∆c=0.The blue curve is the fitting to the yellow curves,and the green curve is the derivative calculation of the Voigt function.Note that the orange and blue curves fit the EIT-AT spectrum well.Thus,to some extent, Voigt fitting curve can be utilized to describe the spectrum obtained experimentally.The frequency lock-in point value 0.024(∆c=0)is theκin the green dashed line.
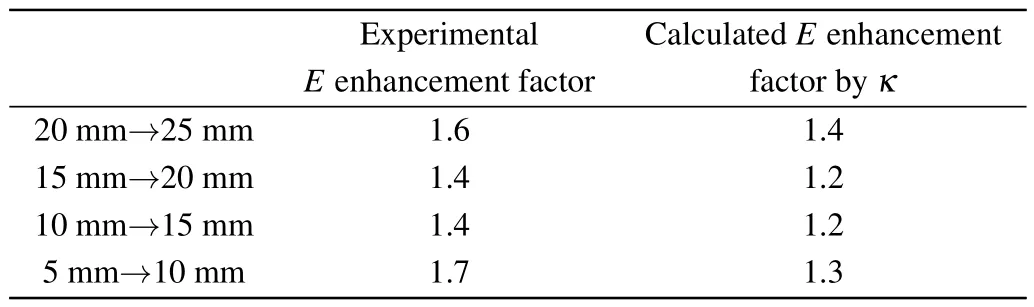
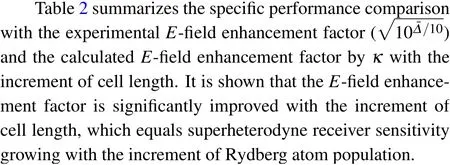
Table 2.Performance comparisons of experimental E-field enhancement factor and calculated E-field enhancement factor by κ with the increment of cell length from 5 mm→10 mm, 10 mm→15 mm, 15 mm→20 mm,20 mm→25 mm,respectively.
4.Conclusion
To summarize, we have investigated how the Rydberg atom population affects the electromagnetically induced transparency (EIT) signal height, full width at half-maximum(FWHM), and sensitivity of superheterodyne atomic sensor,under saturated laser power conditions.We propose a stepped atomic-vapor cell with five different path lengths under the same atomic population density and buffer gas pressure.Due to using a stepped atomic-vapor cell, consistency problem is solved for different cells,where the atomic population density and buffer gas pressure can be same in one cell.Importantly,we also reveal that the height of EIT signal, FWHM,and superheterodyne receiver sensitivity grow with the increment of Rydberg atom population under the same laser power conditions to a certain extent.It should be noted that despite the advantages of utilizing an atomic-vapor cell as the Rydberg atomic microwave receiver, the impact of the atomic-vapor cell itself on the measurement results is still the largest source of measurement uncertainty.[32]Additionally,it is not the case that the larger the cell length, and the greater the number of atoms in the Rydberg atom population, the better the sensitivity.On the one hand, the larger length will require more probe and coupling laser power, leading to the destruction of the optimum power weak field approximation conditions and resulting in a poor integrated EIT.On the other hand,due to the Beer–Lambert law,the laser intensity falls with the increasing transmission distance, resulting in significant difference between the probe and coupling laser powers at the two ends of the cell.This leads to the descent of integrated EIT effect.Finally, because the variation inside the vapor cell and absorption can ultimately enhance the overall uncertainty of a vapor-cell Rydberg-atom-basedE-field measurement,we cannot deny that increasing the Rydberg atom population at relatively small cell length can improve weakE-field detection capability.
We hope that the present results can serve as an important step toward understanding the complex roles of Rydberg atom population effect on ultrahigh-sensitivity Rydberg atomic microwave receivers.Finally,an exciting next step is to investigate the promising applications of quantum measurement and communication technique.
Acknowledgment
Project supported by the National Natural Science Foundation of China(Grant Nos.61901495 and 12104509).

- Chinese Physics B的其它文章
- Unconventional photon blockade in the two-photon Jaynes–Cummings model with two-frequency cavity drivings and atom driving
- Effective dynamics for a spin-1/2 particle constrained to a curved layer with inhomogeneous thickness
- Genuine entanglement under squeezed generalized amplitude damping channels with memory
- Quantum algorithm for minimum dominating set problem with circuit design
- Protected simultaneous quantum remote state preparation scheme by weak and reversal measurements in noisy environments
- Gray code based gradient-free optimization algorithm for parameterized quantum circuit