
Pedestrian lane formation with following–overtaking model and measurement of system order
2024-02-29 09:17BiLuLi李碧璐ZhengLi李政RuiZhou周睿andShiFeiShen申世飞
Chinese Physics B 2024年2期
Bi-Lu Li(李碧璐), Zheng Li(李政), Rui Zhou(周睿),†, and Shi-Fei Shen(申世飞)
1Department of Engineering Physics,Tsinghua University,Beijing 100084,China
2School of Safety Science,Tsinghua University,Beijing 100084,China
Keywords: pedestrian movement,lane formation,information entropy,order degree
1.Introduction
Pedestrian movement study has attracted considerable attention in evacuation and public safety studies.[1,2]Pedestrian movement comprises several self-organizing phenomena,such as lane formation, bottleneck gathering leading to an archshaped distribution(arching at bottlenecks),and the propagation of starting and stopping wave in walking.Some studies on pedestrian lane formation imply that lane formation can make pedestrian systems more ordered.This can be helpful in designing transport system facilities and evacuation plans.[3–5]The lane-formation phenomenon can be reproduced and studied through dynamic model and simulation.
In pedestrian modeling, there are generally two types of models.The first type is the data-driven model which is primarily developed for pedestrian trajectory prediction.[6]With the development of machine learning, advanced data-driven methods have also been developed, including deep learning, generative adversarial networks, reinforcement learning and attention mechanism.[7–11]These models usually perform well in predicting pedestrian trajectories.[12]However,when there is a need to study self-organizing phenomena in pedestrian systems and how the interaction between pedestrians will influence the evolution of pedestrian system, because the data-driven model is insufficient due to weak interpretability.The other type of model is physics-based dynamic model which is mainly developed for simulating pedestrian behaviors and studying the factors influencing pedestrian systems.Physics-based dynamic model can be developed on a microscopic scale and a macroscopic scale.[13,14]In the macroscopic model, pedestrian motion is regarded as a whole fluid flow to simulate the crowd movement using a fluid dynamics model.[15]Macroscopic model usually performs well in high-density crowd simulations.[16]The macroscopic pedestrian flow models have been used to investigate patterns in pedestrian dynamics.However, pedestrian movements in reality usually exhibit a certain degree of stochasticity.Macroscopic models describe the overall pedestrian flow from an Eulerian perspective,which cannot capture the interactions among individuals.[17]In contrast,microscopic models based on the Lagrangian perspective, such as the social force model,[18]magnetic force model,[19]lattice gas model,[20]and cellular automata,[21]simulate the pedestrian motion from the perspective of an individual by defining behavior rules for each pedestrian.[22]Hence,microscopic models play a crucial role in understanding the underlying mechanism of pedestrian motion.Due to the need of individual behavior modeling,microscopic models often introduce more parameters and require greater computational resources than macroscopic models, in order to achieve better precision.The models of understanding pedestrian flow from macroscopic and microscopic perspective are not completely contradictory.The crowd flow trend is determined by the entire system, which can statistically demonstrate the dynamic characteristics[18]of pedestrian movement.Macroscopic patterns of pedestrian flow can provide valuable guidance for modeling the microscopic interactions among pedestrians.Modeling the microscopic interactions can also compensate for the shortcomings of macroscopic models in capturing stochasticity,thus making the models more realistic in representing pedestrian movement.[23]
Previous studies on microscopic pedestrian behavior have suggested that lane formation is largely related to the following, evasive, and overtaking behavior.[24,25]Most following behavior models have used a simple mathematical relationship,such as a linear model[26]or an exponential model[27]to describe the matching of speed,distance,or direction between the follower and leader.[28]For example,the velocity direction of a pedestrian is determined by their desired direction and the average velocity of other nearby pedestrians.[29]In some studies,simulations of following behavior have been conducted by incorporating the following effect[30]and evasive effect[31]as a force added to the social force model, or by adjusting the transfer probability in the cellular automata model.[32]Overtaking behavior has not been taken into consideration in the original social force model.[33]To model the overtaking behavior, recent studies have introduced a new force into the social force model to account for overtaking behavior; however,determining the direction and magnitude of the overtaking force[34]is still under study.[35]To the best of our knowledge,most of previous studies on lane formation lack a model that combines the following behavior and overtaking behavior.
Furthermore, the influence of following behavior and overtaking behavior on lane formation has not been studied quantitatively, largely due to the lack of an appropriate quantitative evaluation metric for lane formation phenomenon.[36]The consensus that the formation of pedestrian lanes plays a crucial role in reducing conflicts and enhancing orderliness has been reached.This involves with a relationship between lane formation and system orderliness.Hence, some studies attempt to propose quantitative measures pedestrian system orderliness, such as using the distribution of pedestrian density to estimate the number of lanes and qualitatively assess the stability of the pedestrian system based on the variation in number of lanes.[37]Some studies calculate the average of the projection of pedestrian speeds in their intended direction of movement over time and over pedestrians.[38]Although such indicators do not account for conflicts or interactions among pedestrians in non-intended directions, they can provide an assessment of flow efficiency in the expected direction.Some studies evaluated pedestrian system orderliness with a color map based on velocity consistency to display the distribution of speed values and directions,which can provide an intuitive knowledge of pedestrian system orderliness.[37]While these approaches cannot fully make quantitative analyses,they provide ideas on how to find quantitative measures of pedestrian system orderliness.In the last few decades,more and more scholars have studied the pedestrian system orderliness from the perspective of lanes.By comparing the numbers of pedestrians moving in opposite directions within the same lane space,researchers have explored quantitative measure of lane formation.[39–41]Obviously, in a perfectly formed lane,all pedestrians have the same moving direction.This metric has been applied to cellular automata-based pedestrian modeling or studies in which the widths of pedestrian lanes are fixed.This is an important step forward in the quantitative assessment of pedestrian system orderliness.Recent years,information entropy has been used as a measure of system orderliness,[42]such as entropy of the proportion of pedestrians moving in different directions, velocity magnitude distribution and velocity angle distribution.[43,44]However, these quantitative methods are limited to local state descriptions of pedestrian system, mainly used in the detection of local congestion and abnormal activity.The system orderliness, stability and dynamic changing process of the entire pedestrian system, such as the phenomenon of multiple lanes overlapping and converging at narrow exits are not fully characterized.The ordering of the whole system still lacks a quantitative representation.Hence,a refined dynamic model based on physics and statistics,which combines the following behavior and overtaking behavior, as well as a quantitative metric that can accurately evaluate the lane formation of the entire system,is needed in further studies of lane formation.
For a more in-depth analysis of the lane formation phenomenon and its influence on the system orderliness,a physicsbased dynamic model that combines following behavior and overtaking behavior is proposed in this work.Furthermore,inspired by statistical mechanics,we introduce the concept of the order degree of a pedestrian system based on information entropy as a measure of the completeness of lane-formation and the orderliness of the entire pedestrian system.
The model and simulation of the pedestrian microscopic movement are verified to study the phenomenon of lane formation and influencing factors of pedestrian system.The remainder of this paper is organized as follows.In Section 2,the proposed model that combines following behavior and overtaking behavior is introduced.In Section 3,a quantitative measure of lane formation and pedestrian system orderliness is presented.In Section 4,the model is verified.In Section 5,the causes of pedestrian lane formation and its influence on the pedestrian flow are studied by using the proposed model.Finally, some conclusions are drawn from this study in Section 6.
2.Model
This section provides a detailed description of the proposed pedestrian following behavior model and overtaking behavior model.Firstly,the basic pedestrian model is briefly introduced in Subsection 2.1.We then propose the pedestrian following model in Subsection 2.2 and the overtaking model in Subsection 2.3.Next,we build a pedestrian flow model that integrates the following behavior and overtaking behavior in Subsection 2.4.
2.1.Generic pedestrian flow model
The pedestrian flow simulation paradigm is established based on the widely used social force model,[45]which regards pedestrians as particles and models their interactions by using the social forces,namely,the driving forceF0,which propels pedestrians towards their destinations,the repulsive forceFR,which helps maintain a certain social distance between pedestrians, the extrusion forceFE, which prevents the pedestrians from overlapping, and the friction forceFV, which simulates the slowing down of pedestrians caused by relative motion.Letmiandvidenote the mass and velocity of pedestriani,respectively, and lettindicate time, then the basic pedestrian movement model will be able to be written as
In the subsequent studies,[46–49]the social force model has been further developed by adopting the research methods from fluid dynamics.Empirical formulas have been derived as follows:
Here,v0i=v0i eirepresents the desired velocity of pedestriani,which is determined by their desired walking speedv0iin the target directionei.The relaxation time is denoted asτi,characterizes the rate at which a pedestrian can accelerate.PRis the psychological pressure caused by the desire to keep social distance from others.PEis the pressure due to physical contact that prevents pedestrians from getting too close.[50,51]The viscosity coefficientµin the friction term is used to describe the influence of relative motion on pedestrian flow.
2.2.Following behavior model
The following behavior is a crucial aspect of pedestrian flow.Studies have shown that pedestrians’ self-organizing phenomena,such as lane formation,right-hand preference[46](which is influenced by social culture), and herding behavior during evacuation, are closely related to following behavior.[47]Pedestrians have a tendency to follow others to a certain extent while walking.In contrast to previous studies where pedestrians were believed to follow the average moving direction and speed over them,which,we think,is a rough assumption.A new following behavior model realized with attraction is proposed in this subsection.
In this study,it is assumed that the behavior of following others arises from the attraction of other pedestrians.Hence,following behavior can be simulated through the attraction exerted on pedestrians by those being followed.Previous researches have shown that the attraction is related to the distance and direction of other pedestrians.[30]To reproduce these characteristics,we use an attraction model that is analogous to the force of gravity as depicted in Fig.1.The inverse square law of gravity is able to represent the attraction exerted from another object on the subject and it accounts for the influence of distance between the two objects.Analogous to the gravity model, the attraction model that simulates the following behavior is established.The following assumptions have been made.
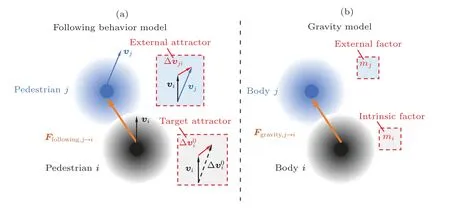
Fig.1.Analogy between(a)following behavior model and(b)gravity model.
(i)Perception area
Following behavior will only be triggered off by movements within the pedestrians’attention.
(ii)Velocity attraction term
A velocity difference is identified as the primary factor that triggers off the following behavior.For subject pedestriani,the difference between their current velocity and desired velocity serves as the self-driven motivation for following others,namely the target attractor as indicated in Fig.1.The velocity difference between pedestriansiandjacts as an external attractor that causes the following behavior.To represent this relationship, we analogize the velocity difference to a mass in gravity as the cause of attraction.The term describing this relationship is denoted byTv.
(iii)Distance decay term
The distance between pedestrianiandjis denoted asdij.Closer pedestrians have a greater influence due to the attention distribution of the subjecti.[30]This relationship is described byTr=d2i jin the denominator.This reflects the inverse square law of the attraction force among pedestrians, indicating that pedestrians tend to follow those who are closer to them.Therefore, the pedestrian whose distance to pedestrianiis smaller will produce a greater attraction to pedestriani.When pedestriansiandjare in contact with each other, pedestrianjhas the greatest influence on pedestriani.
(iv)Direction term
Pedestrians whose positions align with the aimed direction of pedestrianihave a greater attraction to pedestriani.This relationship is described byTd.
(v)Characteristic acceleration term
The pedestriani’s self-accelerating capability is represented by the characteristic acceleration timeτi, and can be expressed as 1/τispecifically.
Taking into account these influencing factors,the following attraction force exerted on pedestrianiby pedestrianjcan be expressed as
Next, we will provide a detailed explanation of terms in Eq.(3).
2.2.1.Perception area
When pedestrians walk forward,they may not pay attention to what is happening behind them,because the visual angle of the pedestrian is less than 360◦.Based on ergonomics,the attention-range angle of a pedestrian is typically set to 120◦.[52]In this study, the perception area of a pedestrian is defined as the sector area with a visual angle of 120◦and a radius ofRperception(see Fig.2).Only the particles inside the perception area can influence the movement of pedestriani.

Fig.2.Illustration of pedestrian following model.
2.2.2.Velocity attraction term
The following attraction of a pedestrian is induced by the difference between two velocities.First, pedestrianihas an intended velocityv0i.Any deviation from this velocity is represented by the difference betweenviandv0i, and can create a psychological motivation for pedestrianito change their velocity.This motivation is quantified as the absolute difference between the intended velocity and the actual velocity, oracting as a target attractor.The attractor becomes stronger as the difference between the intended velocity and the actual velocity increases,indicating a greater willingness of pedestrianito be accelerated.If the actual velocity of pedestrianiis equal to their expected velocity, pedestrianiwill not exhibit the tendency to follow other pedestrians.Next,considering the interactions between pedestriansjandi,vj-videnotes the relative velocity of pedestrianito particlej.In Fig.3(a), the intended acceleration direction of pedestrianiis represented by the unit vector obtained fromFigure 3(c)illustrates the velocity component difference between pedestriansjandiin the direction of pedestriani’s intended acceleration.This is represented by the inner product ofvj-viand.A positive value of this velocity component difference indicates that pedestrianjis faster than pedestrianiin the expected acceleration direction of pedestriani.This higher relative velocity makes pedestrianjmore attractive to pedestriani, as the space around pedestrianjis assumed to have a higher traffic efficiency.This aids pedestrianiin choosing a better heading direction and bypass obstacles.Hence,the attraction of pedestrianjto pedestrianiis assumed to be high.Considering the factor of the difference between these two velocities, which triggers off the attraction from pedestrianjtoi, the velocity attraction termTvcan be formulated as follows:

Fig.3.Illustration of velocity relationship between pedestrians.(a) Intended direction of acceleration for pedestrian i, (b) projection of pedestrian j’s velocity onto the intended direction of pedestrian i’s acceleration,and(c)difference in velocity component between pedestrians i and j in the direction of pedestrian i’s intended acceleration.
2.2.3.Direction term
When pedestrians are walking,they are more likely to follow the position of other pedestrians rather than their velocity direction, since position is a more intuitive observation.In this study,the following behavior is modeled as the process of pedestrians being attracted by other walkers, and eventually,velocity consistency can be achieved through the convergence of their positions.The attraction exerted from pedestrianjon pedestrianipoints fromitoj,which can be represented by the direction vectorei j.The degree to which pedestrianiis willing to follow pedestrianjdepends on how closely the force directioneijaligns with the intended direction of pedestriani,e0i.When the force direction is more closely aligned withe0i, pedestrianiis more likely to follow pedestrianj, as this following behavior will be regarded as more helpful for pedestrianito reach his destination.The inner product〈ei j,e0i〉represents the cosine of the angle between the attraction direction and pedestriani’s intended direction, indicating the degree to which the force direction is close to the intended direction.The attraction increases when the angle betweeneijande0iis small.Therefore,the direction term of the following behavior can be expressed as〈ei j,e0i〉·ei j.
2.2.4.Following attraction
For pedestriani,the decision to perform following behavior involves selecting targets to follow within the perception area,and the attraction is then determined by the factors mentioned above.When many pedestrians are present in pedestriani’s perception area,pedestrianimakes an overall assessment of the pedestrian motion.Thus, the influence force of pedestrianjon pedestriani,Ffollowing,j→i, should be vector summed to reflect the overall influence, as shown in the following equation:
2.3.Overtaking behavior model
For obstacles or slow pedestrians ahead, it is important to combine an avoidance mechanism and a direction-selection strategy to assist pedestrian particles in executing overtaking behavior.[25]Unlike previous studies that only involved a simple choice of overtaking from the left or right,this study introduces a refined overtaking model based on the spatial assessment of space, aiming at achieving the more accurate modeling of overtaking behavior.Figure 4 illustrates the overtaking behavior model.The following assumptions are considered in the overtaking behavior model, as done in the following behavior model.
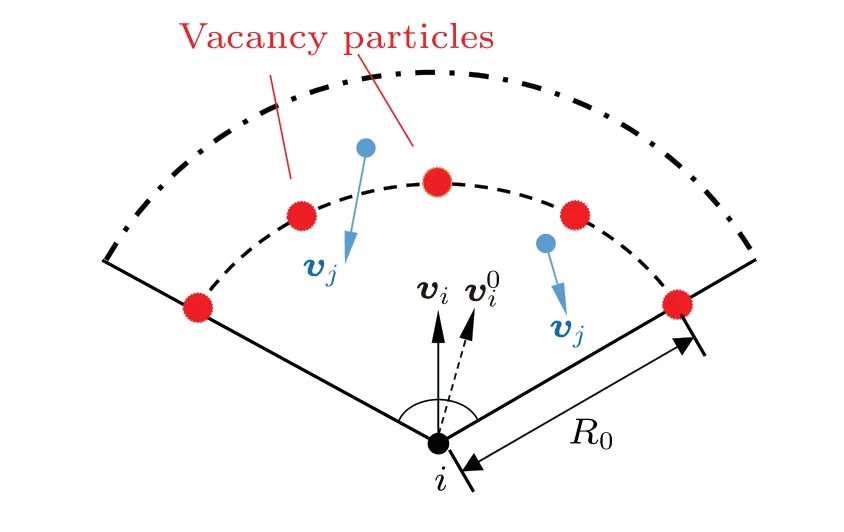
Fig.4.Illustration of pedestrian overtaking model.
whereτiis the characteristic acceleration time of pedestriani.K1is a coefficient controlling the magnitude of following attraction to maintain consistency with other forces during pedestrian movement.K1is set to 1 in units of(m·s).
Next, we will provide a detailed explanation of these terms.
(i)Perception area
As mentioned above, only movements within the attention range of pedestrians will be perceived.Hence,pedestrians inside this area are considered to influence pedestriani’s overtaking behavior.The setting of perception area is the same as that of the following behavior model.
(ii)Space assessment
When pedestrians decide to overtake,they will assess the degree of space occupancy situation in front of them and select the direction with the largest vacant space.In addition,the preference of overtaking from the left side rather than the right side should be considered in the spatial assessment (for pedestrians from the right-side preference cultures).
(iii)Density term
A low density is a crucial factor that attracts pedestrians and is denoted byTρ.
(iv)Velocity difference term
Hence, the norm of the velocity difference between pedestriani’s current and expected velocity can reflect the tendency to accelerate and is denoted byTv,
Next, we will provide a detailed explanation of these terms.
2.3.1.Space assessment
To assess the space in front of pedestriani,we introduce virtual vacancy particles denoted ask.The vacancy particles are not particles that physically exist in front of pedestriani.Each vacancy particle is a virtual particle that can represent the space on an arc with a radius ofR0in front of pedestrianiwithin a 120◦view angle.The straight ahead direction of pedestrianiis designated as 0◦, with vacancy particles set at-60◦,-30◦, 0◦, 30◦, and 60◦angles shifting from the direction ofvias shown in Fig.4.Vacancy particles possess physical attributes such as densityρk,passand coordinaterk.The overtaking behavior is modeled by the attraction of vacancykto pedestriani,which imposes an overtaking termFi,overtakingon the acceleration of pedestriani.
2.3.2.Density term
The vacancy density, denoted asρk, represents the local density generated by other particles at that point,which can be calculated from
whereβis the coefficient in which the tendency of left-side overtaking behavior is taken into consideration.For vacancy particles situated at angles of-60◦,-30◦, 0◦, 30◦, and 60◦,the values ofβare to 1.1, 1.2, 1.0, 0.9, and 0.8 respectively,so as to represent the tendency of left-hand overtaking.ρjrepresents the density exerted by elementjinside the perception area.For pedestriansiandj,〈vi-vj,v0i〉represents the difference betweenviandvjin the intended direction of pedestriani’s movement.As illustrated in Fig.5(a), when〈vi-vj,v0i〉is positive,pedestrianj,who is in front of pedestriani,walks more slowly than pedestrianiin the pedestriani’s intended direction of movement,including the case wherein pedestrianjwalks towards pedestriani.Consequently, pedestrianjhinders pedestrianifrom walking, which is equivalent to an increase in the density that pedestrianiperceives.If〈vi-vj,v0i〉is negative, which is shown in Fig.5(b), pedestrianjmoves faster than pedestrianiin the pedestriani’s intended heading direction.Thus, pedestrianjdoes not impede pedestriani’s movement.The equivalent density pedestrianifelt owing to pedestrianjshould be less thanρj.In view of this factor,we take e〈vi-v j,v0i〉as a coefficient to adjust the density stimulated by pedestrianjat vacancyk.Ifjis a static barrier particle i.e., its speed is 0, no correction is applied to the perceived density associated with objectj’s speed.By combining the tendency of the left-side overtaking behavior and the influence of pedestrian velocity on density perception,we derive the vacancy densityρk,pass.When pedestrians determine the overtaking direction, a higher vacancy density indicates a smaller space and a lower likelihood of successful overtaking.Therefore,the vacancy particle with the minimum density should be selected.We denote the critical densityρcas the density exerted by pedestrianjwhen pedestrianiandjcome into contact exactly,i.e.,dij=2ri.The vacancy density termTρis given as follows:

Fig.5.Illustration of influences of different velocities on perceived density.(a)Case wherein pedestrian j obstructs the walking of pedestrian i, resulting in an increase of perceived density.(b) Case wherein pedestrian j does not obstruct the walking of pedestrian i,resulting in adecrease of perceived density.
2.3.3.Overtaking force
Taking into consideration all the factors in (i)–(iv), the overtaking attraction force can be formulated as follows:
whereK2is the sensitivity factor used to adjust the magnitude of the overtaking behavior force in units ofeikrepresents the direction from pedestrianito vacancykwith a minimumρk,pass;rikis the distance between pedestrianiand the vacancy particle with the minimumρk,pass.
2.4.Combined following and overtaking behavior model
In this study,by integrating the above following behavior and overtaking behavior models described above,we develop a pedestrian hydrodynamic simulation model,which is represented as follows:
A selective decision mechanism is employed to model the decision of following or overtaking as shown in Fig.6.

Fig.6.Pedestrian self-organizing movement simulation model that takes into consideration the following behavior and overtaking behavior.
In this model, the choice of following or overtaking is dependent on the velocity of the pedestrians.Usually,〈vj,v0i-vi〉>〈vi,v0i-vi〉 implies that pedestrianjwalks faster than pedestrianiin the intended direction of pedestriani’s movement as illustrated in Fig.3(c).Therefore, pedestrianimay choose to follow pedestrianj.However, taking into account the individual difference, pedestrians may possess varying degrees of tolerance towards a pedestrian walking in front of them at a slow speed.Hence, a parameter called the low-velocity boundary (denoted byα) is introduced as shown in Fig.6.The parameter indicates the extent to which pedestrianican tolerate a slow movement velocity of the pedestrian in front of them.The low-velocity boundaryαrepresents the minimum proportion of the velocity of pedestrians walking ahead that pedestrianican tolerate while following,compared with the pedestriani’s own velocity.For instance,α=0.6 means that pedestrianiwill follow pedestrianjinstead of initiating overtaking behavior unless〈vj,v0i-vi〉>60%·〈vj,v0i-vi〉,which implies that the velocity component of pedestrianjin the expected acceleration direction of pedestrianiis bigger than 60% of pedestriani’s velocity.When the low-velocity boundary is high,pedestrianiis assumed to have a preference for following high-velocity pedestrians.As a result, pedestrianiwill have less patience for slow pedestrians ahead of them and will be more likely to engage in overtaking behavior during movement.If the lowvelocity boundary is set to a low value,a slow pedestrian ahead is more acceptable for pedestriani, and they are more likely to exhibit following behavior in the case of slow pedestrians walking ahead of them.Thus,the low-velocity boundary plays an important role in the decision-making process of following or overtaking.When〈vj,v0i-v0i〉>α·〈vj,v0i-vi〉, pedestrianichooses to follow pedestrianj; hence,jis included in the following model.Otherwise, pedestrianjis included in the computation of the overtaking model.In the simulation of pedestrian flow, the low-velocity boundary can specify the characteristics of pedestrians in terms of their aggressiveness or ease.This can also be employed to describe the urgency of an evacuation event.For example, in an emergency situation such as a fire or earthquake, under the pressure of the need to escape, pedestrians may be very eager to overtake pedestrians walking ahead of them and have a notably low value ofα.By incorporating a low-velocity boundary into the pedestrian model,the following behavior model and overtaking model are successfully integrated into pedestrian hydrodynamics to simulate diverse pedestrian movements under different circumstances.
3.Measure of pedestrian system order based on information entropy
The orderliness of pedestrian system is a crucial topic in pedestrian flow research.Lane formation, one of the selforganizing movements of pedestrian system, which describes the phenomenon that pedestrians spontaneously form lanes during collective motion,is one of the typical phenomena that make pedestrian movement more organized.[53]From the perspective of pedestrian lanes, a measure of pedestrian system orderliness is developed based on information entropy.
According to the idea of the optimal lane formation pattern,[39]the phenomenon that pedestrians are uniformly arranged in rows, as depicted in Fig.7(a), is taken as the most ordered state of pedestrian system.The pedestrians in each lane have exactly the sameycoordinate,the pattern of which is defined as the complete lane-formation situation.However,it is difficult for pedestrian system to achieve such a perfect state.In most cases, although pedestrians form lanes during movement, the pedestrians in one lane stay around the middle of the lane instead of walking exactly along the mid-line of the lane as shown in Fig.7(b).This state is referred to as the partial lane-formation situation.As the pedestrian system becomes less orderly,randomness in pedestrian movement increases, pedestrians in one lane walk farther away from the middle of the lane.It can be difficult to identify lanes.In the extreme case of disorder,where no lane is formed,pedestrians are randomly distributed as illustrated in Fig.7(c).
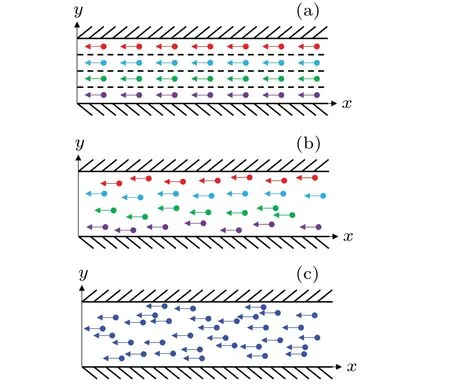
Fig.7.Illustration of pedestrian lane-formation status.(a) Pedestrian distribution in complete lane-formation situation.(b)Pedestrian distribution in partial lane-formation situation.(c)Pedestrian distribution in the case of no lane formed.
Pedestrian movement produces trajectories that can be used to represent the lane-formation status.The distribution of pedestrian trajectories reflects the formation of pedestrian lanes when pedestrian trajectories are densely distributed.For a cross-section of a path or road, the probability of pedestrians passing through the center of the lane is high, while the probability of passing through the edge of the lane is low.The kernel-density estimation method can be used to convert a discrete pedestrian distribution into a continuous density distribution curve.This curve represents the probability density distribution of the pedestrians,p(y),which indicates the likelihood of pedestrians passing through different locations on the path or road.Then the probability density distribution is normalized to ensure that the total probability is equal to one, thus making it suitable for statistical analysis and modeling.In the case of complete lane formation,pedestrian trajectories should gather in the center of each lane.Figure 8(b) shows the corresponding probability density distribution of the pedestrians in each lane and path.For the case of no lane formation, the probabilities of pedestrian trajectories appearing anywhere on the path are equal.Consequently, the probability density distribution in the lane and path should be identical,as illustrated in Fig.8(b).
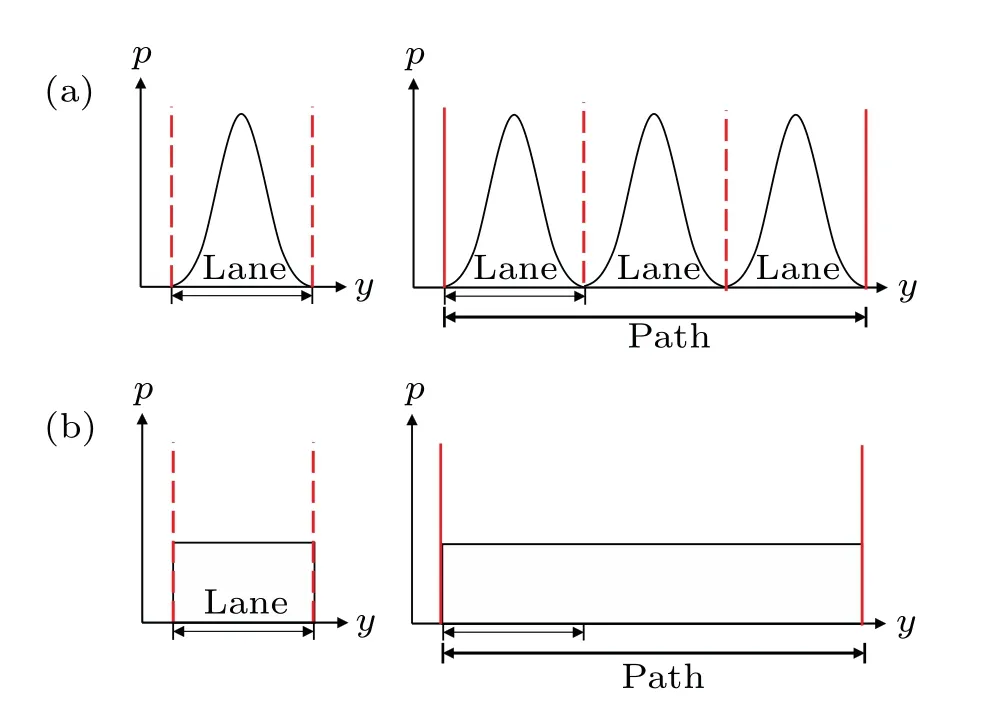
Fig.8.(a) Probability density distribution in one lane and in the path with three lanes in the case of complete lane formation.(b)Probability density distribution in one lane and in the path in the case of no lane formed.
To quantify the orderliness of the pedestrian system with respect to the lane formation status, this study proposes the use of a quantified measure based on information entropy.The measure is described as follows.
(i)Determination of lanes
As mentioned above, the probability density distribution of pedestrians reflects the state of the lane formation.A kernel function is used to estimate the probability density function of the pedestrian trajectory distribution.Pedestrian trajectories cluster to form lanes,which act as peaks in the probability density distribution.To determine the number and position of pedestrian lanes,peaks at a distance greater than 0.6 m are selected to ensure that the space between lanes is greater than the shoulder widths of the pedestrians.This can aid in determining the number and position of pedestrian lanes.The number of lanes formed by the pedestrian movement is equivalent to the number of peaks present in the probability density distribution.Then thek-means clustering method is adopted to segment the pedestrian trajectories into different lanes, with the cluster centroids representing the central trajectories of each lane.
(ii) Lane formation rate of pedestrian trajectory distribution based on information entropy
In this study, a quantitative measure of lane formation based on information entropy is proposed.Information entropy is a measure of the degree of uncertainty or randomness in a system, and calculated based on the probability density distribution.It can be used to quantify the orderliness of the pedestrian system.Therefore, we define the entropy of the pedestrian system at eachxas follows:
wherep(y)is the probability density distribution of the pedestrian trajectories along the coordinateyatx.When pedestrians form lanes well, the probability of pedestrian trajectories appearing in the center of the lanes is high, leading to a lower level of uncertainty in the pedestrian system.Hence, the information entropy of the system is small.In the case of complete lane formation, the pedestrian trajectories in each lane cluster appear around the central trajectory.The minimum information entropy of the pedestrian system atx, denoted asSmin(x),can be calculated.In contrast,a poor lane-formation state means that pedestrian trajectories have an average probability of appearing anywhere in the path.In the case of no lane formation,the maximum information entropy of the pedestrian system atx,denoted asSmax(x),can be calculated by using the same trajectory appearance probability.To describe the completeness and orderliness of the lane formation at positionx,the lane formation rate,η(x),is defined as
(iii)Order degree of pedestrian system
In this paper,we propose a metric called the system order degree,which serves as the order parameter of the pedestrian system.The system order degree is defined as the combination of the current lane-formation state and the differential of the lane-formation rate,and specifically expressed as
whereηis the lane formation rate,andηxis the differential of the lane formation rate along the forward direction.The lane formation rateηis a measure of the orderliness of the pedestrian lane-formation state at the current position in a steady state.When stable lanes are formed along the walking path,the pedestrians’traveling directions exhibit good consistency,resulting in a stable value of the lane formation rateη, withηx ≈0.The system order degreeω ≈η, reflecting the current degree of orderliness in the pedestrian movement system.This implies that when the lane formation state is stable, the pedestrian movement with a larger value ofηis more ordered.Another common scenario is that the steady state of the pedestrian lane can be disrupted by external disturbances,such as a change in the path shape or the presence of obstacles.In such cases, pedestrians enter a new state after a disturbance.Between the old state and the new state,the dynamic processes,such as lane changing, overlapping, decomposition, and rearrangement occur through pedestrian self-organizing movement.Pedestrians leave their original lanes to reach other positions in response to disturbances.In such situations,the lane formation rateη,which reflects the pedestrian distribution,is insufficient to comprehensively describe the orderliness of the pedestrian system.The absolute value of the differential of the lane formation rate, denoted as|ηx|, which represents the changing rate of the lane formation rate along the moving direction of pedestrian,constitutes another aspect of the system order degree.A non-zero value of|ηx|indicates that the value ofηvaries along the walking direction, implying that pedestrians have not only forward velocity but also lateral velocity.The lateral velocity produces lateral displacement, which results in a change in the lane-formation rateη.A larger|ηx|value indicates a more drastic change in pedestrian lanes,implying that pedestrians exhibit more conflict behaviors, such as lateral intersections and overlapping trajectories.This naturally results in a decrease in the degree of orderliness of the pedestrian system.Theoretically, the extreme of pedestrian chaos should be defined as the zero state of the system order degree.Thus, whenηx →∞, the value ofωapproaches 0.Hence, the system order degreeω=η· e-|ηx|comprehensively describes the order degree of the pedestrian system,taking into account both the lane formation rate and the degree of change in the lane formation rate.
4.Model validation
In this section,the pedestrian movement simulation is validated.In simulations,we have to set boundaries for the movement of pedestrians,such as walls or obstacles.These boundaries are impossible for pedestrians to pass through.The constraints on pedestrian particle motion,imposed by the boundaries, can be realized by placing stationary particles with a large mass.In all of our simulation tests, we have used stationary particles with a spacing of 0.1 m and a mass of 500 kg to simulate the boundaries of pedestrian movement,[51]to ensure the constraints of boundaries on pedestrian movement and the uniform distribution of boundary density.For model validation, we first conduct a simple evacuation simulation in a 15 m×15 m room.In this test case,pedestrians are randomly initiated in the room, and the exit is located in the middle of the right wall as shown in Fig.9(a), the initial density distribution of pedestrians is relatively uniform.The exit door is set to the destination of all the pedestrians.Our program successfully reproduces an important self-organizing phenomenon in which pedestrians gather to form an arch[54]at the exit (see Fig.9(b)).
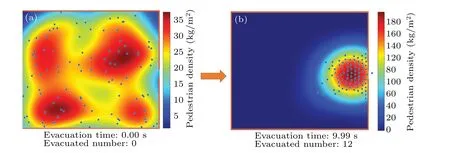
Fig.9.Snapshot of evacuation simulation.(a)Distribution of initial pedestrians and their density.(b)Arching at the exit and the distribution of pedestrian and their density.

Fig.10.Setup of evacuation experiment.
To further validate the proposed pedestrian flow model,we compare the simulation result with a real-world evacuation experimental result reported in Ref.[55].The evacuation experiment was conducted in a university in 2015.Ten trials were carried out with a total of 419 participants.Each trial involved approximately 40 participants.The setup of the reallife evacuation experiment conducted in a university is adopted in our simulation and shown in Fig.10.A pedestrian initialization zone of 3 m×3 m is placed in the center of a room with a size of 5 m×5 m,and a 1.2-m-wide exit is set on one side of the wall.[55]According to the experimental set,41 pedestrian particles are randomly generated in the pedestrian initialization zone.The evacuation process is simulated with the model proposed in this paper (simulation I) and a pedestrian model without the proposed following-overtaking mechanism(simulation II).The relationship between the number of evacuated pedestrians and the evacuation time is recorded.10 runs under the same setup are performed for each case,and the evacuation times are averaged.
Results are shown in Fig.11.The red line represents the data obtained from the real-world evacuation experiment,showing the correlation between the number of evacuated persons and the corresponding evacuation time.The blue line(simulation I), which closely aligns with the red line with RMSE = 0.18, represents the results obtained in simulations with the proposed model in this paper.The gray line (simulation II), which deviates from the experimental results with RMSE = 3.02, is the simulation result by using a pedestrian model without the proposed following-overtaking mechanism.It can be seen that after incorporating the following-overtaking mechanism, the simulated evacuation time of pedestrians becomes more consistent with the result of the real-world experiment.And the simulation results are more stable.This validates that the proposed model can simulate pedestrian movement well.

Fig.11.Measured and simulated evacuation time plots.
We also conduct a fundamental diagram validation of a bi-directional flow in a 50-m-long,4-m-wide corridor as illustrated in Fig.12(a).Pedestrian particles are randomly initialized in pedestrian initialization zone at the left end and right end of the corridor with varying arrival rates in each simulation run.The expected speed of all pedestrians is set to 1.36 m/s,and the intended direction is set in the middle of the opposite exit.Pedestrian particles on the left side and right side of the corridor walk in opposite directions as depicted in Fig.12(b)att=8 s.We designate the central 10-m region of the corridor as the region of interest(ROI).When pedestrians from both sides reach the ROI,the pedestrian system enters a transient chaotic state due to interactions and conflicts among pedestrian particles as illustrated in Fig.12(b) att=25 s.The influence of following behavior and right-hand preference guides the pedestrian system to evolve and become self-organized.After leaving the pedestrian initialization zone, pedestrians spontaneously move to the right within the bi-directional flow transition zone,forming distinct lanes.Upon reaching the ROI,the bi-directional pedestrian flow establishes a stable lane pattern as shown in Fig.12(b)att=50 s.The trajectories of the stable bi-directional flow within the ROI are illustrated in Fig.12(c).Fig.12.Lane formation of bi-directional flow simulation in corridor.(a)Simulation layout.(b)Snapshot of bi-directional pedestrian flow.(c)Pedestrian trajectory distribution at a stable state in ROI.
Fifty seconds after the simulation program is initiated,the pedestrian flow reaches a steady state.The arrival rates of pedestrians at both ends of the corridor are varied in different runs to obtain different densities of pedestrian flow.The density, velocity, and flow of pedestrians in the ROI are then averaged over a certain period of time to obtain the velocity–density and flow–density fundamental diagrams of the bidirectional pedestrian flow as demonstrated in Fig.13.When the average pedestrian density increases to about 4.2 ped/m2,the pedestrian system will encounter congestion and cannot form lanes and bi-directional flow.The simulated fundamental diagrams are also compared with experimental data to validate the proposed model.
The blue line in Fig.13 demonstrates the fundamental diagram from Weidmann,[56]which is obtained by collecting data from 25 other experiments and fitting the Kladek formula, a macroscopic function that describes the relation between average momentary speed and density of traffic.The data marked in red are derived from BaSiGo,a real-world experiment conducted in D¨usseldorf with approximately 2000 university students as participants.[57]The blue stars represent statistical data obtained from the simulation.It can be observed that the velocity–density and flow–density fundamental diagram of the simulation are consistent with the results from Weidmann and the BaSiGo experiment.The average speed of pedestrians decreases with the increase of pedestrian density.Moreover,the flow of pedestrians first increases with density increasing.After the pedestrian density reaches a critical value, the flow of pedestrians remains relatively stable.Furthermore,a comparison of the simulation results with those of other models[37,50](as demonstrated in Fig.14)also validates the reliability of the proposed pedestrian movement model.

Fig.13.Comparison between fundamental diagram of proposed model and plot of experiment result.

Fig.14.Comparison of fundamental diagram between proposed model and other models.
5.Results and discussion
This section describes the case studies we conducted using the proposed model.Firstly, we simulate a bi-directional pedestrian flow in a 4-m wide corridor to study the pedestrian lane-formation phenomenon.An obvious lane-formation phenomenon is observed in Fig.12.The pedestrian density distribution of the bi-directional pedestrian flow is presented in Fig.15(a).The trajectories are divided into lanes byk-means clustering, and the lane division is illustrated in Fig.15(b).As shown in Fig.15(c), the width of the corridor is constant,the ROI is sufficiently far from the exit, and the motion of the pedestrian system is unaffected by the environment layout.Consequently,the lane formation rate of the ROI is nearly constant along the corridor.Therefore,the influence of the differential of the lane formation rate can be neglected, and the lane formation rate is employed to measure the completeness of the lane formation.The average value of lane formation rate at allxpositions is regarded as the lane formation rate of the pedestrian system in each run.
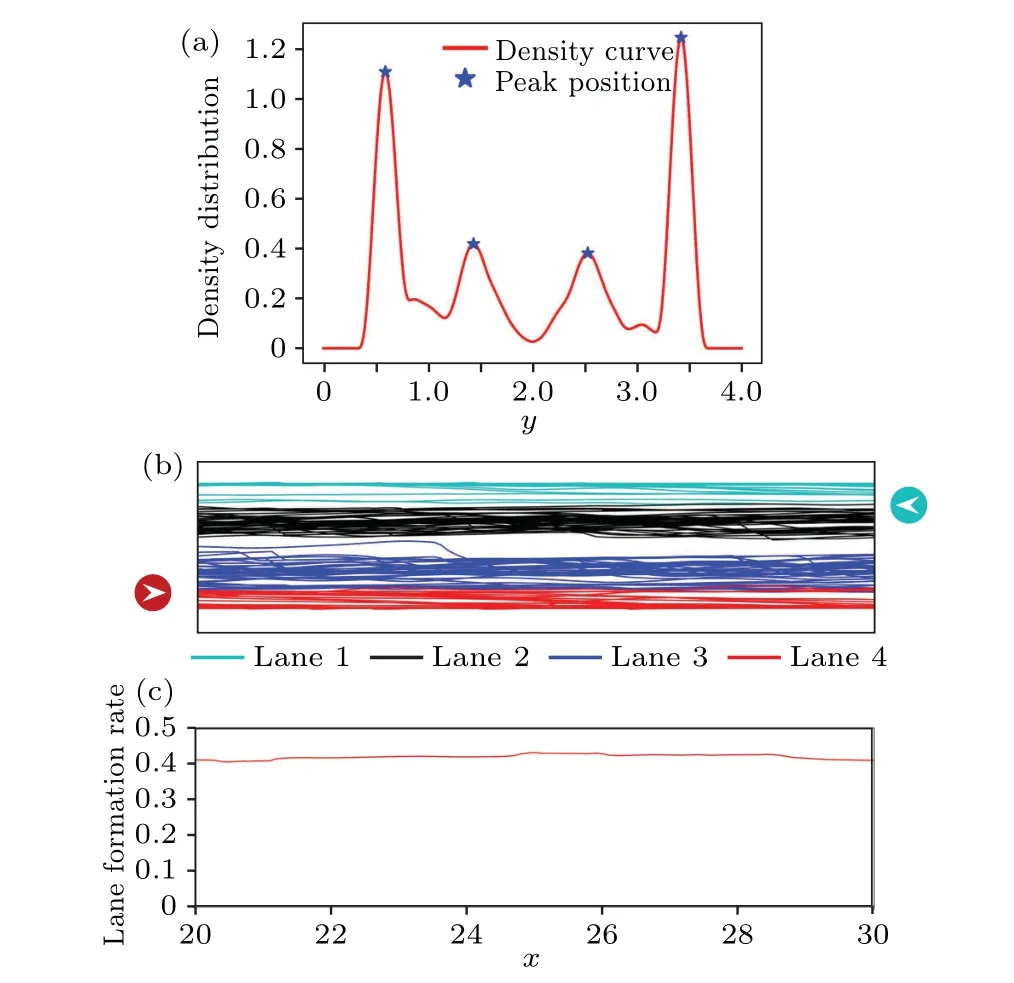
Fig.15.(a)Pedestrian density distribution in cross-section of corridor.(b)Lane division of bi-directional pedestrian flow.(c)Lane-formation rate along corridor.
After adjusting the model parameters,the simulation program is run several times.Fifty seconds after the simulation starts, 100 pedestrian trajectories are tracked in the ROI,and the lane-formation rate of the system is calculated.The lane-formation rate of each run is then averaged to obtain the lane-formation rate under specific circumstances and to study the factors that influence lane formation.Snapshots of the pedestrian and trajectory distribution at different lane formation rates are shown in Fig.16.It can be observed that the lane formation rate provides a good representation of the pedestrian system’s orderliness.A high lane formation rate indicates that the pedestrians move with better orderliness.The lane formation rate of the pedestrian system can be influenced by the parameters of following-overtaking model.
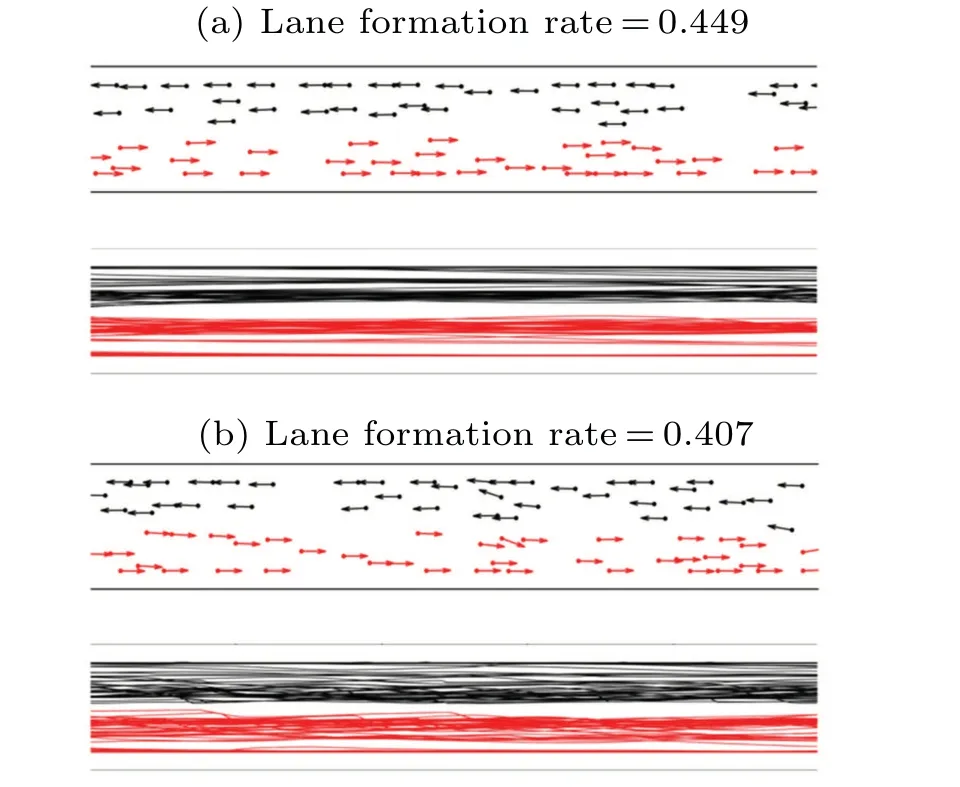
Fig.16.Snapshots of pedestrian and trajectory distribution at different lane formation rates.(a)Snapshots under α=1,K1=1,lane formation rate=0.449.(b)Snapshots under α =1,K1=0,lane formation rate=0.407.
5.1.Influence of following behavior on ordering of system
The following accelerationai,followingcan be adjusted by changingK1in Eq.(5)to study the effect of the magnitude of following behavior on lane formation.The simulation results are presented in Fig.17.WhenK1=0,the following behavior is turned off in the model.Although not obvious, the laneformation phenomenon still occurs as shown in Fig.16(b).This finding demonstrates that the avoidance behavior also contributes to the lane formation to a certain degree.With the increase ofK1, the pedestrians’ acceleration is more influenced by following behavior, and the lane formation rate of the bi-directional flow also increases, resulting in a more orderly pedestrian system as shown in Fig.16(a).This study indicates that the following behavior is an important factor that promotes the lane formation.
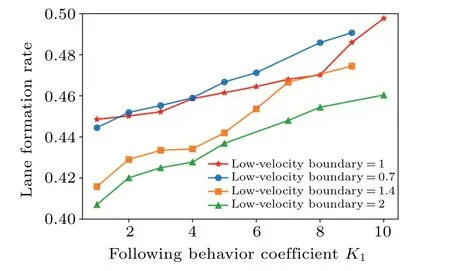
Fig.17.Influence of following behavior on lane formation.
5.2.Influence of low-velocity boundary on lane formation
As described in the model in Subsection 2.3, the lowvelocity boundary can reflect the aggressiveness of pedestrians.Hence,the following behavior model and overtaking behavior model can be integrated by using a low-velocity boundary to determine the following behavior or overtaking behavior triggered off by pedestrians walking ahead.The low-velocity boundary of pedestrians is adjustedin the simulation under running.The average lane formation rate of several simulation runs under the same conditions is calculated, and the results are presented in Fig.18.The red stars represent the simulation data points under the conditionK1=1.The figure can be roughly divided into two parts by the line near the low-velocity boundaryα=0.70.In the part where the lowvelocity boundaryα<0.70,the boundary for judging low velocity is low,and pedestrians tend to follow others even if they move at a relatively low velocity.In this situation,pedestrians have no choice in choosing the leader to follow.They blindly follow the people in front of them, despite the low flow efficiency.In this part,the lane-formation rate and orderliness of the system decrease as the low-velocity boundary decreases.In the other part where the low-velocity boundaryα>0.70,pedestrians only follow others who have a higher velocity.Therefore, pedestrians are not strongly willing to follow others.Only pedestrians with high walking efficiency can trigger off following behavior.On the other hand, pedestrians prefer to overtake those in front of them, which implies that these pedestrians are more aggressive.Here,the lane-formation rate decreases with the increase of the low-velocity boundary.The lane-formation rate can even reach a level lower than in the case of the low-velocity boundaryα=0,i.e.,pedestrians follow others blindly.This may account for the fact that in emergency situations, pedestrians are eager to overtake others to reach the exit,and they cannot tolerate pedestrians walking in front of them at a low speed,which increases conflicts between pedestrians and reduces the orderliness of the pedestrian system.At the low-velocity boundary of aboutα=0.70,the order degree of the system reaches a peak,indicating that when pedestrians follow those whose forward speed is greater than or equal to about 70% of their own speed and overtake those whose forward speed is less than 70%of their own speed,the pedestrian system reaches the most orderly state.This finding may be used as an evacuation instruction for pedestrians in emergency situations.

Fig.18.Influence of low-velocity boundary on lane formation.
5.3.Influence of obstacle on lane formation and system orderliness
The influence of obstacle in front of an exit on pedestrian evacuation and system order has been studied through experiments and simulations.[48,56]In this study,the investigation of the influence and mechanism of the obstacle layout at the exit is conducted.The case study setup is shown in Fig.19.The ROI is an 8 m×3 m rectangular space.The exit, indicated in green,is a 0.7-m opening that only allows one person to pass through and is located in the right center of the area.A square obstacle with a width ofwis placed 1.5 m in front of the exit.In each simulation run,100 pedestrians are randomly initiated in the gray region behind the starting line.Their destinations are set as the exit.The program stops when the last pedestrian passes through the exit.The time taken by 100 pedestrians to pass through the exit is recorded as the egress time.Pedestrian flow simulations are recorded and analyzed for the cases with different obstacle widths to study how obstacles affect pedestrian motion.In addition, a case without an obstacle is also considered for comparison.
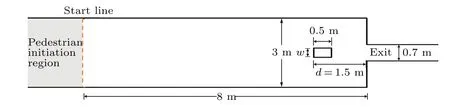
Fig.19.Illustration of obstacle layout.
The average flow rate,[58]which is a useful method of characterizing the traffic efficiency under a specific layout, is defined as follows:
whereJis the average flow rate(in units ped·m-1·s-1);Nis the total number of pedestrians,which is 100 in this case;Tis the egress time,measured in seconds in unit(s);Dis the width of the exit,measured in units of meter(m).A higher average flow rate represents a higher flow capacity and efficiency.To study how the width of the obstacle at the exit affects pedestrian flow efficiency, the average flow rate of 100 pedestrians passing through the exit under different obstacle widths is obtained through simulation,and the results are shown in Fig.20.The empty diamonds represent the simulation results; the red dashed line refers to the average flow rate in the case without an obstacle.It is found that compared with no obstacle,an obstacle with a small width reduces the egress time and improves the flow rate.The flow rate reaches its highest value when the obstacle width is about 0.8 m–1.0 m.These findings suggest that the obstacles existing under certain layouts may improve the flow efficiency to some extent.When the obstacle width is greater than 1 m, the negative effect of blocking is dominant in influencing the pedestrian flow,resulting in a sharp decrease of the pedestrian flow efficiency.
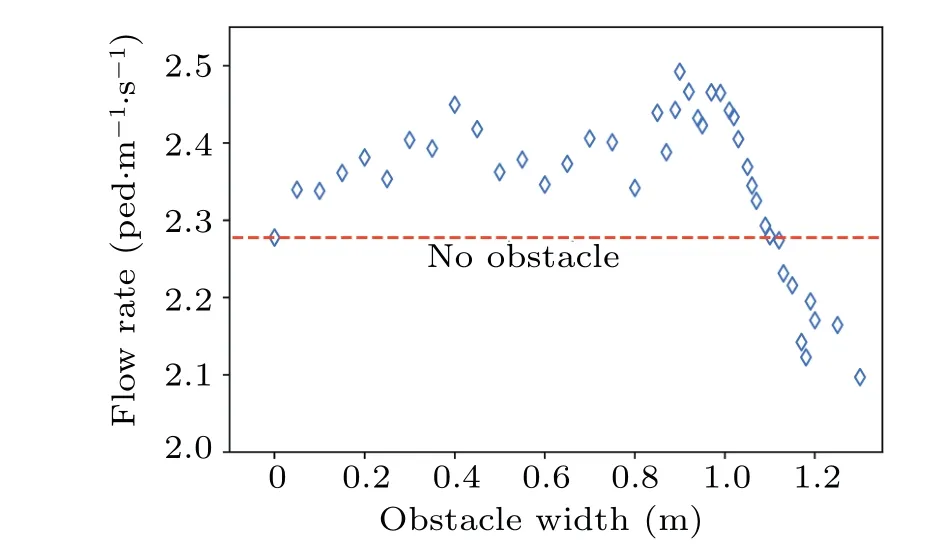
Fig.20.Relation between egress time and obstacle width.
To further investigate the effect of obstacles on pedestrian flow efficiency, pedestrian trajectories are analyzed, and the order degree, to which the lane formation rate is combined with its differential, is used to quantitatively measure the orderliness of the pedestrian system and analyze the effect of obstacles on the pedestrian flow pattern.
In the case without an obstacle(see Fig.21),pedestrians first form six lanes through self-organizing movement.However,as they approachx=6 m,where the narrow exit requires the six pedestrian lanes to aggregate into one lane to pass through, the pedestrian system is disturbed, and pedestrians begin to rearrange their positions in front of the exit.This can be observed in the messy trajectories in Fig.21(a).To adapt to the narrow exit,a crowd gradually gathers.Thus,from the perspective of pedestrian distribution,the increase of position concentration degree leads the value ofηto increase as shown in Fig.21(b).However,|ηx|reflects the lateral interactions and conflicts in the gathering process as shown in Fig.21(c).The system order degree,defined asω=η·e-|ηx|,also decreases as shown in Fig.21(d).When pedestrians are very close to the exit,they cluster to form one lane,resulting in a sharp drop in the system order degree.This is consistent with what we experienced: when we are close to the exit,the pedestrian system’s orderliness decreases significantly.While passing through the narrow exit,pedestrians form a steady lane,and the degree of system order increases to a value close to 1.
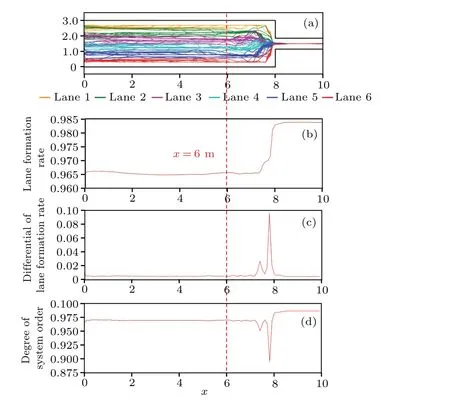
Fig.21.(a)Pedestrian lane division with no obstacles.(b)Lane-formation rate along x, η.(c) Absolute value of differential of lane-formation rate along x,|ηx|.(d)Order degree of pedestrian system,ω =η e-|ηx|.
Compared with the case without any obstacle, the presence of an obstacle can affect the lane-formation state and orderliness of the pedestrian system.Simulation results under different obstacle widths as shown in Fig.22 reveal that changes in the system order degreeωoccur,corresponding to the layout changes in the path.It is observed that three positions with sudden changes related to obstacle occur in the path.
(i)At exit
The most evident change occurs at the narrow exit,where all cases exhibit a sharp decrease inω, followed by a rapid increase to a higher level,close to 1.This is a process of reorganization in front of the exit.Subsequently,pedestrians form one lane to pass through the exit,resulting in the most ordered state.
(ii)In front of obstacle
The obstacle causes a sudden change in the system order degree in the region in front of the obstacle.Due to the space occupied by the obstacle, the path cross-section that allows pedestrians to pass through is narrow,and the crowd is forced to gather as shown in Fig.22.The order degreeωin the obstacle region reaches a relatively stable and high value.The effect of lane reorganization spreads from the obstacle to upstream and downstream.In the upstream direction,ωbegins to fluctuate in front of the obstacle,indicating that pedestrians who are well arranged in lanes are forced to change their directions and leave their original lanes in advance to bypass the obstacle.Whenw=0.4 m,the pedestrian order degree begins to fluctuate atx=5.8 m,and whenw=1.6 m,the pedestrian order degree starts to fluctuate atx=4.9 m.This suggests that the influence area of the obstacle expands with the increase of obstacle width.
(iii)Between obstacle and exit
Another rapid and chaotic change occurs in the region between the obstacle and the exit as indicated by the red dotted line in Fig.22.This region is influenced by the coupling effect of the obstacle and exit,and the system state and order degree change according to more complicated rules.
i)In the case without any obstacle(w=0 m),significant fluctuations in order degree still occur,indicating that the upstream influence of the exit affects the movement of the pedestrian system.However, when a small obstacle exists, for instance,w=0.4 m or 0.8 m, the fluctuation ofωis obviously smaller than in the case without any obstacle.This indicates that the presence of an obstacle can to some extent regulate and guide the pedestrian flow to mitigate the influence of the exit.
ii)The optimal mitigation of the negative influence of the exit on the pedestrian system order occurs when the obstacle width is between 0.8 m and 1.0 m.By combining the pedestrian trajectories, it can be observed that in these two cases (see Figs.22(c) and 22(d)) the positive effect of guidance,caused by the obstacle, helps the region downstream of the obstacle connect smoothly with that upstream of the exit,which helps the pedestrian system maintain its order with a good lane-formation state.This is also demonstrated by the curve ofωin Fig.22,where the curve in the red dotted circle refers to a smooth transition without a sudden decrease.In this case,the positive guidance effect of the obstacle is greater than its negative effect of blocking the pedestrian path,resulting in a higher pedestrian egress efficiency.
iii) However, when the obstacle width further increases,the distribution of pedestrians from downstream of the obstacle to upstream of the exit evolves into a large-span separation and convergence.The smooth connection of the obstacle downstream and exit upstream is destroyed,resulting in a sudden decrease inωdenoted by the red dotted circle.The fluctuation magnitude quickly increases to a level greater than that in the case without any obstacle as illustrated in Figs.22(e)and 21(f).This indicates that the blocking effect of the obstacle exceeds the guidance effect.The obstacle blocking effect and exit effect are combined,thus causing the order degree of system to further decrease.
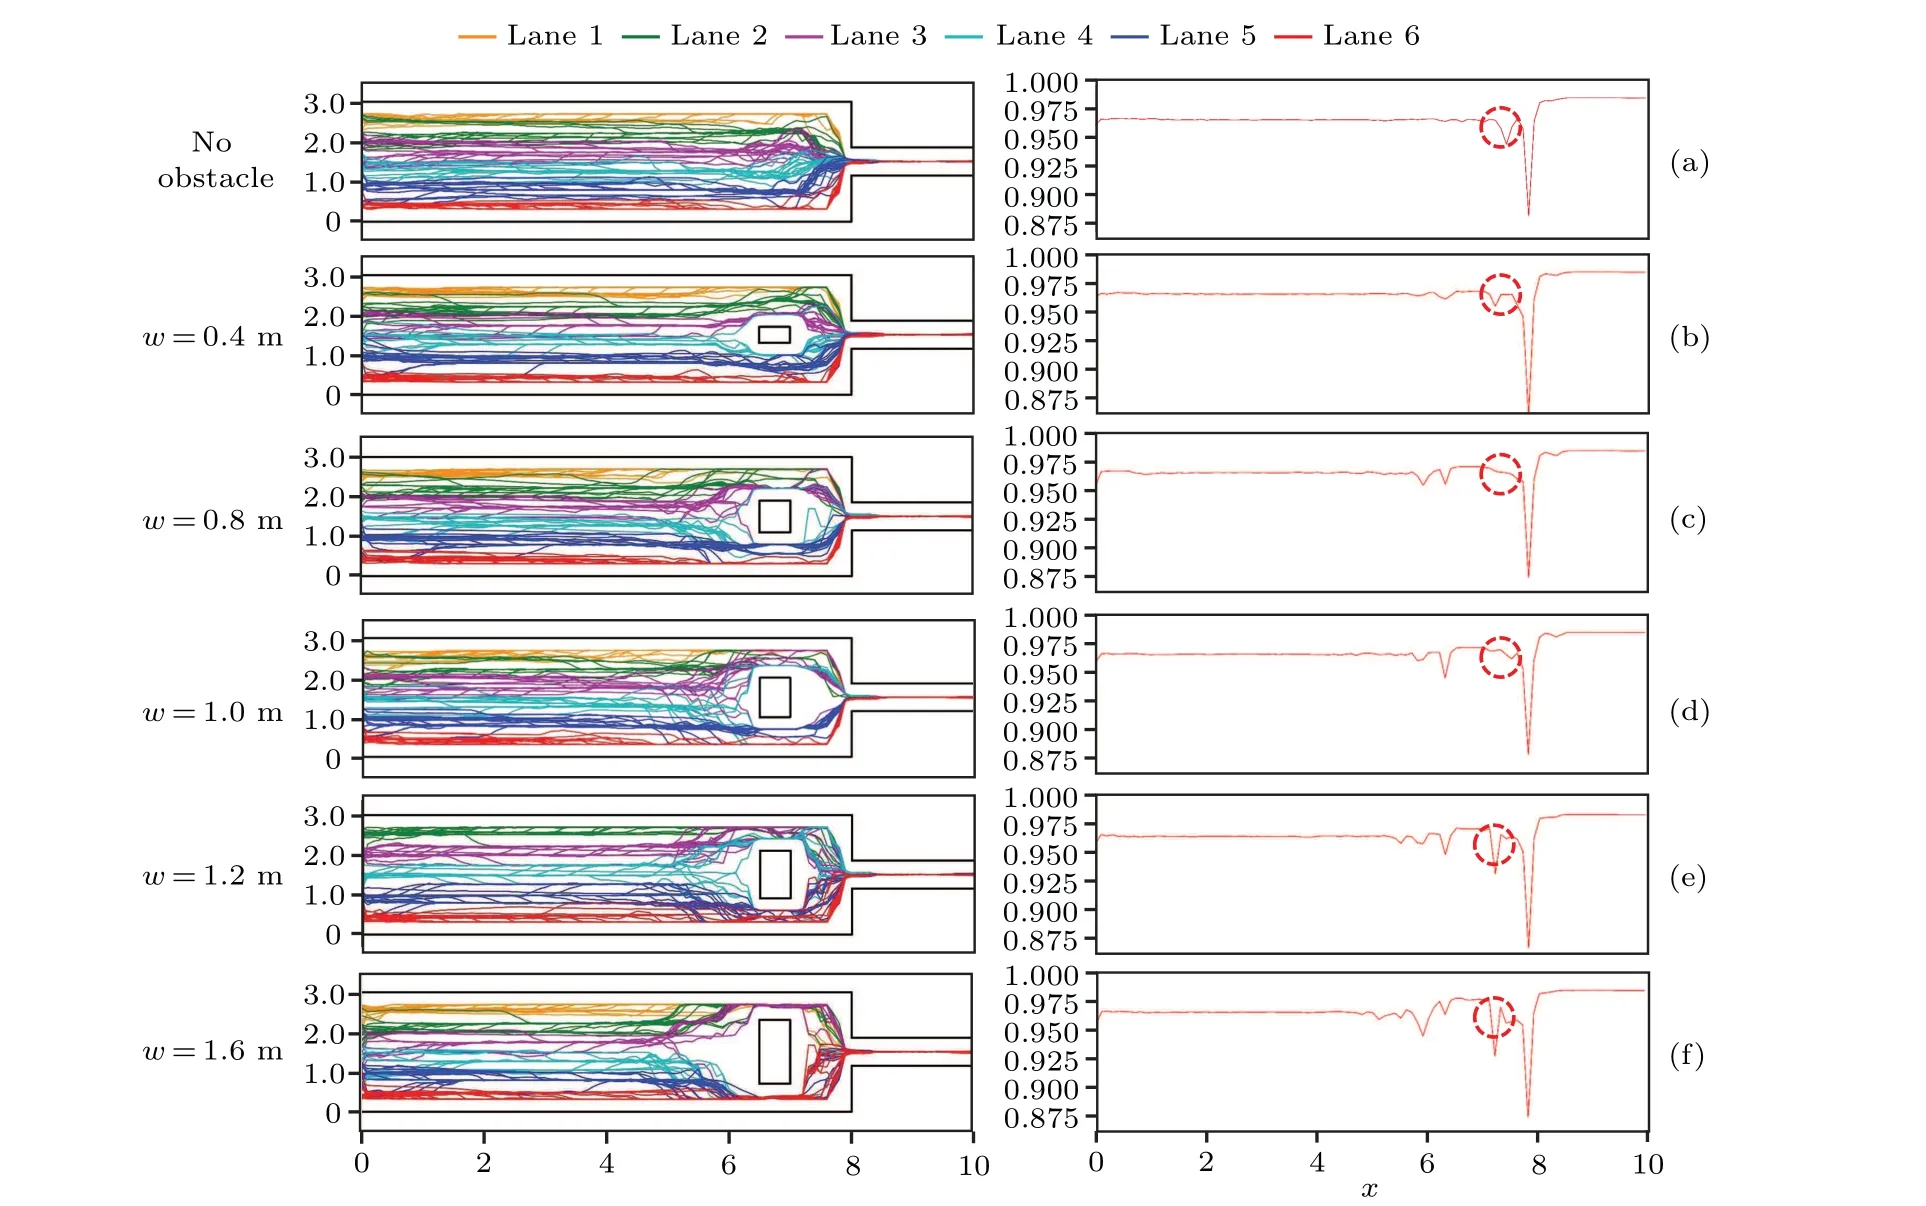
Fig.22.Illustration of pedestrian lane formation and system order degree.
From the above analyses,it is clear that the order degree of the pedestrian flow in the region between the obstacle and exit is a factor that significantly influences the egress time and flow efficiency.Obstacles can trigger off both a guiding effect and a blocking effect.An appropriate obstacle layout can guide the pedestrian flow to promote lane formation and improve the system order degree.These findings may inspire the design of inevitable obstacles at exits,such as notice boards or information desks,to improve the pedestrian flow efficiency.
6.Conclusions and perspectives
Early studies have highlighted the importance of following behavior and overtaking behavior in lane formation.However,these two behaviors are usually considered separately in the social force model, and the research on the quantitative analysis of their influence on pedestrian movement is still lacking.To better study pedestrian lane formation phenomenon,we propose a microscopic model that combines the following behavior and the overtaking behavior and simulates the crowd movement.We further provide a quantitative measure for studying the pedestrian system orderliness.By considering the view angle,low-velocity tolerance,and right-hand preference in the pedestrian movement model and incorporating the lane-formation rate as a measure of lane-formation completeness and system order index, we investigate the influence of following behavior and overtaking behavior on lane formation in bi-directional flow from a microscopic perspective.
The study results indicate that the following behavior significantly affects the lane formation.The stronger the following behavior,the higher the lane-formation rate is and the more orderly the system.However,even without any following behavior, a certain degree of lane formation still occurs due to avoidance behavior.
Another important factor influencing the lane formation is the tolerance of the pedestrians to the low velocity of pedestrians walking ahead of them.The results demonstrate that not all following behaviors lead to more orderly system.Blindly following others reduces the system’s order because the pedestrians are negatively affected by those with low walking efficiency.However, pedestrians with high low-velocity boundaries, also known as more aggressive walkers, also reduce the system’s order.In our simulation, when the low-velocity boundary is set to 70% of a pedestrian’s own speed, the system reaches the highest-order index.This suggests that under emergency circumstances,people are neither advised to follow others blindly nor rush ahead aggressively.An appropriate degree of acceptance of a low speed can help maintain the system in a well-ordered state as well as improve traffic efficiency.
We also study the influence of obstacles and geometrical layout on pedestrian movement.The proposed order degree based on the information entropy can reflect the laneformation state and the overlapping or reorganization of pedestrian lanes,which is used to quantify the influence of obstacles on pedestrian movement.The results reveal that the obstacles and environment layout can affect the lane formation of pedestrian systems.When the obstacle width is small,the obstacle causes a minor disturbance in pedestrian lane.The presence of obstacles can even guide the pedestrian flow to improve egress efficiency.However,when the obstacle width is large,pedestrian lanes begin to overlap and merge with each other,causing the system’s order degree to decrease sharply.This,along with the reduction in walking space, deteriorates the order of the pedestrian system,leadingthe egress efficiency to decrease.
The model and quantitative measure proposed in this study are of general significance in the dynamic study of pedestrian traffic flow.In future studies, the heterogeneity of pedestrian attribute should be considered.For different types of pedestrians,such as the youth and elderly,parameters such as pedestrian radius,low-velocity boundary,and following acceleration coefficient can be assigned to different values for different pedestrian particles.A more complex environment layout as well as interactions between pedestrians and obstacles can also be taken into consideration.It may be possible to develop a model to reproduce other pedestrian self-organizing movements so as to better understand how the microscopic mechanism of pedestrian interaction results in macroscopic self-organizing pedestrian movement.Additionally, the parameters under the present model framework can also be modified to simulate other traffic participants such as vehicles.The human-human and human-vehicle interactions will be studied in a more complex traffic system in the future.
Acknowledgement
Project supported by the National Natural Science Foundation of China(Grant No.71603146).

- Chinese Physics B的其它文章
- Unconventional photon blockade in the two-photon Jaynes–Cummings model with two-frequency cavity drivings and atom driving
- Effective dynamics for a spin-1/2 particle constrained to a curved layer with inhomogeneous thickness
- Genuine entanglement under squeezed generalized amplitude damping channels with memory
- Quantum algorithm for minimum dominating set problem with circuit design
- Protected simultaneous quantum remote state preparation scheme by weak and reversal measurements in noisy environments
- Gray code based gradient-free optimization algorithm for parameterized quantum circuit