
Fast compressed sensing spectral measurement with adaptive gradient multiscale resolution
2024-02-29 09:18RuoMingLan蓝若明XueFengLiu刘雪峰TianPingLi李天平andChengJieBai白成杰
Chinese Physics B 2024年2期
Ruo-Ming Lan(蓝若明), Xue-Feng Liu(刘雪峰), Tian-Ping Li(李天平), and Cheng-Jie Bai(白成杰)
1School of Physics and Electronics,Shandong Normal University,Jinan 250014,China
2Key Laboratory of Electronics and Information Technology for Space Systems,National Space Science Center,Chinese Academy of Sciences,Beijing 100190,China
Keywords: spectrometer,compressed sensing,adaptive gradient multiscale resolution,fast measurement
1.Introduction
Single-pixel spectrometers(SPSs)are widely used in the field of spectral measurements.[1–6]A Hadamard transform spectrometer is a typical SPS,[1–3]and it can modulate the spectral signal through a spatial light modulator (SLM) for many times.The total light intensity of each modulated spectral signal is measured at a point detector, and the spectral signal is recovered by applying an inverse algorithm.To calculate the spectral signal, the minimum number of modulation measurements of the Hadamard transform spectrometer should equal the pixel length of the spectral signal.[7]In fact,the SPS measurement technology can be considered as a type of computing measurement technology that trades time for spatial resolution,hence its relatively slow measurements.The higher the resolution of the spectral signal is,the more time is required for measurements.This problem has prevented the development of SPSs for fast measurements.
However,compressed sensing(CS)theory[8–10]now partially solves this problem.Using the same instrument structure as a Hadamard transform spectrometer, the CS algorithm accurately reconstructs the spectral signal with sampling times much less than pixel length, thereby shortening the measurement time.Unfortunately,even though using the CS subsampling technique,the measurement time and resolution are still inversely proportional.The most direct and effective strategy to improve the measurement speed is to reduce the pixel length of the spectral signal by reducing the measurement resolution.The simplest way is to measure the whole spectral signal with low resolution, which is called global low resolution (GLR)here.However,the GLR method often fails to meet the needs of applications because it completely destroys the resolution index.
To overcome this problem,we propose herein an adaptive gradient multiscale resolution(AGMR)method based on CS,which exploits the fact that detecting a signal rarely requires the same resolution over the entire measurement range.[11,12]The AGMR method allows high-resolution measurements to be made in localised spectral regions, with gradient variation low-resolution measurements made in the remaining spectral regions.However, the length of the AGMR spectral signal remains the same as that of the GLR spectral signal, so the AGMR approach provides the same high-speed measurement capability as the GLR approach but with local high-resolution.
The premise of CS measurement is that the measured signal is sparse or compressible.Although typical images are generally compressible but not sparse,spectral signals are most often sparse.For example,the atomic spectrum of many elements generally contains only one or several narrow spectral lines,[13]which are called characteristic spectral lines,and generally contain the details of interest to users.Using the AGMR method, only the spectral ranges around the spectral feature of interest are measured with high resolution,whereas other spectral regions are measured with low resolution.
The present work demonstrates an AGMR measurement of a single spectral peak and an AGMR measurement of dual spectral peaks that differ in frequency.To make the AGMR measurement of dual spectral peaks,we divide the spectral signal into two spectral ranges for sampling but only apply a single reconstruction to recover the spectral signal.This method of sampling twice and reconstructing once not only shortens the time required for spectral reconstruction but also ensures the continuity of the spectral signal,as discussed in our previous work.[14]
2.Theory and method
2.1.CS spectroscopy
Figure 1 shows a schematic illustration describing SPS based on CS.The point detector of the SPS has zero spatial resolution, so the one-dimensional spectral signal produced by the grating is first imaged onto a spatial light modulator(SLM), which modulates the spectral signal several times so that the total intensity of each modulated spectral signal may be collected and recorded by the PMT point detector.After multiple modulations and measurements, the spectral signal can be reconstructed by the CS algorithm.[15,16]The SPS measurement process can be expressed as
wherexis a column vector of lengthnand represents the spectral signal.The higher the measurement resolution is,the greater thenis.A(m×n)is the measurement matrix,in which each row represents a modulation of the spectral signal.Finally,yis a column vector of lengthm, which represents the measurement record corresponding tommodulations.CS uses the subsampling process,somis less thann.
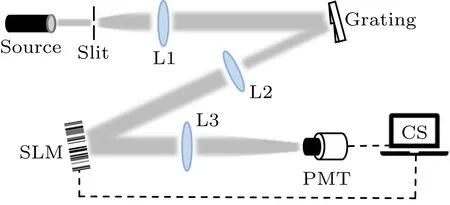
Fig.1.Schematic diagram of SPS.
2.2.AGMR method
The previous SPS techniques use uniform spectral resolution over the entire spectral measurement range,which makes it difficult to achieve fast and high-resolution spectral measurement.Is there a method to solve this contradiction? The resolution characteristics of the human retina inspired us.The resolution of the retina is not globally consistent.The highresolution area of the retina is called the fovea, and the resolution outside the fovea decreases with distance far from the fovea.[17,18]Therefore, the image detected by the retina is a multiscale resolution image.Inspired by the characteristics of retina, we proposed an AGMR spectral measurement method based on CS.The AGMR spectral measurement method proposed herein uses high resolution in a local region and low resolution in the remaining regions.The resolution distribution of the AGMR spectrum measurement mimics that of the human retina by conforming to the principle of gradual decrease.The pixel scale of the spectral signal in the AGMR method is shortened,and the measurement time is decreased.
The AGMR spectrum measurement method is illustrated by the following example.For a certain spectral signal, we assume that the corresponding spectral signal length of the global high-resolution (GHR) measurement is 1024.If 25%sampling ratio is selected, the sampling number is 256.To improve the measurement speed, the GLR spectral measurement reduces the resolution globally, that is, adjacent pixels are combined into a single pixel, such as four in one, which reduces the resolution to 256 pixels,and the sampling number is 64 at 25%sampling ratio,which can effectively shorten the measurement time.However, the GLR method often fails to meet the needs of applications because it completely destroys the resolution index.Therefore,we propose the AGMR measurement method here, which divides the spectral signal into four regions with different measurement resolutions.The first region is a high-resolution region(corresponding to the fovea of the retina)with number of original pixels beinga,and pixel merging is not performed.The number of original pixels in the second resolution region isb, in which two adjacent pixels are combined into a single pixel making the number of merged pixels beb/2.Similarly, in the third resolution region with original pixels ofc, every four adjacent pixels are merged to formc/4 superpixels, and in the fourth resolution region with original pixels ofd, every eight adjacent pixels are merged to formd/8 superpixels.Moreover, the second,third and fourth resolution regions are divided into two parts respectively, and symmetrically distributed on both sides of the high-resolution region.To make the final pixel number be the same as GLR measurement, we seta=80,b=128,c=80,d=736,and the total number of pixels after merging isa+b/2+c/4+d/8=256.By this design,the AGMR measurement with resolution distribution similar to that of retina is realized,which simultaneously possesses the speed advantage of GLR measurement and the resolution advantage of GHR.The GLR pixel distribution diagram and the AGMR pixel distribution diagram with the high-resolution region in the center of the spectral signal are shown in Fig.2.
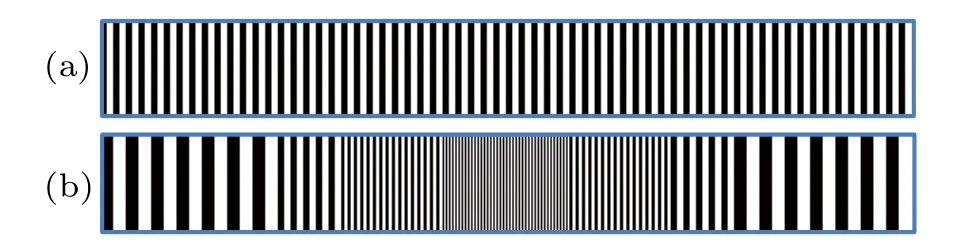
Fig.2.Pixel distribution diagrams of(a)GLR and(b)AGMR.
Human eyes can adaptively shift to make the most interesting scene fall in the fovea for high-resolution detection.The high-resolution region of the AGMR measurement we design can also adaptively move according to the position of the spectral characteristic peak,and other resolution regions can move circularly with the high-resolution region, which can be realized by cyclic translation of the measurement matrix elements.
2.3.Simulation
Using the CS spectral measurement method, simulation experiments were carried out for a virtual spectral signal.The pixel number of the original spectral signal is 1024,as shown by the blue curve in Fig.3.The characteristic peak of the spectral signal is located at the center.An AGMR measurement and an GLR measurement are made,their effective pixels are both 256.With the sampling ratio of 50%for the two measurements, the sampling number is 128.The TVAL3 algorithm is used in spectrum reconstruction.[19]The AGMR and GLR measurement results are shown with green and red curves,respectively, in Fig.3.In order to facilitate the comparison of the results, we have shifted the AGMR and GLR measurement curves upward during display.It should be noted that the AGMR and GLR reconstruction results are 256 pixels, while for the display,they are inversely expanded back to 1024 pixels according to the pixel merging law in the measurements.

Fig.3.Virtual spectrum measurement results of AGMR and GLR methods.
From the red curve in Fig.3,it can be seen that the measurement quality deteriorates to the same extent because the GLR method adopts a consistent low resolution throughout the spectral range.Because of the low resolution, the measurement of the characteristic peak appears serious distortion.From the green curve in Fig.3, the measurement qualities in different regions are different because the AGMR measurement adopts non-uniform resolution.In the central region,the resolution is four times that of the GLR measurement.Therefore, the measurement quality is much better than that of the GLR method,and the details of the characteristic peak are perfectly reconstructed.In the second resolution region,the resolution is twice that of the GLR measurement,and the spectrum quality is also better for the AGMR measurement.In the third and fourth regions, the resolutions of AGMR are the same or even lower than GLR measurement,but it will not have a serious impact on the overall quality as the spectrum in the regions far away from the characteristic peak does not have much useful information.
In addition,we evaluated the AGMR and GLR measurement qualities based on the index of mean square error(MSE).The smaller the MSE,the better the measurement quality.To evaluate the spectrum qualities in different regions,we divide the spectral signal into 128 segments, with each segment of 8 pixels.For each segment, we calculate the MSEs of the AGMR and GLR measurement results according to the following formula:
wherexis the original spectral segment and ˆxis the reconstructed spectral segment.

Fig.4.Mean square error distribution of AGMR and GLR measurements over 128 segments(compared to the original spectrum).
Figure 4 shows the MSEs of the AGMR(green curve)and GLR(red curve)measurements as a function of the segment.It can be seen that the reconstruction quality of the AGMR measurement dramatically exceeds that of the GLR measurement in and near the first high-resolution region but gradually deteriorates upon departing from the central region,which is consistent with the resolution distribution of the AGMR measurement[cf.Fig.2(b)].Different from the AGMR measurement,the GLR measurement produces a relatively uniform MSE except for the high-resolution region.In the region where the spectral signal changes smoothly,the low-resolution measurement will not change the overall trend,but only slightly affect the specific values.However, in the region where the spectral signal changes violently,the details lost due to low resolution cannot be obtained.Therefore, the AGMR measurement method has obvious advantages.
3.Experimental results
Following the schematic diagram of the SPS in Fig.1,we built an experimental SPS device with a slit width of 25 µm and with lenses L1 and L2 with focal lengths of 50.8 mm and 100 mm,respectively.We used a Thorlabs GR50-0605 blazed grating, with a blazing wavelength of 500 nm and a grating constant of 1666.7 nm.The experiment used a mercury-argon standard light source as the measured object, with the illumination incident at 40◦with respect to the grating normal.The formula for spectral resolution[20]gives the optical spectral resolution of the experimental device as 0.2 nm at 500 nm.
In the experiment, we used a digital micromirror device(DMD) as the SLM.The DMD is a two-dimensional SLM composed of a series of micromirrors.Each micromirror can deflect in two directions independently to modulate the optical signal.[21]For the experiments, we used a Texas Instruments DLP7000 as the DMD,with 1024×768 elements.The spectral signal is one-dimensional,so a column of DMD mirrors serves a single unit in the experiment.With this DMD,the maximum resolution of the spectral measurement is 1024 pixels, which is used for GHR measurement.To improve the measurement speed, the AGMR and GLR spectral measurements reduce the resolution by combining adjacent DMD horizontal columns into one column according to the method in Subsection 2.2 (cf.Fig.2).The effective spectral length of both measurements is 256.
In the AGMR experiments,we placed 64 groups of measurement matrices in the DMD in advance.The DMD is divided into 64 segments horizontally, and the high-resolution regions of the groups of 64 matrices are located in segments 1,2,..., 64, respectively.In the experiments, appropriate measurement matrix can be selected according to the position of the spectral characteristic peak.
3.1.Single-peak measurement
The single-peak AGMR experiment only measures one characteristic peak of spectral signal,which has two cases,the first involves dynamic acquisition of the most intense spectral peak, and the second is the acquisition of a single, arbitrary spectral peak.
For the dynamic acquisition single-peak experiment, the most intense spectral peak was located by making a global ultralow-resolution measurement (GULR) of length 64 and with a sampling ratio of 40% (sampling number of 26), as indicated in Fig.5(a).The most intense peak appears near segment 47,and the other three peaks appear near segments 5,14, and 55.For the most intense peak, the system automatically selects the 47th measurement matrix in the DMD for the AGMR measurement with a sampling ratio of 40%(sampling number of 102), as indicated in Fig.5(b).For comparison,we also made a GLR measurement with a length of 256 and a GHR measurement with a length of 1024,both with a sampling ratio of 50%.The sampling number of GLR maintains the same as the total of GULR and AGMR.Figures 5(d) and 5(e)show the measurement results.
The result of the GHR measurement in Fig.5(e) shows five spectral lines in the measurement range of the spectrometer at the wavelengths 404.6, 435.8, 546.0, 576.9, and 579.0 nm, respectively.Figure 5(d) shows that the uniform decrease in resolution for the GLR measurement uniformly degrades the measurement accuracy for all spectral lines compared with the GHR measurement.Figure 5(b) shows that the AGMR measurement provides high resolution near the most intense peak (546.0 nm), with the measurement accuracy of this spectral line being basically the same as that of the GHR measurement.However, the measurement accuracy of the other spectral lines is reduced because of low resolution.The measurement accuracy of the spectral lines(576.9 nm and 579.0 nm)in the third resolution region is the same as that of the GLR measurement.For the fourth resolution region the reconstruction quality of spectral lines(404.6 nm and 435.8 nm)is worse than that of the GLR measurement.These results are consistent with the simulation results given in Fig.4.
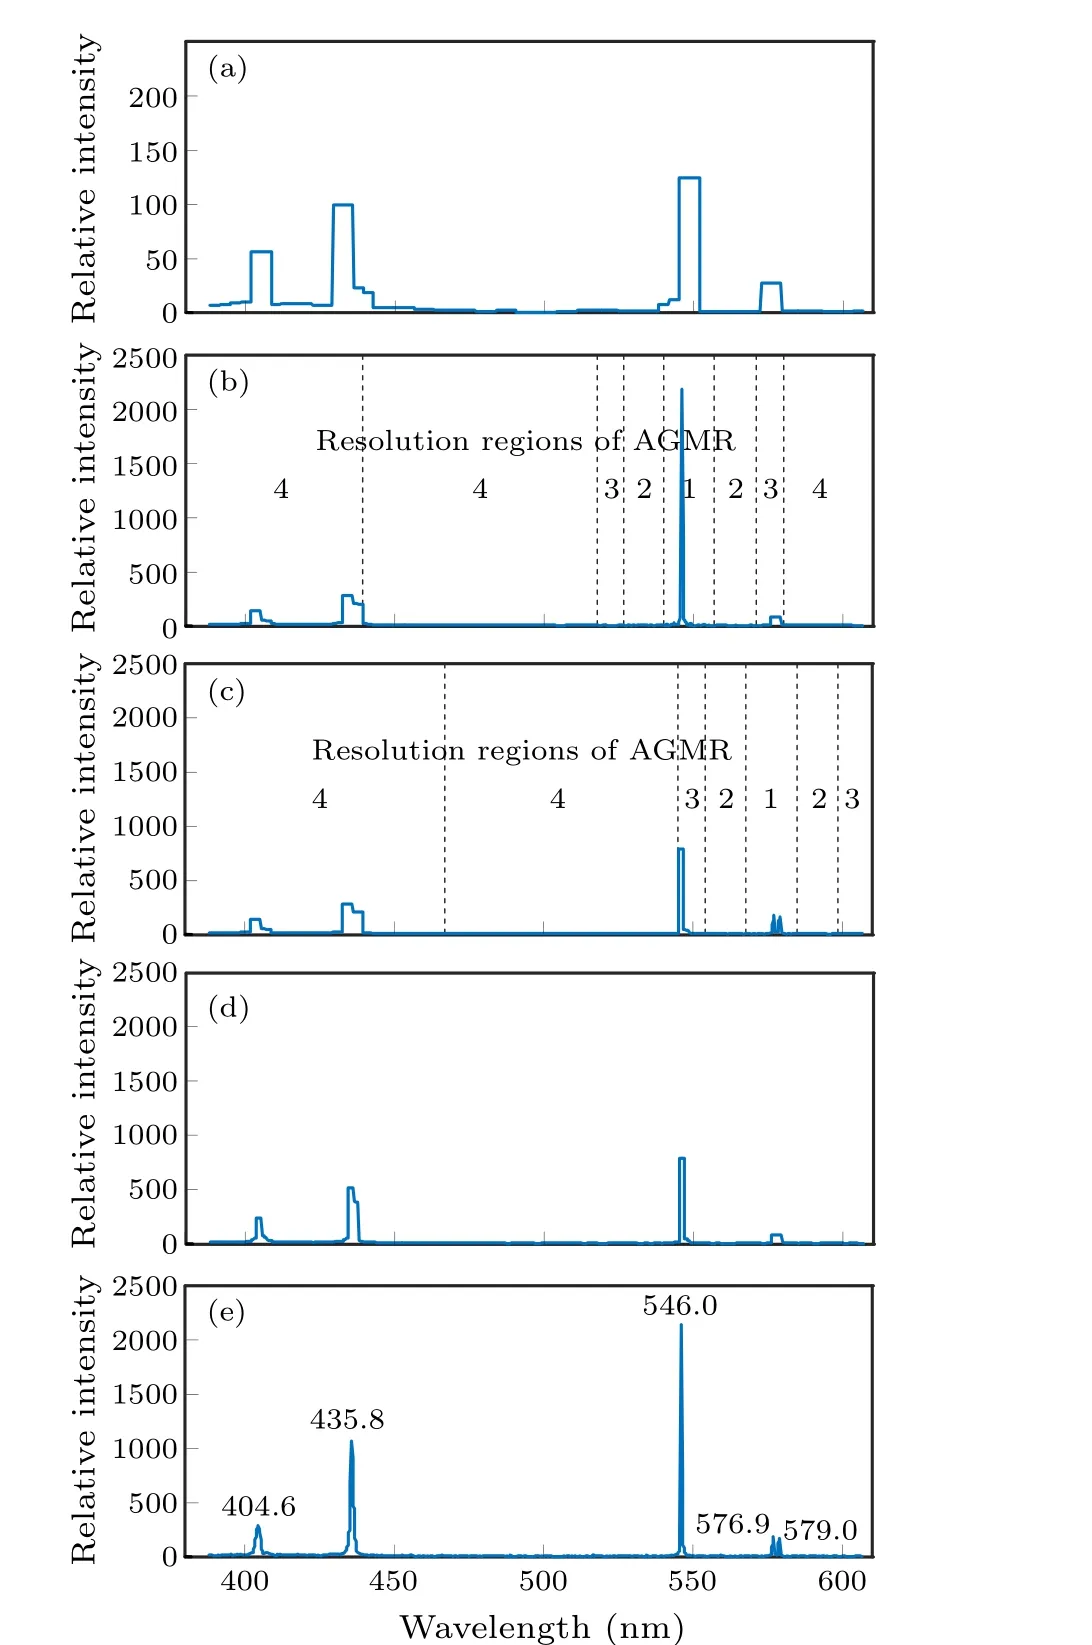
Fig.5.Spectrograms of (a) GULR measurement, (b) dynamic captured AGMR single-peak measurement,(c)manually specified AGMR single-peak measurement, (d) GLR measurement, and (e) GHR measurement.
In addition to the dynamic acquisition single-peak measurement of the most intense peak, we also manually specified the region of interest for a single-peak AGMR measurement.Two weak small spectral lines appear at 576.9 nm and 579.0 nm.They are very close to each other and are located near segment 55.To distinguish them clearly, we turned off auto-capture, designated segment 55 as the region of interest and selected the corresponding measurement matrix for the AGMR measurement.Figure 5(c)shows the measurement results, in which the two spectral lines are clearly distinguishable, and the accuracy is consistent with the GHR measurement.
For GULR, AGMR, GLR and GHR measurements, we list the sampling numbers for the above experiments,and calculate percent of the first three with respect to GHR.Table 1 presents the results.
As presented in Table 1,the sampling numbers of AGMR and GLR are 19.92%and 25%of GHR.For AGMR,the most intense spectral peak should be detected by the GULR measurement, which translates into 5.08% sampling number of GHR.The total sampling number of AGMR and GULR is also 25%of GHR.Thus,the decrease in resolution reduces the sampling number for the AGMR and GLR methods,indicating that the measurement speed improves significantly.However,if AGMR is used for multiple consecutive measurements,the spectral peaks of interest can be detected by the previous measurement,so no additional GULR measurements are required.

Table 1.Sampling numbers of GULR, AGMR, GLR and GHR measurements.
3.2.Dual-peak measurement
In addition to the single-peak measurement, we also dynamically captured and measured dual spectral peaks.The dual-peak measurement is suitable for applications that must detect two spectral peaks at the same time,so it requires more samplings than the single-peak measurement.
In the GULR measurement, the two most intense peaks appear near segments 14 and 47, and the system samples the two peaks separately.The specific method involves selecting the DMD measurement area(all DMD micromirror units outside the measurement area are in the zero position).The first sampling measures only from segment 1 to 32,using the 14th measurement matrix,the second sampling measures only from segment 33 to 64,using the 47th measurement matrix.
The two sampling processes can be expressed as follows:
whereA1andA2are partial measurement matrices within the DMD measurement area,x1andx2are two partial spectral signals that combine to form a complete spectral signalx,andy1andy2are two sampling measurement results that combine to formy.
Thus,Eqs.(3)and(4)can be combined to form
Using Eq.(5), a complete spectral signal can be recovered by using a single CS reconstruction,with the result shown in Fig.6.Thus, for the dual-peak measurement, the two peaks are consistent with the results of GHR measurement[cf.Fig.5(d)].
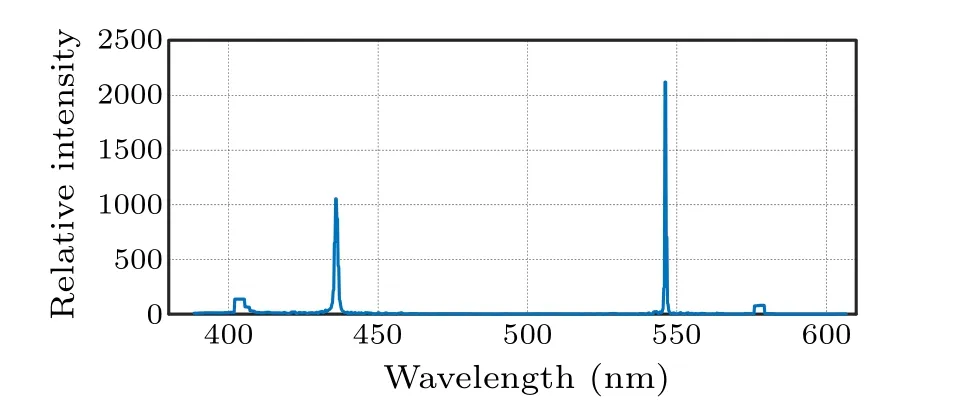
Fig.6.Spectrogram of dynamic captured AGMR dual-peak measurement.
The dual-peak measurement samples twice and reconstructs once, which not only shortens the reconstruction time but also ensures that the spectral signals are continuous at the junction.
4.Discussion
4.1.Sampling ratio
The SPS measurement based on CS has subsampling ability.For realizing fast measurement,we always want the sampling ratio to be as low as possible.However,if the sampling ratio is too low,the reconstruction quality of the spectral signal may be too poor to meet the needs of the actual observation.Therefore, how to choose an appropriate sampling ratio is a problem worth studying for CS spectroscopy.
For the virtual spectral signal used in Subsection 2.3,further AGMR simulation experiments are carried out, and the influence of sampling ratio on the reconstruction quality is studied.At different sampling ratios, the spectra were reconstructed and their corresponding MSE indices to the original spectra are calculated.The MSE curve is shown in Fig.7.
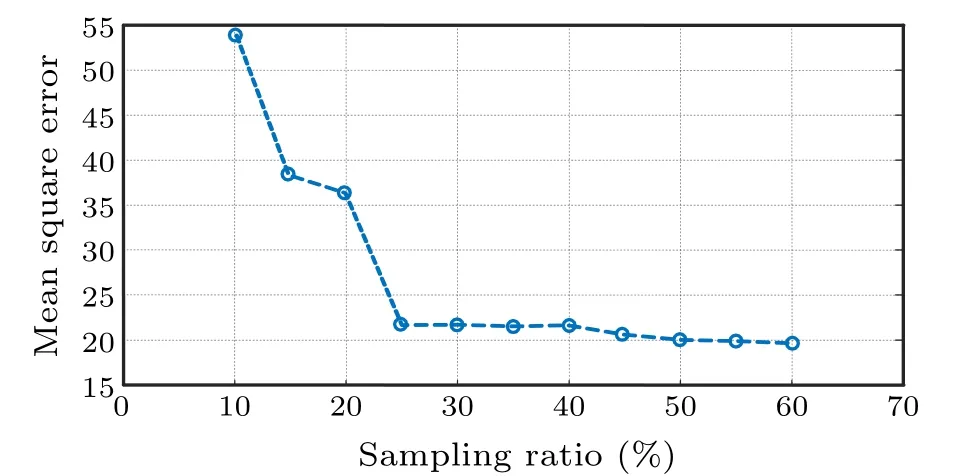
Fig.7.MSE at different sampling ratios.
It is apparent from Fig.7 that, with the increase of sampling ratio, MSE decreases and the reconstruction quality of spectral signal improves.The first obvious turning point occurs at the 25% sampling ratio.When the sampling ratio exceeds 25%, the reconstruction quality remains relatively stable.The second turning point occurs at the sampling ratio of 50%,and the reconstruction quality is further improved.
For further analysis,the reconstructed spectra of the characteristic peak region at 20%, 25%, and 50%sampling ratios are shown in Fig.8(a), 8(b), and 8(c), and the original spectrum is given in Fig.8(d).It can be seen that at 20% sampling ratio, the reconstructed spectrum is seriously distorted.At 25%sampling ratio,the reconstructed result is close to the original spectrum,but there are still some deviations in details.At 50% sampling ratio, the reconstructed result is almost the same as the original spectrum.
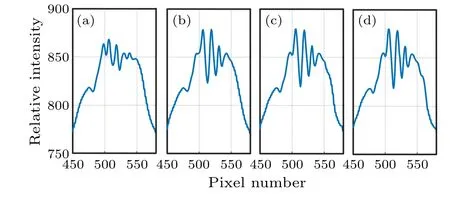
Fig.8.Characteristic peak reconstructed results at different sampling ratios: (a)20%,(b)25%,(c)50%,and(d)original spectrum.
Through the above analysis,we find that the sampling ratio should be at least 25% for the AGMR spectral measurement.In order to obtain perfect reconstruction quality, the sampling ratio should reach 50%.It is noted that these rules are consistent with our previous work about the sampling ratio of the compressive spectrometry.[14,22]In practice,the choice of sampling ratio should be made according to the actual application requirements,so as to obtain the balanced benefits of measurement speed and reconstruction quality.
4.2.Adaptive multi-peak simulation measurement
In the above experiments, we only used the AGMR method for adaptive high-resolution measurements of single or double peaks.In many applications, it may be necessary to perform high-resolution measurements on a larger number of spectral peaks.Therefore, we propose the adaptive dualresolution mode (ADR), which measures the entire spectrum at high and low resolutions to achieve adaptive measurement of multiple peaks,and its feasibility has been verified through simulation.In the simulation[Fig.5(e)],spectral signal measured by the GHR method with 1024 pixels is used as the original spectrum.In the ADR method,128 pixels are not merged for high-resolution measurement, and the remaining 896 pixels are measured for low-resolution measurement.In the lowresolution region, every 7 pixels are merged into 1 pixel, resulting in a combined pixel count of 128.The total spectral length of the merged pixels is 256, which is the same as the total spectral length of GLR.
In the implementation of ADR we first determine the position and number of spectral peaks based on the measurement results of GULR,and then evenly allocate high-resolution 128 pixels to each peak, aligning them with the center position of the peaks.The ADR measurement results are shown in Fig.9(a),with a total of 128 samples.The GLR measurement results of 128 samples are shown in Fig.9(b),and the original spectrum is shown in Fig.9(c).It can be seen that the ADR measurement results of the spectral peaks are basically consistent with the original spectrum,and the measurement quality is significantly improved compared to GLR.This proves the effectiveness of the ADR method for multi-peak measurements.
In practice, the number and position of peaks in different spectral signals are uncertain,so different spectral signals require different measurement matrices,which need to be generated according measurement result of GULR and transmitted to DMD in real-time.Specialized hardware circuits and software should be designed for experiments to achieve rapid generation of measurement matrices and on-line DMD control.This is an issue which can be further investigated in future work.
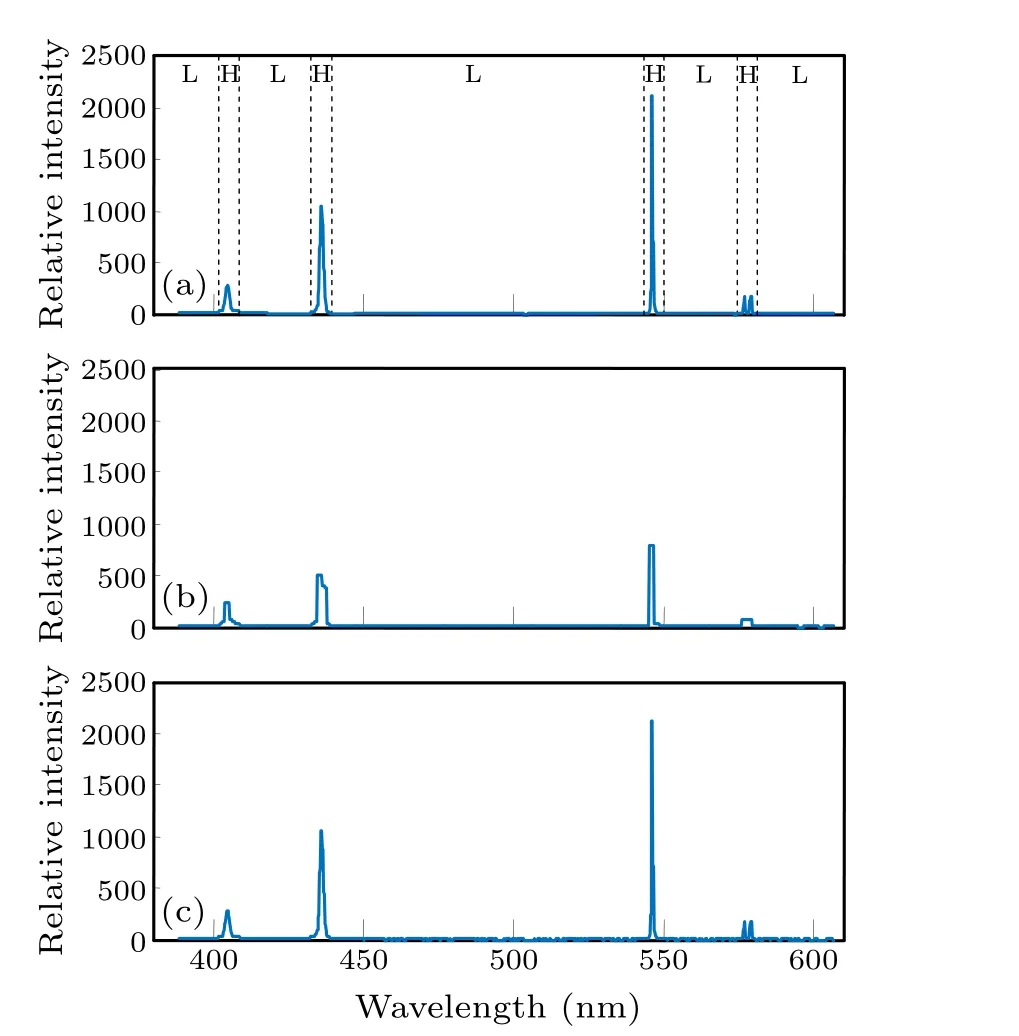
Fig.9.Spectrograms of(a)ADR measurement,(b)GLR measurement,and(c)original spectrum.H:high-resolution region,L:low-resolution region in(a).
5.Conclusion
This paper proposes a fast,AGMR spectral measurement method for single-pixel spectrometer,which shortens the measurement time required to acquire spectral signals while maintaining high spectral resolution over a local spectral range.After dynamically detecting the position of the most intense spectral peak or arbitrarily specifying the spectral range of interest, the spectrum is measured with high resolution within the given local spectral range.The spectral peaks of interest acquired by using this method are consistent with those acquired by using uniform GHR measurement over the entire spectrum.However, the number of samplings is reduced by 75% with the AGMR approach compared with the GHR approach,greatly shortening the overall measurement time.
Detecting the position of the spectral peak of interest requires increased sampling time due to the use of the ultralowresolution measurement.However, given the improved measurement speed, the proposed method is particularly suitable for continuous dynamic measurements of spectral signals because the spectral peak of interest can be obtained from the previous frame,thereby avoiding the ultralow-resolution measurement.We also measured dual spectral peaks, which is performed by sampling separately but reconstructing together.The two reconstructed spectral peaks are consistent with the GHR measurement.
The AGMR method utilizes multi-scale resolution to achieve local high-resolution rapid measurement of the spectrum.It can effectively improve the detection efficiency in the applications in which only a small number of specific spectral positions are concerned,such as atomic spectroscopy,laser spectroscopy,biological fluorescence spectroscopy,and component testing based on characteristic spectral lines.
Acknowledgements
Project supported by the Natural Science Foundation of Shandong Province, China (Grant Nos.ZR2020MF119 and ZR2020MA082), the National Natural Science Foundation of China (Grant No.62002208), and the National Key Research and Development Program of China (Grant No.2018YFB0504302).
猜你喜欢
中学生数理化·八年级物理人教版(2021年12期)2021-12-31
中学生数理化·八年级物理人教版(2020年12期)2021-01-18
杂文月刊(2019年19期)2019-12-04
中学生数理化·八年级物理人教版(2019年12期)2019-05-21
中学生数理化·八年级物理人教版(2018年12期)2019-01-31
少年漫画(艺术创想)(2018年2期)2018-09-11
试题与研究·教学论坛(2017年6期)2017-02-28
中国三峡(2016年5期)2017-01-15
歌海(2016年1期)2016-03-28
现代企业文化(2015年1期)2015-02-28

- Chinese Physics B的其它文章
- Unconventional photon blockade in the two-photon Jaynes–Cummings model with two-frequency cavity drivings and atom driving
- Effective dynamics for a spin-1/2 particle constrained to a curved layer with inhomogeneous thickness
- Genuine entanglement under squeezed generalized amplitude damping channels with memory
- Quantum algorithm for minimum dominating set problem with circuit design
- Protected simultaneous quantum remote state preparation scheme by weak and reversal measurements in noisy environments
- Gray code based gradient-free optimization algorithm for parameterized quantum circuit