
Effect of applied electric fields on supralinear dendritic integration of interneuron
2024-02-29 09:18YaQinFan樊亚琴XiLeWei魏熙乐MeiLiLu卢梅丽andGuoShengYi伊国胜
Chinese Physics B 2024年2期
Ya-Qin Fan(樊亚琴), Xi-Le Wei(魏熙乐), Mei-Li Lu(卢梅丽), and Guo-Sheng Yi(伊国胜),†
1Tianjin Key Laboratory of Process Measurement and Control,School of Electrical and Information Engineering,Tianjin University,Tianjin 300072,China
2School of Information Technology Engineering,Tianjin University of Technology and Education,Tianjin 300222,China
Keywords: GABAergic interneuron,electrical field,supralinear dendritic integration,action potential generation
1.Introduction
GABAergic interneurons are thought to play an important role in modulating neural activity and transmission in multiple brain regions by releasing inhibitory neurotransmitters.[1,2]And they are involved in controlling the excitability of excitatory and inhibitory cells, modulating synaptic plasticity, and coordinating synchrony during neuronal oscillations.Correspondingly, the dysfunction of inhibitory interneurons may cause epilepsy,schizophrenia,Alzheimer’s disease(AD),and Parkinson’s disease.[3–6]Therefore, many studies regard GABAergic interneurons as effective targets for the treatment of neuropsychiatric diseases.For example, Guzmanet al.proved that the GABAergic system can be used as an effective drug target for the treatment of AD.[7]And XU and Wang showed that regulating GABAergic system is an effective intervention method of treating schizophrenia,and discussed the feasibility of using GABAergic interneurons as potential therapeutic targets and drug treatments for cognitive deficits.[8]
Acting as a useful and effective noninvasive neuromodulation technique, transcranial magnetic stimulation (TMS)uses brief,intense pulses of electric current delivered to a coil placed on the subject’s head to generate an electric field in the brain via electromagnetic induction, which has been adopted to regulate neurological diseases.[9–12]The electric field(EF)induces spatial polarization along the somato-dendritic axis of a neuron,resulting in hyperpolarization of soma and basal dendrites near anodal electrode while leading to depolarization of these apical dendrites near cathodal electrode.Previous studies have paid more attention to the EF-induced somatic polarization of the pyramidal neuron, which contributes to neuronal spike timing and stimulation threshold for triggering an action potential(AP).[13–15]Owing to the symmetric dendritic morphology, the weak somatic polarization of interneuron is thought to has few effects on neural activities.[16,17]Differently, Murphyet al.[18]found that EFs induced by TMS can inhibit dendritic activity of pyramidal neurons in the deep cortex by activating GABAergic interneuron,indicating that EFs can regulate firing activity of GABAergic interneuron, which further modifies E/I balance of neural circuits.However,it is still unclear how the EF-induced polarization affects interneuron’s activities when it receives synaptic inputs and what effect it has on the interneuron’s activities.
NMDA synapse, as an important synaptic input, plays an important role in regulating interneuron activities.For example, the activation of voltage-gated NMDA receptors contributes to the GABAergic transmission of interneuron onto hippocampal pyramidal neurons.[19]The hypofunction of NMDA receptor of GABAergic interneuron gives rise to the pathophysiology of schizophrenia.[20]And experimental[21]and modeling[20]studies have shown that both clustered and scattered distribution of NMDA synapses can produce dendritic NMDA spike, which results in the supralinear dendritic integration.It is pointed out that the dendritic integration of NMDA synapses is characterized with a steep change,followed by a plateau, in subthreshold input–output (sI/O)curve.[20,22]The steep change in sI/O relies on the threshold of triggering dendritic NMDA spike while the plateau depends on the driving force of synaptic inputs.As described in the article of Augusto and Gambino,[23]the threshold and duration in time of NMDA spike depend on the baseline membrane potential, which suggests the modulatory influence of EF-induced polarization on the NMDA spike.Especially,our previous studies showed that the dendritic polarization of pyramidal neurons can regulate the dendritic integration of AMPA and NMDA synaptic inputs,[24,25]which further contributes to the generation of action potentials.Similarly,the EF-induced polarization at distal dendrites of interneuron can also contribute to the interneuron response by influencing the dendritic integration of NMDA synapses.Considering the cluster and scatter distribution of NMDA synapses and the influences of dendritic morphology on EF-induced polarization,we hypothesize that EF-induced dendritic polarization can affect the neuronal output of interneuron by regulating the local and global dendritic integration of NMDA synapses, which depends on the dendritic morphology.
To verify our hypothesis, we first build a simplified model of interneuron with multi-dendrites that receive NMDA synapses.By performing singular perturbation analysis, we obtain an asymptotic sI/O relationship for EF-regulated dendritic integration, which allows us to make the predictions as follows.(i)The EF-induced depolarization at distal dendrites facilitates the NMDA spike generation and reduces the driving force,leading to the left shift of steep change of sI/O and the decrease of dendritic saturation output, respectively.(ii)The unit EF-induced polarization at whole dendrites prefers global dendritic integration with sparsely activated NMDA receptors rather than the local dendritic integration with clustered activated NMDA receptors.Besides, three interneurons with different morphologies are used to well validate these predictions, since the neuronal response depends not only on the dendritic integration but also on the somatic resting potential and spiking threshold.Thus, to identify the contribution of EF-regulated dendritic integration to AP generation, two different types of activity backgrounds (extracellular EF and current clamp stimulation at soma)are considered,which produce an equal amount of somatic polarization but only the former induces the pronounced polarization in dendritic tufts.By comparing the stimulus threshold of clustered synaptic inputs in the two cases, it is found that the EF-regulated supralinear dendritic integration and EF-induced somatic polarization have an antagonistic effect when the background synapses induce NMDA spike, due to the leading role of NMDA spike threshold in determining EF effects.
2.Method and models
2.1.Underlying physics
As mentioned above, TMS can use the EF induced in brain to regulate brain function.However, the complex brain structure and TMS parameters make it difficult to directly explore how the TMS regulates brain activities.Hence, the effects of TMS can be studied form two aspects: (i)the distribution of induced EF;(ii)the influence of EF on neuronal activities.In order to describe the EF distribution in brain, the finite element method withA–Vformula is usually used,whereAandVrepresent the magnetic vector potential and electric scalar potential,respectively.The fundamental theoretical basis of TMS is the Maxwell’s classical electromagnetic theory.According to Ampere’s law, an alternating current in the coil produces a time-varying magnetic field,namely,
whereHis the curl of the magnetic field intensity,Jis the conduction current density, and∂D/∂tis the displacement current density at this point.According to Faraday’s law,this magnetic field generates a timing-varying electric fieldEas follows:
whereBrepresents the magnetic flux density.Thus according to Ohm’s law, the relationship amongE, tissue conductivityσ,and eddy currentJinduced in the head can be represented by
Considering the Dirichlet condition of magnetic insulation on the external boundary(Eq.(4))and the Neumann condition of continuity on all of the internal boundaries (Eq.(5)), a large system of linear equations similar to Eq.(6) given for each mesh node is solved for the magnetic vector potential.Then,the magnetic field(Eq.(7))and the electric field(Eq.(8))can be easily calculated from the known magnetic vector potential.
wherenis a vector normal to the body surface, andµis the magnetic conductivity.With these equations, it has been pointed out the contribution of gross anatomy (e.g.scalp and skull thickness, head diameter, skull-to-brain distance, and cortical folding) and microscopic structure (e.g.tissue heterogeneity and anisotropy)to the EF distribution in brain,[26]and pointed out that the EF intensity ranges from 0 V/m to 100 V/m in brain.[27]For the influence of EF on neuronal activities, it is found that the induced EF in brain gives rise to spatial polarization along the somato-dendritic axis of a neuron, which is the basis of TMS’s modulation effect on brain function.Also,the contribution of spatial polarization induced by uniform EF to neuronal I/O relationship from the point of view of spike timing, synaptic plasticity, and ionic dynamics has also been studied[15,17]In the present work, we study the influence of EF-regulated dendritic integration of interneuron on neuronal I/O,which has been rarely reported.
2.2.Multi-dendritic branch circuit model of interneuron


Fig.1.Simplified interneuron models: (a) cable model of singledendritic branch,(b)three-compartment circuit model,and(c)its equivalent model with same extracellular potential,(d)multi-dendritic equivalent circuit model of interneuron.

Then we use the single-dendritic branch model to build a multi-dendritic equivalent circuit model that hasnidentical dendrites as shown in Fig.1(d).Each dendritic branch is composed of a proximal dendritic compartment and a distal dendritic compartment receiving NMDA synapses.All the proximal dendrites are connected in parallel with soma compartment through axial conductancegins.The passive parameters(dendritic length,diameter)of each dendrite are the same as those of the single-dendritic model.This model describes the process of dendritic integration from synaptic input, dendritic filtering to somatic output.Thus, the state equation of multi-dendritic branch model can be expressed as

2.3.Computational models with realistic dendritic morphology and EF stimulation
To validate the theoretical predictions obtained with multi-dendritic circuit model, we use a CA1 hippocampal cell[28](ModelDB entry 28316) and two realistic cortical interneurons including a layer-3 interneuron and a layer-4 interneuron[20](ModelDB entry 55035)to explore how EF regulates the dendritic integration of NMDA synapses.Also they are used to explore how the EF-regulated dendritic integration of NMDA synapses contributes to the generation of an action potential.The hippocampal interneuron in CA1 has a soma and 75 dendrites,and the diameters of its dendrites range from 1.38 µm for the proximal dendrites to 0.61 µm for the distal dendrites.Its dendritic length ranges from 70µm to 330µm,and the surface area of this model is 9.884×10⁻⁵cm2.Layer-3 interneuron has a soma and 49 dendrites,and the diameters of the dendrites span from 2.8µm to 0.68µm as the distance between dendrites and soma increases.Layer-4 interneuron has a soma and 80 dendrites,and the dendritic diameters span from 0.25 µm to 3.375 µm.Herein for each compartment, membrane resistivity is 20 kΩ·cm2, axial resistivity is 120 Ω·cm,and membrane capacitance is 1µF·cm-2.In order to generate action potentials, the fast sodium and delayed rectifier potassium channels are inserted in the soma.Other dendritic compartments are passive, unless otherwise stated, in order to ignore the influence of other voltage-gated ions on the dendritic integration of NMDA synapses.The sodium current(INa)and potassium current(IK)are calculated from the general form of
Here,gionis the local conductance density,specifically,gK=0.0319 S/cm2,gNa= 0.01 S/cm2;Eionis the reversal potential for individual channel, concretely,ENa=90 mV andEK=-100 mV;mis an activation gating variable andhwas an inactivation gating variable.The relation between time and voltage each gating variable(u)follows a first-order ordinary differential equation in the form of
whereαuis the forward rate andβuis the backward rate.In Table 1 are listed the specific rate functions forINaandIK.
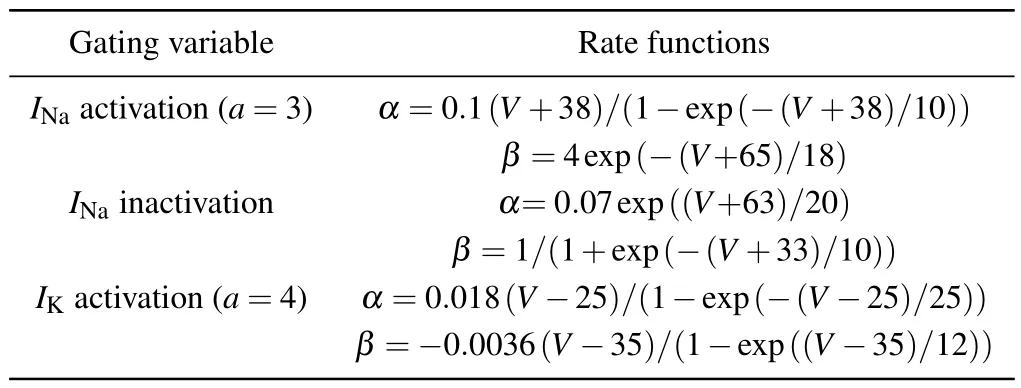
Table 1.Rate functions.

Fig.2.EF-induced polarizations for different interneurons,showing false color map of membrane voltage for(a)CA1 interneuron(left), (b)a layer-3 interneuron (middle), and (c) layer-4 interneuron (left) under anodal stimulation (E =20 V/m, top panel) and cathodal stimulation(bottom panel,E =-20 V/m),membrane polarization in(d)soma(∆Vsoma)and(e)distal dendrites(∆Vdend)as a function of EF intensity for CA1 interneuron(blue),layer-3 interneuron(pink),and layer-4 interneuron(green).
The kinetics of NMDA current[20]is modeled as follows:
wheregNMDA(0.3 nS) represents the maximum conductance of an NMDA-type synapse,Esynis the reversal potential of 0 mV, andVrefers to the local membrane potential of distal dendrites.These NMDA synaptic inputs are placed at distal dendrites 100µm away from the soma.
The uniform EF(in units V/m)applied to the interneuron is parallel to the somato-dendritic axis of the interneuron.And we model the implementation of EF stimulation through the extracellular mechanism in NEURON.[29]And we refer to the EF stimulation with anode closer to apical dendrites as anodal stimulation (Figs.2(a)–2(c)), and refer to the EF stimulation with the cathode closer to apical dendrites as cathodal stimulation(Figs.2(a)–2(c)).As can be seen,the dendritic polarization is more significant than somatic polarization (Fig.2(d).However, both the somatic and the dendritic polarization of interneuron are much smaller,owing to their radially symmetrical dendritic morphologies,than those of pyramidal neurons.To keep the somatic response at subthreshold state,EF stimulation ranges from-20 V/m to 30 V/m.
Moreover,the real morphological neuronal model is simulated by using the platform of NEURON 7.1.[30]The integration time step is 0.1 ms, and simulation takes 700 ms.Both NMDA synaptic inputs are activated 300 ms after the beginning of simulation,that is,when the resting potential of a neuron reaches its stable state.
2.4.Synaptic activation and analysis of input–output relationship
Since both cluster and scatter NMDA synaptic input can trigger dendritic NMDA spike, here we study two types of dendritic integrations of NMDA synaptic inputs: global strategy(Fig.4(a))and local(Fig.4(b))strategy,pointing out that the dendritic integration can be depicted by the relationship between the number of synaptic inputs and the observed excitatory postsynaptic potential(EPSP).[22]As a neuron is exposed to EF stimulation, the observed EPSP of EF-regulated dendritic integration is referred to as the difference between peak somatic membrane potential and stable EF-regulated resting potential.[24]For the observed EPSP at soma, it is obtained with simultaneously activated synaptic inputs.
As described above, the generation of dendritic NMDA spike causes the steep variation of supralinear dendritic integration of NMDA synapses, and the synaptic driving force determines the saturation output.Thus, the threshold of dendritic NMDA spike is measured as the number of synaptic inputs required to produce a 15-mV increment in somatic EPSP amplitude above projected single synaptic input.And the somatic EPSP refers to the dendritic saturation output (Vsau) as the neuron receives 80 synaptic inputs.To quantify the modulation effect of EF stimulation on dendritic saturation output,we define a coupling constant related to EF-modulated dendritic integrationKdendwhich is computed as the variation of dendritic saturation output in response to unit EF.
It is reported that the dendritic integration builds a bridge between neuronal input and output by transforming synaptic inputs into synaptic potential and transmitting them into soma.However, the neuronal output not only relies on the dendritic integration,but also on the degree of somatic polarization and on the spiking threshold.To identify the influence of EFregulated dendritic integration on AP generation, we apply a current clamp to soma to reproduce the EF-induced somatic polarization.[24,25]The difference between EF stimulation and current clamp stimulation is the little dendritic polarization in the case of current clamp stimulation.Therefore, the respective contribution of EF-regulated dendritic integration and EFinduced somatic polarization to AP generation can be identified by comparing the synaptic threshold under the EF stimulation with that under the current clamp stimulation.
2.5.Dynamic of dendritic integration
2.5.1.Dynamic analysis of superlinear dendritic integration based on singular perturbation theory
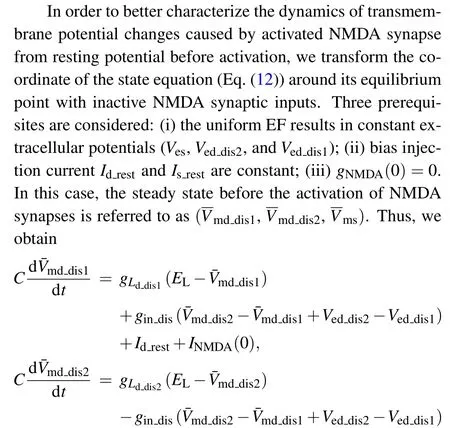
According to Ref.[24], we use the singular perturbation method to separate multi-timescale dynamic systems into two distinct time-scale subsystems,i.e.,a fast one and a slow one,in order to explore the dynamic mechanism behind the EFregulated dendritic I/O relationship of NMDA synapses.Here,introducing a perturbation parameterεinto the state equation Eq.(18),we obtain a perturbation system as shown in the following:
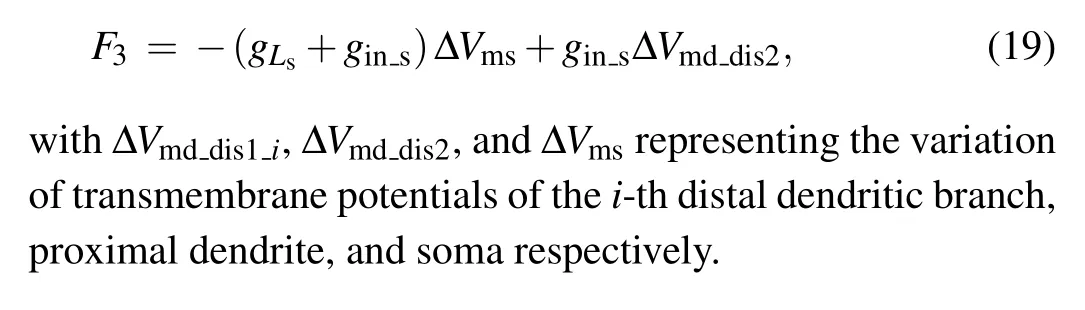
whereF(·)is defined by Eq.(19)andG(t)is the derivative of known NMDA synaptic input vector.
Letε →0,then we will be able to obtain a fast timescale subsystem and a slow time-scale subsystem.We pay more attention to the fast subsystem due to its important role in determining the asymptotic dynamics of the original system.Further its stable equilibrium branches contribute to constructing the manifold of the slow subsystem dynamics.And the fast subsystem can be described with
Then we compute the equilibrium point of fast subsystem by defining a constant state vector and a constant NMDA synaptic input vector as

2.5.2.Asymptotic expression of subthreshold input–output relationship
It is pointed out that the relationship between the maximal EPSP amplitude and the maximal NMDA input conductance can be used to describe the EF-regulated dendritic integration for pyramidal neuron by omitting the response delay caused by perturbation parameterε.[24]Here, we test the influence of perturbation parameterεon the input–output relationship and find that the discrepancy between the numerical solution of original system(Eq.(18))and the equilibrium point of fast subsystem decreases with reducingε(Fig.3(c)).Since smallerεleads to less delay of somatic membrane potential in response to constant NMDA synaptic inputs(Figs.3(a)and 3(b)),the equilibrium mapping of fast subsystem may be used to qualitatively predict the trend of the input–output relationship of dendritic integration for interneuron.
Here we consider a general case in which there arenmsynactive synapses distributed onldistal dendritic branches and a single activated dendrite receivesmactive synapses.Thus,m,l,andnmsynsatisfy the following condition:

then we can obtain a mathematical analytical expression for the asymptotic output at distal dendritic branches withlvalue identical,receivingnmsynactivated NMDA synapses,namely,bifurcation,we perform the following manipulation:
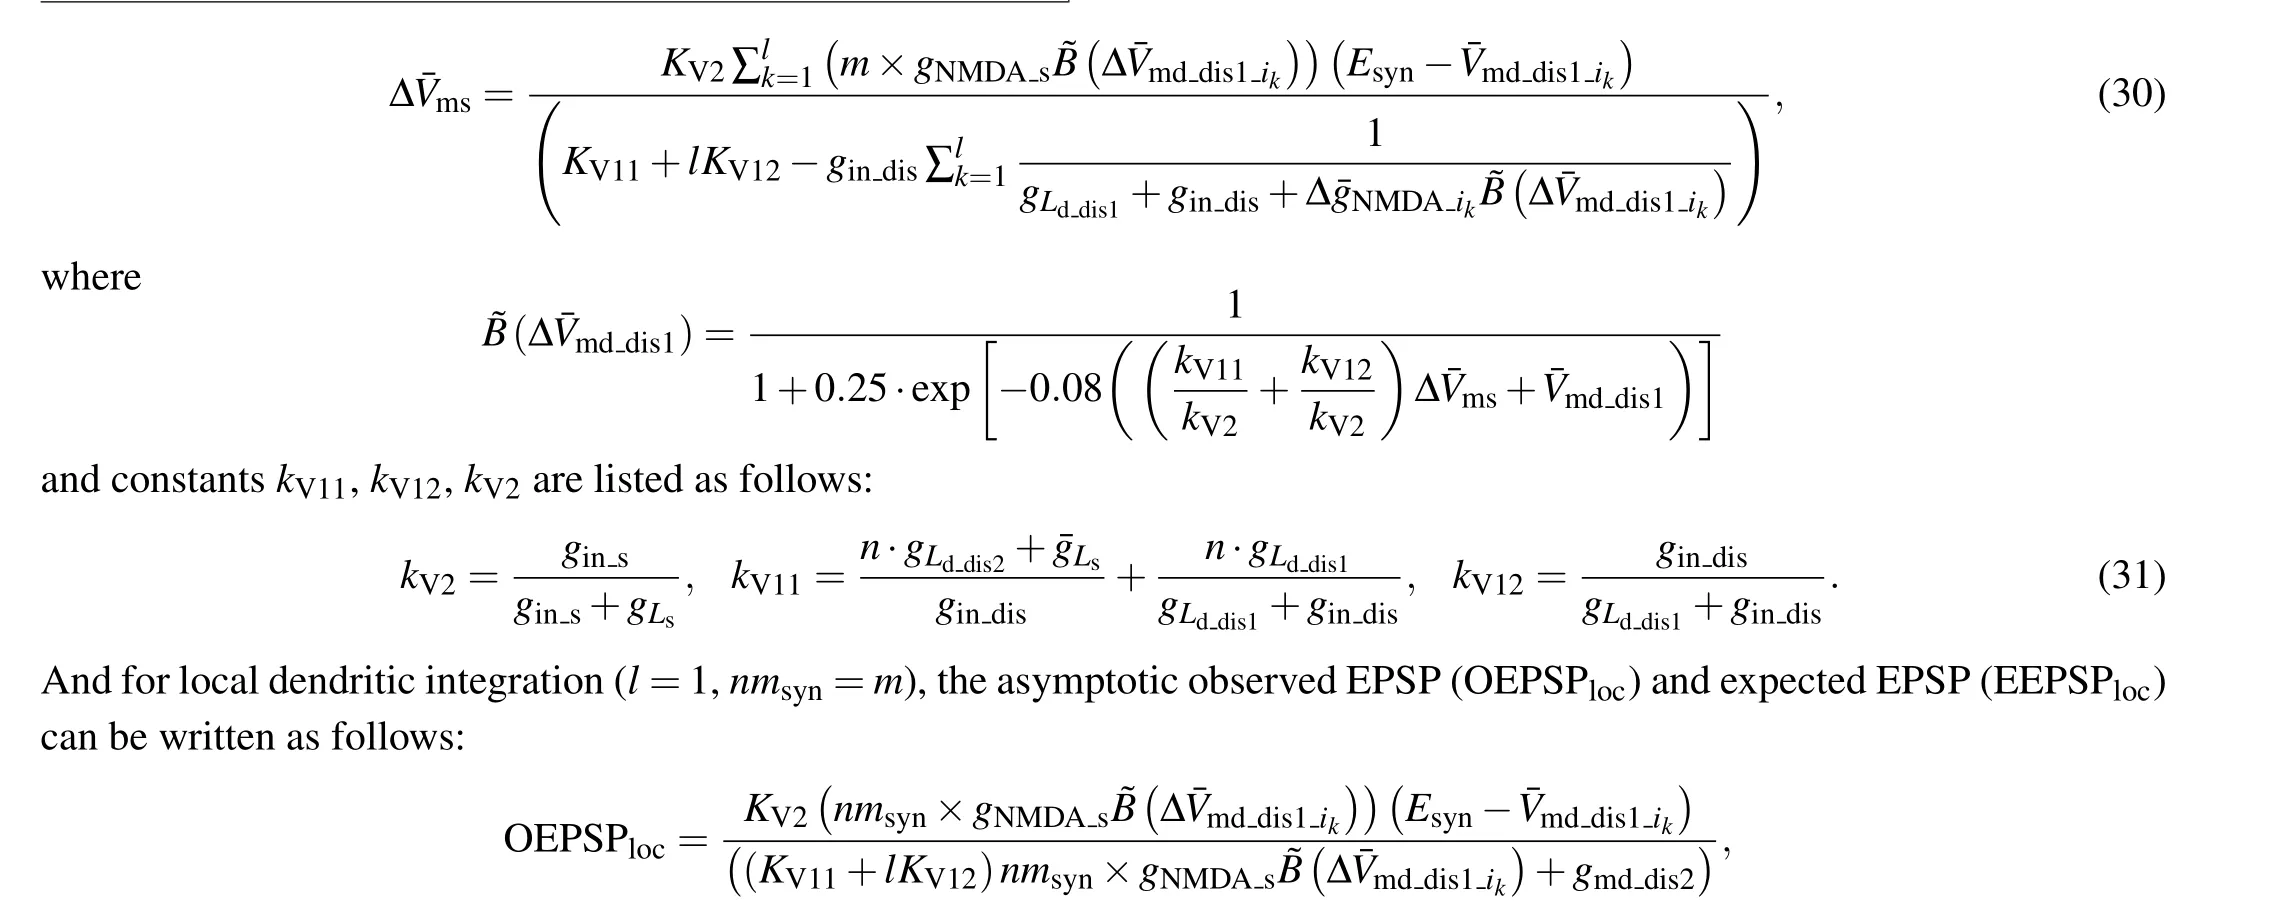


Fig.3.Influence of perturbation parameter ε on dynamic properties of dendritic supralinear integration.(a) Left: the change of ∆Vms against timevarying synaptic conductance for 10 (yellow), 30 (orange), and 50 (blue)NMDA synaptic inputs.Right:peak ∆Vms against maximum NMDA synaptic conductance for ε =1;(b)similar to panel(a)but for ε =0.2;(c)comparision between equilibrium point and numerical solution of Eq.(18) for ε =0.2, 0.6, and 1 when the interneuron model has one dendrite receiving NMDA synapses;(d)the deviation degree of sI/O relationship from equilibrium.
The solution of Eq.(35)is the saddle-node bifurcation,and the corresponding conductance of NMDA synapses represents the dendritic NMDA spike threshold.
It should be noted that the generation of a dendritic NMDA spike results from the saddle-node bifurcation,which increases difficulty for us to obtain an explicit expression of dendritic I/O relationship.In order to obtain the saddle-node
3.Results
3.1.Effect of dendritic polarization on dendritic integration
At first, with Eqs.(32) and (34) we predict the influence of EF-induced dendritic polarization on dendritic integration as an interneuron receives scattered or clustered synaptic inputs.Here the EF-induced polarization is represented with the different resting potentials at a stable state.AndV¯mddis1=-64 mV refers to the control case (E= 0).As shown in Fig.4, we find that at low intensity of synaptic inputs the dendritic hyperpolarization induced by anodal stimulation increases the threshold of triggering dendritic NMDA spike for both local and global dendritic integrations of NMDA synapses by reducing the dendritic excitability,while the dendritic depolarization induced by cathodal stimulation facilitates the NMDA spike generation by improving dendritic excitability(Fig.4(d)).Therefore,the steep change of dendritic I/O relationship moves leftward under cathodal stimulation,but rightward in the case of anodal stimulation.For example, when the resting potential of distal dendrite ranges from-64 mV to-68 mV,the number of scattered synaptic inputs that trigger NMDA spike of dendrite increases from 7 to 9,but when the resting potential of distal dendrite ranges from-64 mV to-60 mV,it decreases from 7 to 6(Figs.4(a)and 4(b)).With the number of NMDA synapses increasing, the dendritic I/O function reaches a plateau.When an interneuron is subjected to EF stimulation, the dendritic saturation output increases under anodal stimulation but decreases under cathodal stimulation(Fig.4(c))due to the increasing driving force within EF stimulation.Comparing the variation of dendritic saturation output in response to unit EF stimulation, we find that the modulation effect of EF on global dendritic integration is more effective than on local dendritic integration(Figs.4(c)and 4(d)).

Fig.4.Effect of EF-induced polarization on dendritic integration, showing variation of (a) local and (b) global dendritic integrations in the case of V¯md dis1 = -68 mV (blue), V¯md dis1 = -64 mV (magenta), and V¯md dis1 =-60 mV(green),change of(c)dendritic saturation output and(d)stimulation threshold for triggering NMDA spike against the varying V¯md dis1, dendritic I/O curve of (e) local and (f) global dendritic integrations for hippocampal interneuron in CA1 neuron under EF stimulation (blue, E =20 V/m; black,E =0; red, E =-20 V/m), variation of stimulation threshold for triggering dendritic NMDA spike in response to different EF stimulations for (g) clustered and (h) scattered synaptic distributions, (i) variation of dendritic saturation output with EF intensity for global (brown triangle) and local (green triangle)dendritic integrations, and(j)sensitivity of modulation effect of EF for global(brown)and local(green)dendritic integrations.
Then with a hippocampal interneuron in CA1,we validate our predictions and find that comparing with no EF stimulation, the anodal stimulation makes the stimulation threshold for triggering dendritic NMDA spike increase by 3 synapses for local dendritic integration and it increases by 9 synapses for global dendritic integration.On the contrary, the stimulation threshold under cathodal stimulation decreases by 1 synapse for local dendritic integration and it decreases by 5 synapses for global dendritic integration.These results suggest that the EF-induced hyperpolarization inhibits the generation of dendritic NMDA spike by reducing the neuronal excitability while the EF-induced depolarization facilitates the generation of dendritic NMDA spike by increasing neuronal excitability(Figs.4(g)and 4(h)).Similarly, the dendritic saturation output increases under anodal stimulation due to the increasing driving force while in the case of cathodal stimulation it decreases because of the increasing driving force.Further,we find that unit EF makes the output of global dendritic integration change 0.03 mV but make the output of local dendritic integration change 0.02 mV (Fig.4(j)), which suggests that the modulation effect of EF on global dendritic integration is more effective than on local dendritic integration.These results demonstrate the effectiveness of our prediction.
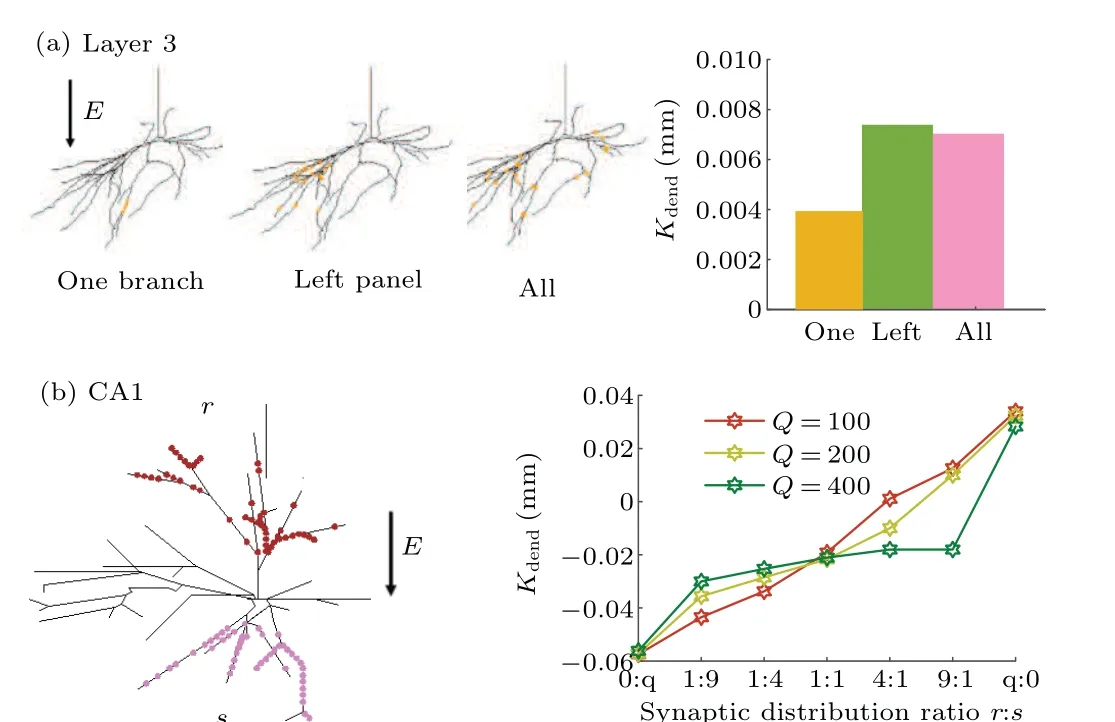
Fig.5.Effects of asymmetric synaptic distribution on EF-regulated dendritic integration.(a) Left panels: schematic diagram of experiment for observing Kdend with 80 synapses distributed on a branch, all branches at left panel,and all branches of a layer-3 interneuron, and right panel: Kdend for the experiment at left panel, with orange bar representing synapses located on one branch,green bar denoting synapses located on all branches at left panel,pink bar referring to synapses located on all branches at left panel.(b)Left panel:schematic diagram of experiment for observing the Kdend with synapses being quantitatively and randomly along the two poles of EF, r and s referring to the number of synapses distributed on anode and cathode of EF, respectively.Right panel: Kdend for experiment at left panel, with total number of synapses Q being 100(dark orange),200(light green),and 400(dark green)respectively.
As described above,the modulation effect of EF on dendritic integration depends on the synaptic distribution.Owing to the ignorance of dendritic spatial distribution in multidendritic circuit model, here we use two neuronal models with real morphologies to study how the asymmetric synaptic distribution affects the EF-regulated dendritic integration as shown in Fig.5.First, with a layer-3 interneuron we observe the variation ofKdendwhen the synaptic distribution ranges from a dendrite to all dendrites, and find thatKdendfirst increases and then decreases.Since the reduction of driving force first decreases with the increase of the number of dendritic branches receiving synaptic inputs due to the full use of global polarization of the electric field, and then it increases when these synapses are distributed on all branches due to the counteraction of dendritic polarization.Then with an interneuron in CA1 we explore how the distribution symmetry of synaptic activation positions along the EF direction affects theKdendas shown in Fig.5(b).Our results show that when the synapses are distributed asymmetrically along the two poles of EF,the more obvious the difference,the larger theKdendis.Especially,all the synapses are mainly distributed near one pole of EF,theKdendreaches a maximum value.These results suggest that the EF-modulated global dendritic integration prefers the asymmetric distribution of NMDA synapses.
3.2.Modulation effects dependent on dendritic morphology
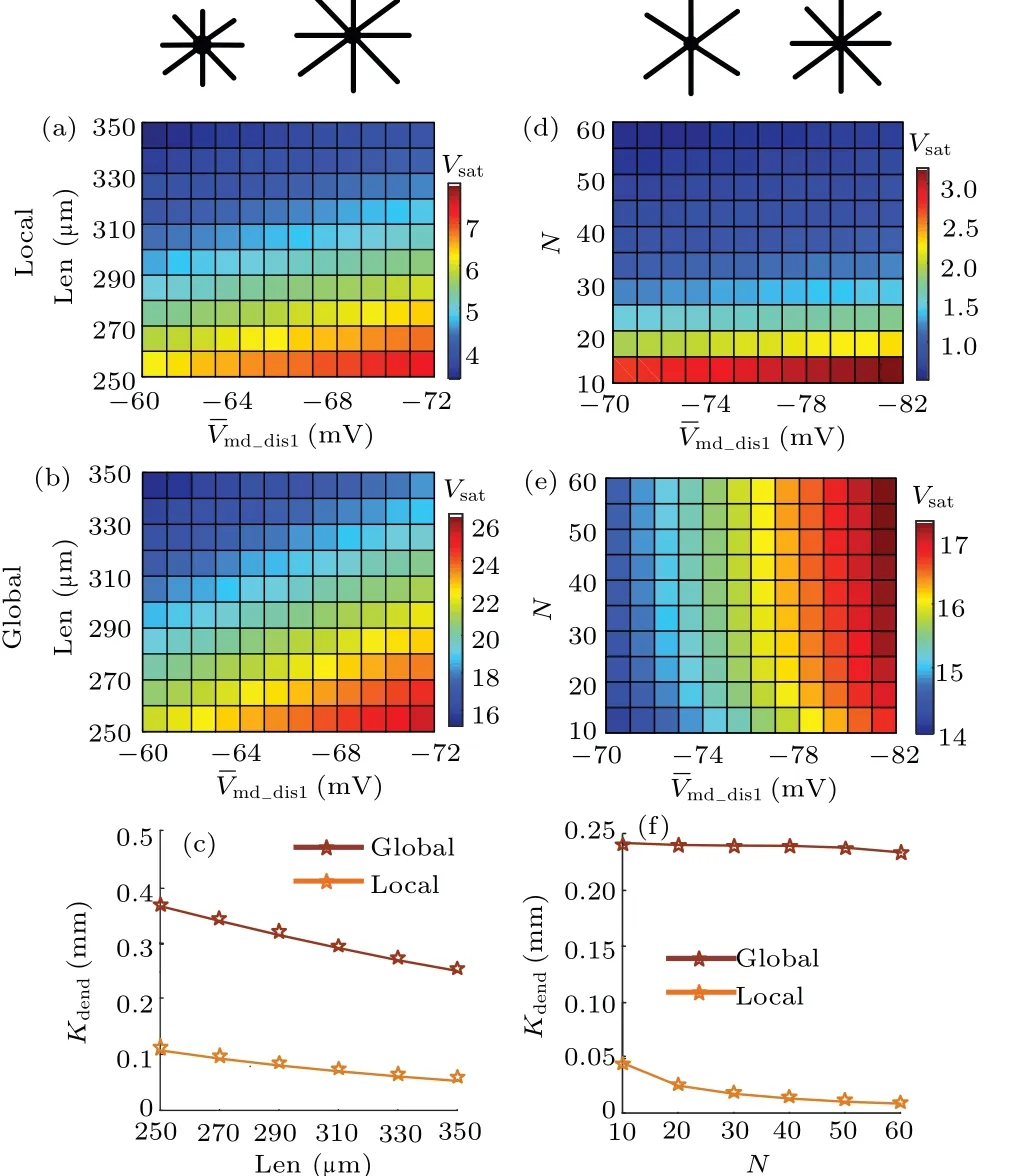
Fig.6.Effects of dendritic morphology on EF-regulated sublinear dendritic integration.Variation of dendritic saturation output of sI/O with EF intensity for (a) focal and (b) global distributions with length of proximal dendrites Len changing between 250µm and 350µm at steps of 10µm,and n=10.(c)Sensitivity of modulation effect of EF for local (orange) and global (brown)dendritic integrations, with Len changing.Variation of dendritic saturation output of sI/O with EF intensity for(d)local distribution in panel(a)and(e)global distribution in panel(b),with the dendritic branch n changing between 10 and 60 at steps of 10, and Len=360 µm.(f) Sensitivity of modulation effect of EF for local(orange)and global(brown)dendritic integrations with n varying.
Experimental studies[13,16]pointed out that dendritic morphology plays an important role in determining the EFinduced polarization along the somato-dendritic axis.Also,the dendritic morphology affects the local and global dendritic integration.[20]In this subsection,we study the contribution of dendritic morphology to EF-regulated dendritic integration as shown in Fig.6.Acting as an important dendritic morphology parameter, dendritic length (Len) affects the EF-induced spatial polarization.[16]It can be found that longer dendritic branch results in less prominent modulation effect of EF on dendritic integration, for the increased input resistance rather than the increased EF-induced polarization plays a dominant role in determining the dendritic saturation output(Figs.6(a)and 6(d)).Another important dendritic morphology is the number of dendritic branches (n).We find that for both local and global dendritic integrations,Kdenddecreases with the augment of dendritic branches,which results from the increasing current shunt(Fig.6(f)).Differently,the modulation effect of EF on global dendritic integration is more effective than on local dendritic integration for different neurons(Figs.6(b)and 6(d)).These results show that dendritic morphology plays a key role in determining EF-regulated dendritic integration of NMDA synapses.

Fig.7.Contribution of dendritic length and the number of dendritic branches to EF-regulated dendritic operation.(a) Schematic diagram of NMDA synapses distributed on two dendritic branches with different distances to soma.(b) Coupling constant Kdend for experiment in panel (a), schematic diagram of clustered and scattered distributions of synaptic inputs on a hippocampal interneuron in(c)CA1 and(e)a layer-4 interneuron,respectively.Coupling constant Kdend with NMDA synapses (d) clustered and (f) scattered on the hippocampal interneuron in CA1 in panel (b) and the layer-4 interneuron in panel(d).
Actually,the different dendritic morphologies exist in different interneurons.To demonstrate our theoretical results,we utilize a layer-4 interneuron with more dendrites and an interneuron in CA1 with less abundant dendrites(The details of these models are given in Section 2)to observe the influence of dendritic morphologies on EF-regulated dendritic integration(see Fig.7).It can be found that the modulation efficacy of EF on local dendritic integration of longer dendrites is higher than that of shorter dendrites(Fig.7(b))due to its more significant EF-induced polarization.Comparing Fig.7(c)with Fig.7(e),we find that for local dendritic integration and global dendritic integration,the modulation efficacy of EF in layer-4 interneuron is smaller than that in CA1 interneuron due to more current shunt caused by increasing dendritic branches.These results are in accordance with the predictions described above.
3.3.Contribution of EF-regulated dendritic integration to AP generation
As described above, the neuronal output depends on the peak membrane potential (Vm) at soma.Only whenVmis beyond the spike threshold, will an AP generate.Therefore,to study the contribution of EF-regulated dendritic integration to AP generation, we first observe the influence of NMDAmediated supralinear dendritic integration on somatic actual membrane potential when the neuron is subjected to EF stimulation with EFs by characterizing the relationship between the observed membrane potential at somaVmand the number of synapses.
As shown in Fig.8(b), cathodal stimulation reduces the NMDA-spike threshold while anodal stimulation increases the NMDA-spike threshold.Contrarily, under cathodal stimulation the peakVmdecreases while it increases in the case of anodal stimulation.Next, we use the current clamp stimulations at soma to reproduce the EF-induced somatic polarization, which has little effect on dendritic polarization.This allows us to determine the contribution of EF-regulated dendritic integration to AP generation by observing the somatic output in the case of EF stimulation and in the case of current clamp stimulation.Here to make soma generate an AP as soon as possible, we adoptgNa=0.02 S/cm2,gK=0.03 S/cm2,andgNMDA=0.1 nS.The results are shown in Fig.8(c).We find that cathodal stimulation reduces the threshold for generating AP while anodal stimulation increases the synaptic threshold for triggering an AP, which suggests that the dendritic NMDA spike threshold plays an important role in determining AP generation.Under the anodal stimulation, the soma is depolarized while the EF-regulated dendritic NMDA spike threshold increases.In the case of cathodal stimulation,the soma is hyperpolarized while the NMDA spike threshold decreases.These results indicate that EF-regulated dendritic NMDA spike threshold and EF-induced somatic have antagonistic effects on facilitating AP generation no matter what EF stimulation it is.
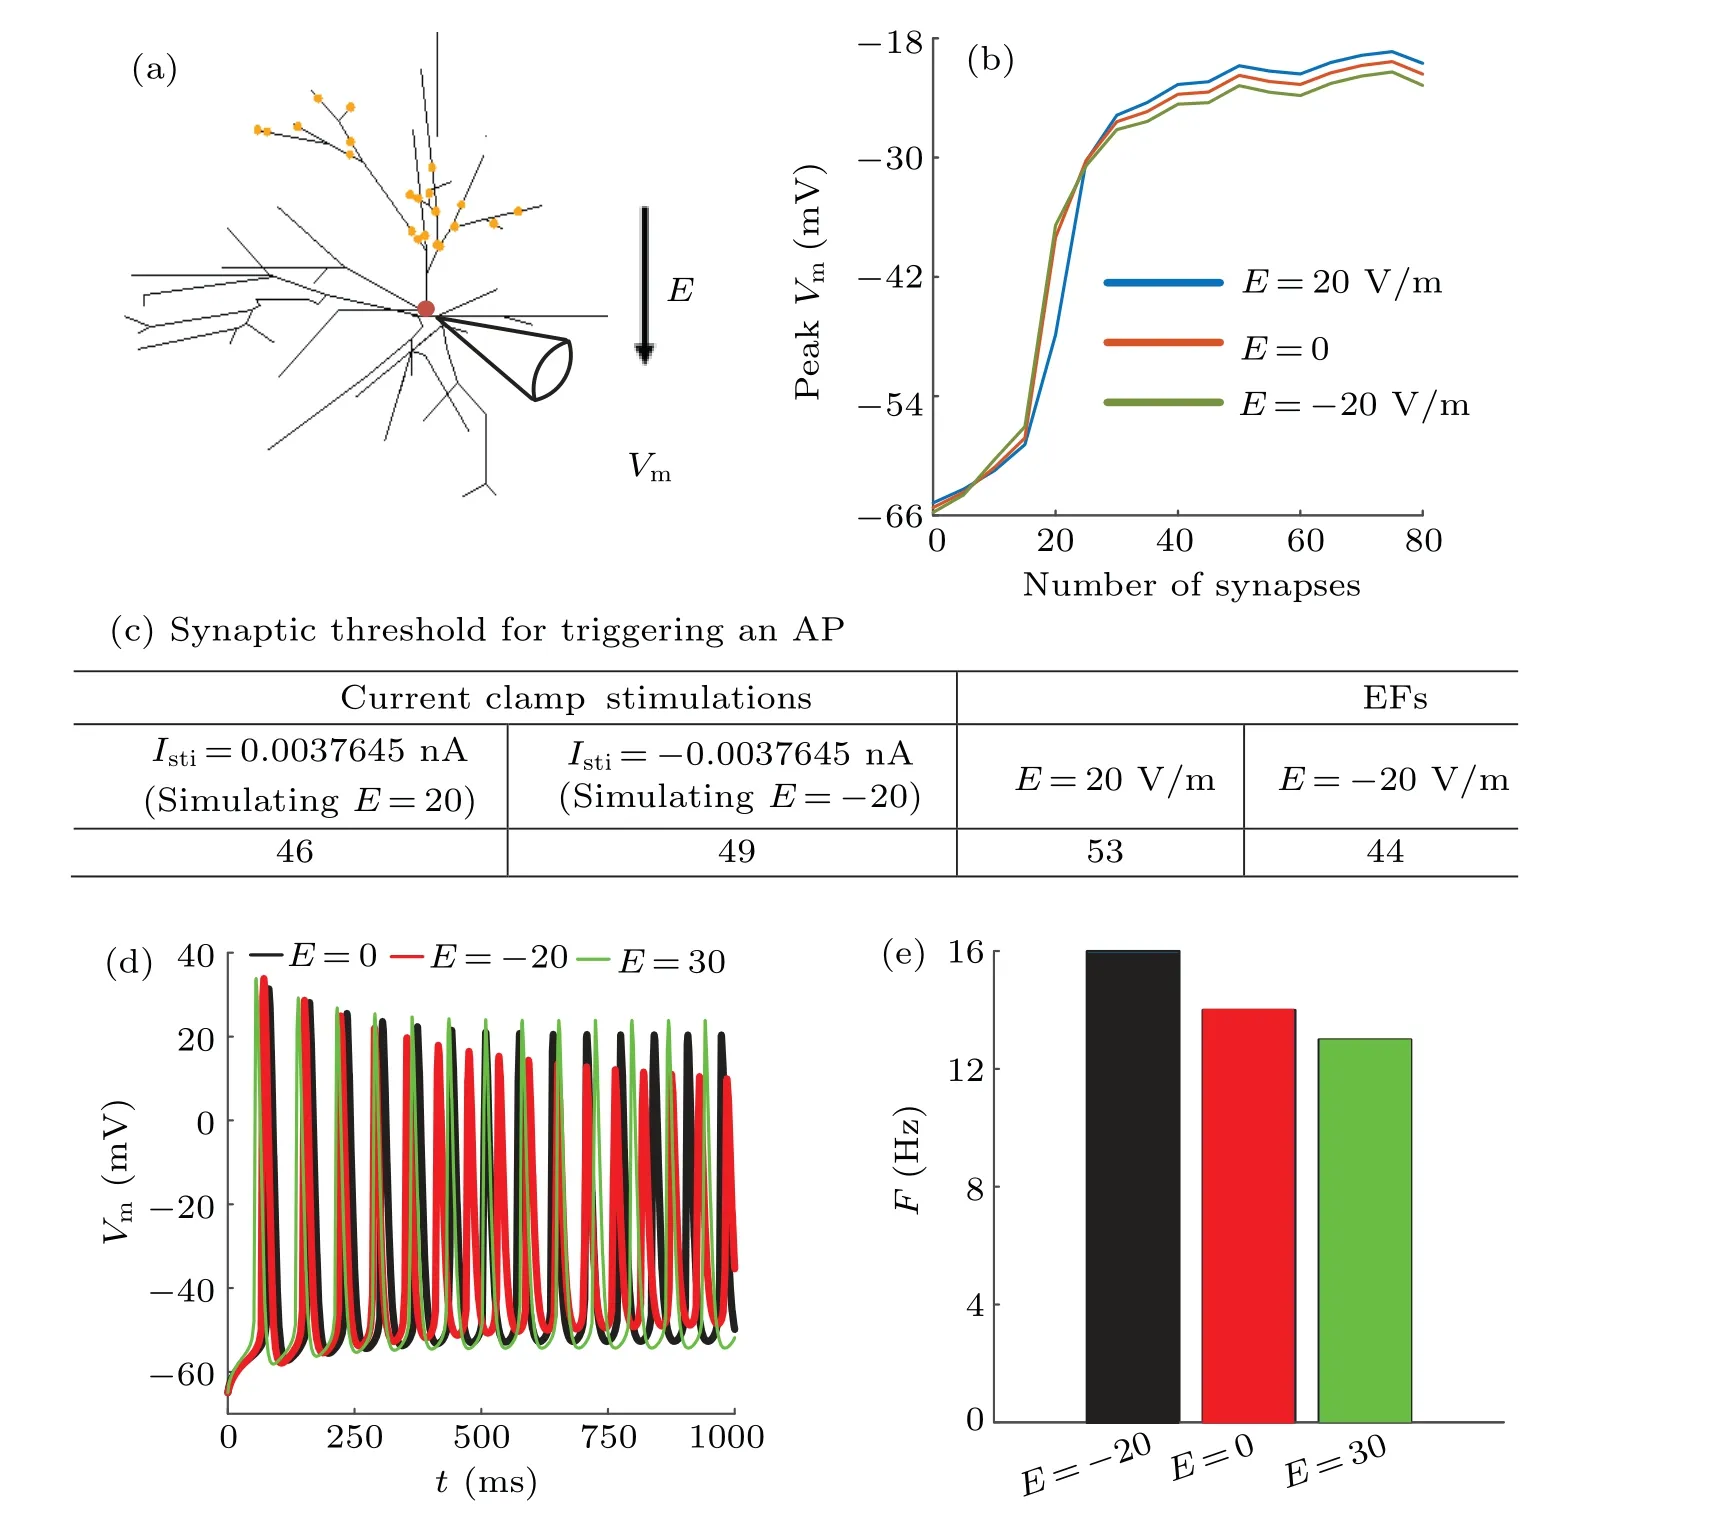
Fig.8.Effects of EF-regulated dendritic integration on AP generation.(a) Schematic diagram of experiment for exploring effect of EFregulated dendritic integration on AP generation,(b)relationship between peak somatic membrane potential and EF stimulation at E=20 V/m(blue), E =0 (orange), E =-20 V/m (green), (c) synaptic threshold for triggering an AP in the case of EF stimulation and current clamp stimulation, (d)firing pattern at E =-50 V/m(black), E =0(red), E =50 V/m(green), and(e)firing rate at E =-50 V/m(black), E =0(red),E=50 V/m(green).
Further,it should be noted that the main output of a neuron is its firing pattern and rate.Therefore,we study how much the firing rate of an interneuron is modulated by EF stimulation in the case of a certain pattern of synaptic input,and the results are shown in Figs.8(d)and 8(e).Here only soma is active andgNa=0.04 S/cm2,gK=0.03 S/cm2, andgNMDA=0.3 nS.To modulate its excitability, the soma receives a bias current whose amplitude is 0.05 nA.We find that the anodal stimulation reduces the number of action potentials while the cathodal stimulation increases the number of action potentials, which results from the variation of dendritic NMDA spike threshold in response to EF stimulation.Correspondingly,the firing rate under anodal stimulation decreases by 1 Hz while it increases by 2 Hz in the case of cathodal stimulation.These results indicate that the EF-regulated dendritic integration of NMDA synapses plays a crucial role in determining the interneurons’output.
4.Conclusions and perspectives
We studied whether EF can modulate the neuronal responses of an interneuron by modulating the dendritic integration of NMDA synapses with EF-induced polarization at distal dendrites.We find that the anodal EF-induced hyperpolarization at distal dendrites increases the NMDA spike threshold by reducing the neuronal excitability,and it also increases the dendritic saturation output by increasing the driving force of synaptic inputs.On the contrary, the dendritic depolarization under cathodal stimulation reduces the NMDA spike threshold by increasing the neural excitability, and it also reduces the dendritic saturation output by reducing the driving force.Thes results are consistent with the modulation effect of EF on pyramidal neuron.[24,25]Also, we identify the effects of dendritic morphology(dendritic length and branches),synaptic distributions(cluster and scatter)on EF-regulated dendritic integration.Our results show that the modulation influence of EF on global dendritic integration is more prominent than on local dendritic integration.And for local dendritic integration EF modulation prefers longer dendrites and less dendritic branches.However, for the global dendritic integration,the EF modulation prefers asymmetric synaptic distribution.And when the EF is parallel with the dendrites receiving synapses, the modulatory effect is most significant.Further,by identifying the synaptic threshold in the case of EF stimulation and current clamp stimulation,we find that the cathodal stimulation reduces the threshold for generating AP while anodal stimulation increases the synaptic threshold for triggering an AP due to the key role of dendritic NMDA spike threshold in determining AP generation.Considering the EFinduced somatic polarization and the variation of NMDA spike threshold under EF stimulation, our results indicate that EFregulated dendritic NMDA spike threshold and EF-induced somatic have antagonistic effect on facilitating AP generation no matter what EF stimulation it is.This study first discovers the modulation of EFs on the I/O function of a single interneuron from the viewpoint of NMDA receptor-mediated supralinear dendritic integration,which provides a theoretical basis for explaining the mechanism of TMS technology modulating brain function.
Acknowledgements
Project supported by the National Natural Science Foundation of China(Grant No.62171312)and the Tianjin Municipal Education Commission Scientific Research Project,China(Grant No.2020KJ114).
- Chinese Physics B的其它文章
- Unconventional photon blockade in the two-photon Jaynes–Cummings model with two-frequency cavity drivings and atom driving
- Effective dynamics for a spin-1/2 particle constrained to a curved layer with inhomogeneous thickness
- Genuine entanglement under squeezed generalized amplitude damping channels with memory
- Quantum algorithm for minimum dominating set problem with circuit design
- Protected simultaneous quantum remote state preparation scheme by weak and reversal measurements in noisy environments
- Gray code based gradient-free optimization algorithm for parameterized quantum circuit