
Characteristics of cell motility during cell collision
2024-02-29 09:19YikaiMa马一凯NaLi李娜andWeiChen陈唯
Chinese Physics B 2024年2期
关键词:李娜
Yikai Ma(马一凯), Na Li(李娜), and Wei Chen(陈唯),‡
1State Key Laboratory of Surface Physics and Department of Physics,Fudan University,Shanghai 200438,China
2China National Center for Bioinformation,Beijing 100101,China
3National Genomics Data Center,Beijing Institute of Genomics,Chinese Academy of Sciences,Beijing 100101,China
Keywords: cell migration,random walk,cell–cell interaction
1.Introduction
The exploration of cellular motion and interaction represents a fascinating crossroads within the fields of biology and physics.Insights garnered from this area critically inform our understanding of crucial mechanisms underpinning the migration of cells across a range of environments, thus shedding light on their indispensable roles in pivotal processes including development,tissue genesis,and immune response.[1–4]Physical contact between cells is frequently observed amid cellular motion, and an in-depth analysis of cell-to-cell interactions during these encounters is essential to fully grasp the nuances of cellular communication and coordination.[5–7]Longrange interactions between cells, mastered via chemotaxis,[8]greatly influence cellular behavior.[9,10]Dictyostelium discoideum (Dicty) cells are widely utilized as a model organism for such analysis, especially probing into cell migration behavior.[11]In an environment devoid of nutrients, Dicty cells initially demonstrate autonomous behavior.However,beyond a certain period, typically ranging a few dozen hours,these cells instinctively aggregate to form slime molds.Here,collective migration ensues, culminating in spore formation.Throughout this progression, Dicty cells manifest unique migration,aggregation,and cellular differentiation behaviors that have evoked keen scientific interest.Notably, the interactions between Dicty cells during migration epitomize classic chemotactic mechanisms.[12]Dicty cells secreting cAMP present an intriguing model for physicists, as adjacent cells dictate their movement direction by sensing the concentration gradient of cAMP.[12,13]Numerous studies have focused on the behavior of cellular motion under chemical concentration gradients for Dicty cells.[14–17]However, the primary focus of such research lies in the collective motion effects in cell groups, leaving a scarcity of experimental research examining individual cellular trajectories under Dicty cell interactions particularly during dyadic collisions.In this study, we therefore experimentally evaluated the nature of cell interactions and relevant motion behavior during collisions under varying conditions.We noticed marked alterations in cellular motion patterns preceding cell collisions, indicative of clear interactions between cells.Our research categorizes the transformations in cellular motion behavior during encounters and provides a quantitative analysis of the physical metrics related to the influence of cell interactions on motion characteristics.Consequently, our study illuminates both the influence of intercellular interactions on motion patterns at different stages and the quantitative relationship between cellular responses to interactions and their current states.
In the following sections, we introduce the experimental process and results in Section 2, where the mean square displacement based on collision time is plotted,and the changes in diffusion coefficient and persistent time with respect to time and spatial distance are presented.In Section 3, we discuss the impact of cell–cell interactions by examining the relationship between cell velocity and the rate of change in persistence time.In Section 4, we introduce cAMP and caffeine to alter the strength of Dicty cell interactions,and demonstrate the comparison of motion characteristics during cell collision processes in the presence and absence of drugs.Finally,Section 5 provides a summary of the entire paper.
2.Experimental results
The approaches for cell preparation and data observation align closely with the methodologies depicted in Ref.[18].
The wide type kA3 Dicty cells underwent a period of starvation for two hours at a temperature of 5◦C,after which they were placed upon a surface of agar devoid of nutrients.The cell density was set at 30 cells/mm2,and the temperature was maintained consistently throughout the observation.Observations of cell trajectories were persistently carried out using a microscope and recorded employing a digital camera(Canon EOS 100D, 5184×3456; Olympus CX23, 4X; time interval∆t=20 s).The trajectories derived from this process are illustrated in Fig.1.
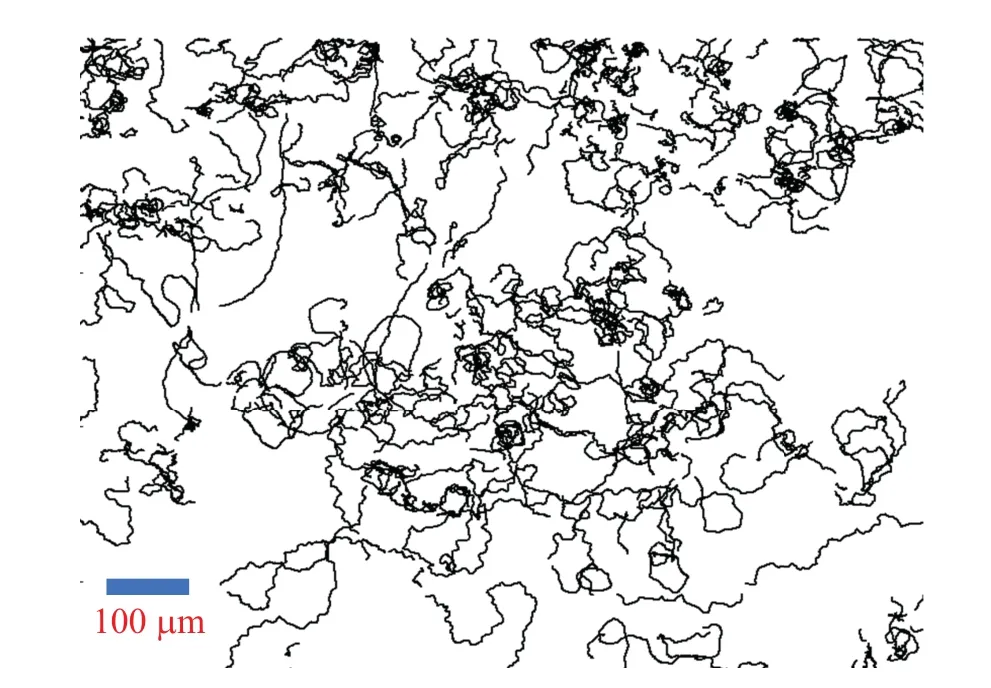
Fig.1.Cell trajectory diagram.
The cells generally displayed unrestrained motion.However, when any two cells drew near one another, a collision ensued, resulting in overlap and subsequent separation, with the cells moving in unison.It was observed that cell behavior during these collisions was markedly different from their usual unfettered movement.In an attempt to analyze the characteristics of cell motion during collisions, the mean square displacement (MSD) of cell walking trajectories was studied across varying time segments, prior to the collisions as displayed in Fig.2(a).Upon visual assessment,a noticeable pattern emerged, revealing a slowing down of diffusion in cell movement as the timing of the collision grew nearer.In each time segment,we detected cases where cells were close but did not continue to collide,instead drifting away from each other.The average distances between cell pairsxduring various time segmentstwere calculated and plotted in the bottom-right inset of Fig.2(b).
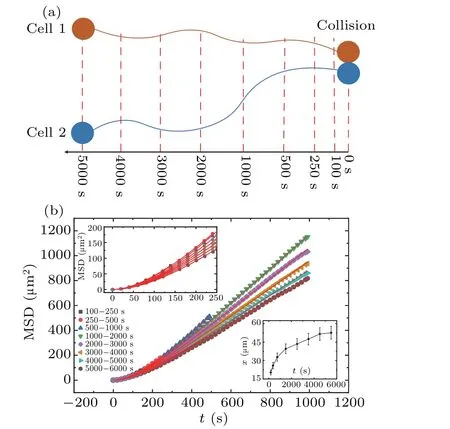
Fig.2.(a) Segmentation method of cell trajectories before collision.(b) MSD of cells across different time periods.The curves (and symbols in the legend) from top to bottom correspond to the time periods indicated by the symbols in the figure.The legend of the figure provides the time periods of 100–250 s, 250–500 s, 500–1000 s, 1000–2000 s,2000–3000 s,3000—4000 s,4000–5000 s,5000–6000 s.The bottomright inset depicts the changing trend of the average distance between cell pairs x with time segments t.
Figure 2(b)illustrates a systematic variation in the MSD curves, although they all maintain a consistent pattern.The MSD curve of 100–250 s depicts the statistical data to be between 5e5 and 4e4.For the MSD curve of 5000–6000 s, the statistical range resides between 9e5 and 5e3.Moreover, the statistical domain of all other curves lies between the ranges established in the aforementioned examples.It is inferred from the figure that as the time to collision escalates,the cells’diffusion rate correspondingly accelerates.This proposed conclusion, however, starkly contradicts the impression formulated through direct visual observation.
The curves in Fig.2(b) were fit to the following MSD formula in the classical Ornstein–Uhlenbeck(OU)process of random walk:
Here,rdenotes the displacement,Trepresents the time lapse of cell movement,Dstands for the diffusion coefficient, andτrepresents the persistent time.Dandτare independent parameters that characterize cell random motion.The value ofDdescribes the area in which the cell diffuses per unit time,whileτrepresents the characteristic time for the cell trajectory to change direction, indicating the time the cell taking to forget its initial direction.Dandτserve as features to describe the fundamental characteristics of random motion, representing spatial and temporal scales,respectively.We obtained the values ofDandτfrom each MSD curve through the MSD formula(Eq.(1)).Prior research has discussed differences between cell motion MSD and Eq.(1).[19,20]However, our experiments demonstrate a pretty good match between them in our system.Therefore, we consider the obtainedDandτas reliable representations of the behavioral characteristics of cell random motion.
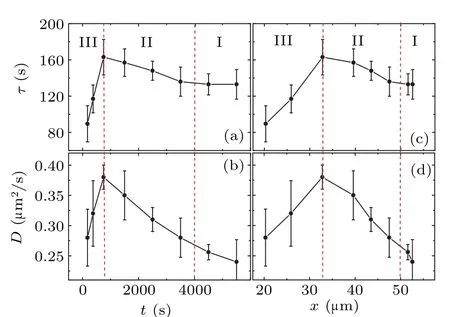
Fig.3.(a)The relationship between τ and the time to collision t.(b)The relationship between D and the time to collision t.(c)The relationship between τ and the distance between cell pairs x.(d) The relationship between D and the distance between cell pairs x.The values of D and τ are obtained by fitting curves in Fig.2(b)using Eq.(1).The values of t are the midpoint of each time interval.
Figure 3 shows the reliance ofDandτon the time to collisiontand the average distance between cell pairsx.As depicted in the figure, bothτandDof the cells exhibit nonmonotonic changes during the collision process.Notably,τandDreach their respective peaks within the span of 500–1000 s.Close to the point of collision, both the diffusion coefficientDandτexhibit a steep decline.This significant reduction inτimplies that cellular direction adjustment occurs more frequently just before collision.This finding contradicts our initial presumptions, as one would intuitively predict that cells approaching collision would directly gravitate towards each other due to interactions between them.In contradiction,Fig.3 demonstrates that the collision process is more complex,comprising three discernible stages.(I)During the time period prior to collision(4000–6000 s),the value of persistent timeτremains essentially constant.This can be interpreted as a situation where the cells are walking independently, unaffected by other cells.(II)As the time to collision approaches(750–4000 s),the value ofτgradually increases,suggesting that the cells exhibit a tendency towards ballistic motion.We interpret this behavior as the cell beginning to interact with the neighboring target cell and gradually moving closer to it.Based on the experimental data, we observe that the cell movements’mutual influence initiates approximately an hour ahead of the two-cell collision.This trend of enhanced direct motion persists until the 500–1000 s duration before the collision,where it reaches a peak.(III)As the time to cell collision(0–750 s),τexhibits a rapid decrease.This finding suggests that cellular trajectories exhibit increasingly complex patterns between collisions, inferring a spiral motion rather than linear.This behavior is also mirrored in the diffusion coefficientD.Figure 3(b) illustrates thatDgradually increases as the collision time approaches,peaking in the time range of 500–1000 s,and subsequently decreases rapidly as the collision becomes imminent.Similarly,the spacing region can also be divided into three segments, as shown in Figs.3(c) and 3(d).We observe the maximumτand D values occurring at an average cell spacing of 33µm,approximately 1.5 cell diameters.The value ofτstabilizes at approximately 2.5–3 cell diameters(∼50µm).
3.Data analysis and discussion
In order to gain further insight into the behavior of cells during the collision process,we computed the mean velocities at different time periods.By evaluating the cell displacement∆tover a small time interval ∆t,we determined the average instantaneous velocity of the cell usingv=〈∆r/∆r〉.In this case,we set ∆t=20 s.The symbol〈〉denotes the averaging of the instantaneous velocity at each time periodt.Consequently,we generated a plot depicting the relationship between the average velocityvand the time to collisiont.Figure 4(a) shows that the average instantaneous velocityvconsistently increases as the collision time approaches.This is different from the diffusion coefficientDand the persistent timeτ.This observation suggests that the movement speed of the cell progressively increases as it gets closer to a collision.Based on thex(t)curve in the inset of Fig.2(b),we can also redraw the trend of velocityvwith the change in the distance between cell pairsx, as shown in Fig.4(b).It can be seen that as cells approach each other,the velocityvincreases monotonically.
According to the OU process theory,the velocity of a random particle’s movement can be described by
By extracting the values ofDandτfrom Fig.3,we can obtain the velocityvfthrough Eq.(2),as shown by dark dots in Fig.4.Figure 4 reveals that the two curves are roughly parallel,withvfbeing greater thanv.Beyond the time range oft>1000 s,the value ofvfis approximately 1.1 timesv.This difference arises becausevis determined usingv=〈∆r/∆t〉,whilevf,calculated by Eq.(2),represents dr/dt.In the random walk theory,for any finite ∆t,there will always be dr/dt=k·(∆r/∆t)withk>1.The value ofkincreases with ∆tand is inversely related to the characteristic valueτof the random walk.Theoretically, asτapproaches infinity,kapproaches 1.It can be observed that within the time periodt<1000 s,vfincreases more rapidly,and its slope surpasses that of thevcurve,aligning with the significant decrease inτpresented in Fig.3(a).
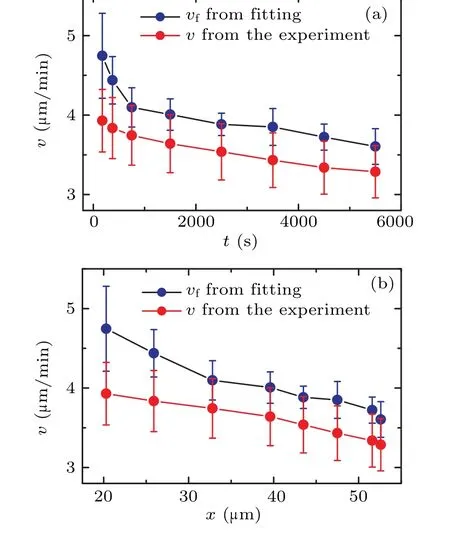
Fig.4.(a)The correlation between average velocity v of cells and the time to collision t.(b)The correlation between average velocity v of cells and the distance between cell pairs x.The below red diamond curve with dots illustrates the experimental measurements derived from v=〈∆r/∆t〉.The upper dark dot curve represents the results obtained by Eq.(2).
From examining Figs.3(a) and 4(a), it becomes evident that when two cells are in close proximity to collide, both of the frequencies of changes in the motion direction and the motion speed of cell increase.Because the rate of changeτis more pronounced compared to the rate of change of cell speed,the diffusion constantDactually diminishes,making it appear slower to the naked eye,despite the instantaneous speed of the cell increasing.The most significant alteration during the collision process is the change inτ, as illustrated in Fig.3.τundergoes an approximate change by a factor of 1, whileDchanges by approximately 35%.This observation highlights that the primary effect of cell–cell interaction is to diminish the sense of direction in directed movement.
The non-monotonic nature of the persistent timeτsuggests that the influence of cell–cell interactions is intricate.It is reasonable to assume that as cells approach each other, the states of the cells also change time to collision(If not,on the contrary,it will be strange).Figure 3(a)indicates that the extent of cell influence is linked to the time to collision.We hypothesize that this may be due to the impact of cell–cell interactions and the current state of the cells themselves.
Given that the persistent timeτ, which serves as the basis for the motion pattern,fluctuates over time under cell–cell interactions, we can utilize the rate of change of persistent time (∆τ/∆t) to measure the impact of cell–cell interactions on cells.Simultaneously, we utilize the current cell velocityvto describe the cell’s own state.Drawing on Fig.3(a)and the curve presented in Fig.4(a), we establish a correlation between ∆τ/∆tandvusing the timetas a connection,as depicted in Fig.5.
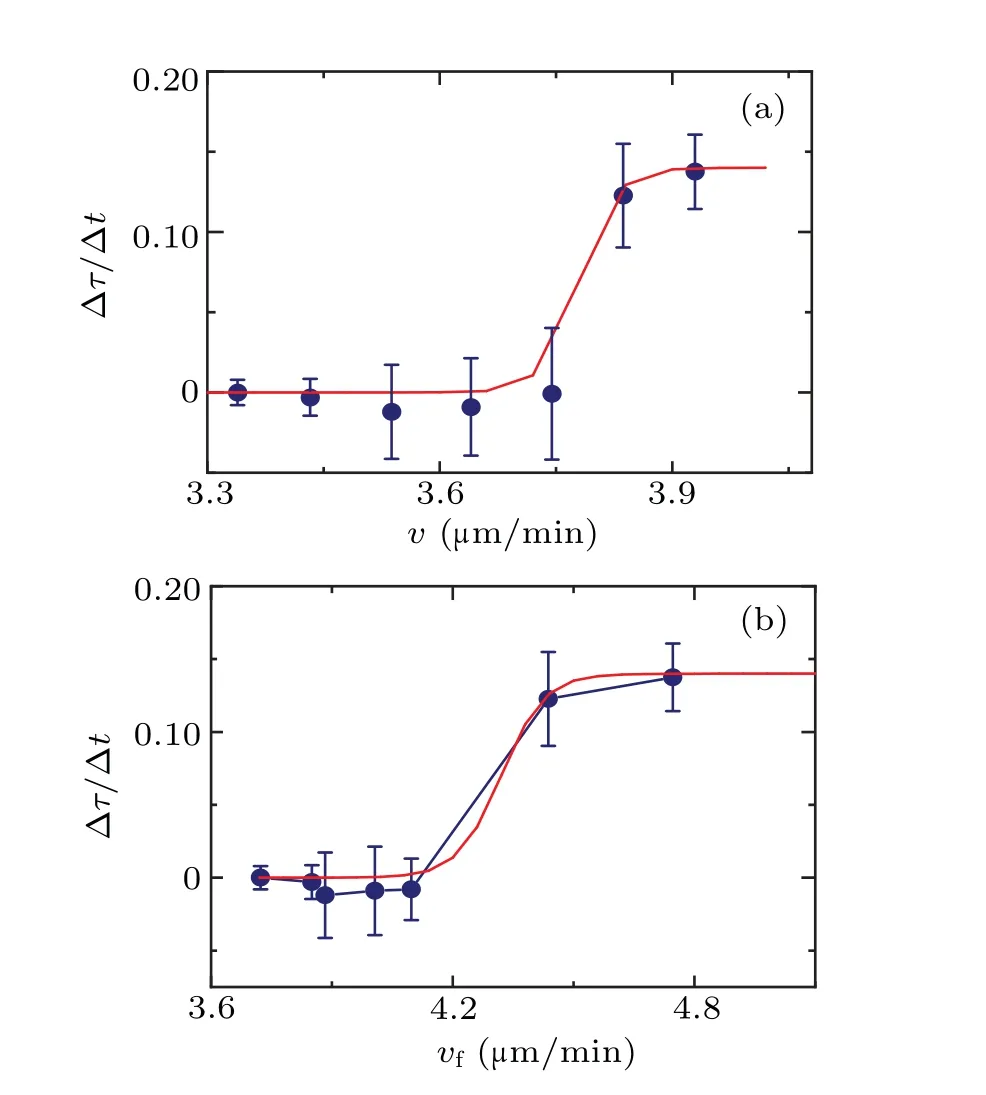
Fig.5.(a)The dependence of the rate of change of the persistent time ∆τ/∆t on velocity v.(b) The dependence of the rate of change of persistent time∆τ/∆t on velocity vf.The solid line is the fitting curve using Eq.(3).
Figure 5 illustrates the impact of cell–cell interactions on cells at varying speeds.At low speeds, during cellular normal independent walking, the impact is relatively minimal.However, there is a non-linear growth in this impact, becoming more noticeable around a certain velocityv ∼4.2µm/min(correspond to the 500–1000 s period).This suggests that cell–cell interactions rapidly increase their impact in this specific state and then tend to reach a saturation point.This behavior resembles that of the sigmoid function model commonly used in stimulus-response models.[21,22]
To further analyze this phenomenon, we employed the following sigmoid function to fit data points in Fig.5:
The fitting curve demonstrates that cells exhibit a specific sensitive range in response to external stimuli.Outside of this range, changes in stimuli tend to have a flattened impact on the cell behavior.In Fig.5, thex-axis represents the cell velocityvas an indicator of the cell’s current state, while they-axis ∆τ/∆trepresents the impact of cell–cell interactions on the cell.The observed trend of cell velocity (v) with ∆τ/∆taligns with the sigmoid model.
In fact, limited by the constraints of data space and time precision, the data presented in Fig.5 is insufficient to fully demonstrate the saturation of cell–cell interactions at higher speeds.However,it does show a clear deceleration in the rate of increase.This case brings to mind the renowned Weber–Fechner law in psychology and psychophysics,which characterizes the correlation between a system’s response to external stimuli and the intensity of those stimuli, such as sensitivity to sound.[23]Nevertheless,in Fig.5,thex-axis represents cell velocity, which represents the cell’s current state rather than the stimuli it receives.In this regard,Fig.5 appears to indicate the relationship between the cell’s response to the external environment and its current state, following the similar form to the Weber–Fechner law.This interpretation also holds true for the response characteristics of living organisms.
Based on the findings presented in Fig.5,it is posited that as cells approach one another,their mutual influence gradually accumulates.Initially, this influence may accumulate slowly within the cells, which might correspond to variations in the concentrations of specific chemical molecules.However,this influence has not yet fully manifested its effects on the observed motion patterns of the cells.Experimental results indicate that after a certain time period (between 500–1000 s),when the influence surpasses a specific threshold value, the motion pattern of the cell displays a notable response to the interaction between cells.Specifically,the velocity of the cell increases within a defined range (approximately 4.2 µm/min based on the experimental results), both the diffusion coefficientDand the characteristic timeτundergo significant nonmonotonic changes.
4.Comparison with the results under 10 nm cAMP and 10 nm caffeine
It is widely understood that Dicty cells interact by secreting cAMP and detecting the gradient of cAMP concentration to navigate their migration,and cAMP receptors on the surface of Dicty cells can be inhibited by caffeine.[11,24]To investigate the influence of cell–cell interactions on collision processes,we manipulated the strength of these interactions in our experiment.To alter the strength of cell–cell interactions, two methods were employed:1)the addition of 10 nM cAMP(Aladdin) to the agar gel to increase the basal cAMP concentration and reduce the concentration gradient in space, thereby weakening cell–cell interactions;2)the addition of 10 nM caffeine (Aladdin) to the agar gel to directly deactivate cAMP receptors,diminishing the cells’capacity to detect cAMP.The MSD curves of cells were measured under both conditions.Subsequently, we plotted the diffusion coefficientD, persistence timeτ,and velocityvwith respect to collision timetas above.The results from comparing the drug-added and drugfree conditions are presented in Fig.6.
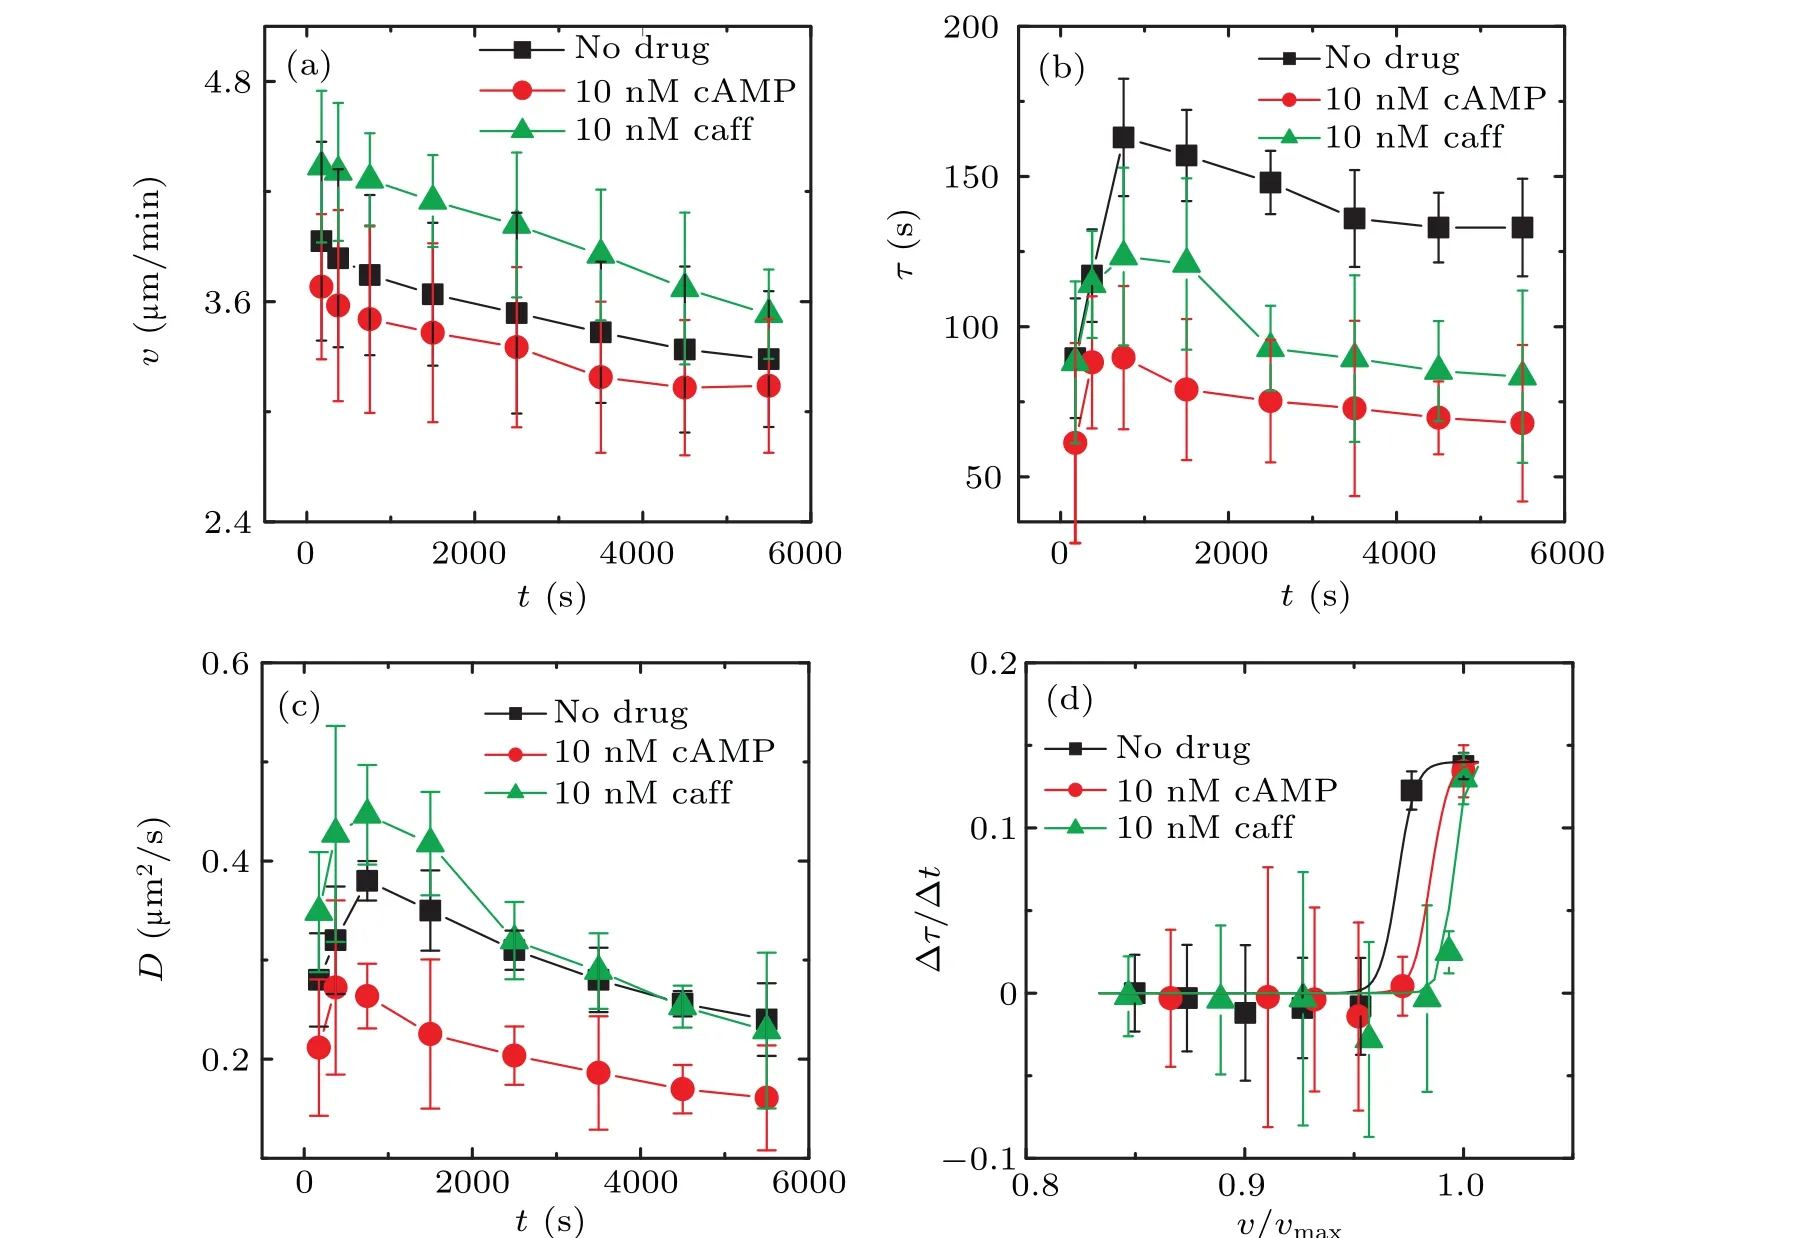
Fig.6.Comparisons of the results between the addition of the drugs(10 nM caffeine or 10 nM cAMP)and the absence of any drug.The black squares represent the drug-free condition, the red dots represent the addition of 10 nM cAMP to agar, and the green triangles represent the addition of 10 nM caffeine to agar.(a)The comparison of average instantaneous velocity v(t)curves.(b)The comparison of persistence time τ(t)curves.(c)The comparison of diffusion coefficient D(t)curve.(d)The comparison curve of ∆τ/∆t vs. v/vmax,here vmax is the max value of velocities in(a)for each condition.The three solid lines in(d)represent the fitted curves of Eq.(3).
Figure 6 reveals that the overall trends ofv(t),τ(t),D(t)and dependence of ∆τ/∆tonv/vmax(v) remain unchanged even after adding the drugs, while the specific values of each quantities have significantly changed.Moreover,there are detailed differences between the effects of caffeine and cAMP.In the presence of 10 nM cAMP,v(t),τ(t),andD(t)are noticeably lower,as shown by the red-dot plots.However,Fig.6(a)indicates that caffeine raisedv(t)curve,while cAMP lowered it.This suggests that cells have a slower instantaneous velocity when they can sense higher concentrations of cAMP.[11,25]Figure 6(b) demonstrates that both caffeine and cAMP have similar effects on theτ(t)curve, resulting in a significant reduction.A decrease in persistence timeτimplies that cells are more likely to change their directions during random movement, which is consistent with the fact that cell directionality is influenced by the gradient of cAMP concentration rather than the concentration itself.[11,12]In Fig.6(c),we observe the highest diffusion coefficient curveD(t)under the caffeine condition.This is also consistent with the highest instantaneous velocityv(t)of cells under caffeine condition in Fig.6(a).Figure 6(b) shows that the curves for drug-added conditions are shifted to the right compared to the drug-free condition.This suggests that in the presence of the drugs, cells need to be closer to each other to achieve the same level of cell–cell interaction as in the drug-free condition.In other words,cells need to be in closer proximity to sense each other’s influence.This indicates that the cell–cell interaction is substantially weakened during the collision process due to the diminished interaction after adding the drugs.This is consistent with our expectations.From Fig.6,we can infer that the ability of caffeine to isolate interactions is higher than that of cAMP, as evidenced by the rightward shift of the caffeine curve.We speculate that the higher efficiency of caffeine may be related to the mechanism of its direct interaction with cAMP receptors on the Dicty cell surface.
5.Summary
In this study,we examined the state of cellular movement,mean squared displacement(MSD),and velocityvprior to collision under different chemical conditions.Through an analysis of the MSD curve,we identified the diffusion coefficientDand the characteristic timeτ,each corresponding to cellular motion at varying moments before the collision.Simultaneously, we computed alterations in cellular velocity, considering different times prior to a collision.Our findings suggest that, as a cell moves closer to another for a collision, it does not migrate directly towards the second cell.Instead,the motion process is multifaceted,and the interaction between cells doesn’t involve a direct collision, but convoluted motion trajectories.An evaluation of the rate of change ofτand cell velocityvhas led us to infer that a sigmoid function can serve as an approximate model for cell–cell interaction responses.This function is prevalently used in biological systems to represent the correlation between external stimuli and the system’s responses.Lastly, we modified the interaction strength among various cells by incorporating cAMP and caffeine into agar gel.Results revealed no significant alterations in the overall motion trend.However, in drug-induced conditions, cells needed to be in closer proximity for perception of mutual influence compared to conditions without drugs.
Acknowledgement
Project supported by the National Natural Science Foundation of China(Grant No.31971183).
猜你喜欢
大众文艺(2022年22期)2022-12-01
Plasma Science and Technology(2022年11期)2022-11-17
共产党员·下(2022年4期)2022-05-17
Chinese Physics B(2021年4期)2021-05-06
课程教育研究(2021年24期)2021-04-14
科学导报·学术(2020年86期)2020-11-04
Chinese Physics B(2019年6期)2019-06-18
校园英语·中旬(2017年13期)2017-12-19
艺术家(2017年2期)2017-11-26
- Chinese Physics B的其它文章
- Unconventional photon blockade in the two-photon Jaynes–Cummings model with two-frequency cavity drivings and atom driving
- Effective dynamics for a spin-1/2 particle constrained to a curved layer with inhomogeneous thickness
- Genuine entanglement under squeezed generalized amplitude damping channels with memory
- Quantum algorithm for minimum dominating set problem with circuit design
- Protected simultaneous quantum remote state preparation scheme by weak and reversal measurements in noisy environments
- Gray code based gradient-free optimization algorithm for parameterized quantum circuit