
Origin of tradeoff between movement velocity and attachment duration of kinesin motor on a microtubule
2024-02-29 09:17YuyingLiu刘玉颖andZhiqiangZhang张志强
Chinese Physics B 2024年2期
关键词:张志强
Yuying Liu(刘玉颖) and Zhiqiang Zhang(张志强)
1Department of Physics,College of Science,China Agricultural University,Beijing 100083,China
2Basic Ministry,Space Engineering University,Beijing 101416,China
Keywords: motor protein,velocity,detachment time,processivity
1.Introduction
Kinesin-1 motor proteins were first discovered as members of the kinesin superfamily.[1,2]Since the discovery of kinesin-1 proteins, their structures and dynamics have been thoroughly studied.[3–11]The kinesin-1 motor is a homodimer containing two identical motor domains(or heads)connected by a common long coiled-coil stalk via two flexible neck linkers (NLs).[3,12]The dimeric motor can walk hand-over-hand on a microtubule (MT) filament towards the plus end with a velocity of about 1µm·s-1and a run length of about 1µm before detachment under physiological conditions, performing the function of intracellular transport.[13–15]The directional motion of the motor is powered by the hydrolysis of ATP molecules, with about one ATP molecule consumed per mechanical step of about 8.2 nm under the unloaded case.[14–18]Since in this work we focus only on the kinesin-1 motor, for convenience it is simply called the kinesin motor.
Apart from wild-type (WT) kinesin motors under physiological conditions, the dynamics of WT kinesin motors under non-physiological conditions and mutant or engineered kinesin motors under physiological conditions have also been studied experimentally in detail.[19–25]For example,Nara and Ishiwata[25]studied the dynamics of the bovine brain kinesin motor in the solution temperature range 20◦C–40◦C.Interestingly, they found that both the velocity and run length of the motor increased with increase in temperature, while the duration of the motor attaching to an MT decreased with increase in temperature.Yildizet al.[21]studied the dynamics of engineered human kinesin motors with different numbers of residues inserted between the NLs and the coiled-coil stalk.Puzzlingly,they found that with an increase in the number of inserted residues, implying a decrease in the strain between the two heads in the two-head bound state, the velocity and chemomechanical coupling ratio (defined as the number of mechanical steps per ATP molecule consumed) of the motor decreased.By contrast, insertion had nearly no effect on the ATPase rate, and with an increase in the number of inserted residues the run length decreased only slightly.Both the experimental data of Nara and Ishiwata[25]and those of Yildizet al.[21]indicated that the attachment duration(Ta)of the motor on a MT decreases with increase in the velocity (v), implying a tradeoff between the two factors.As noted recently by Rizvi,[26]the experimental data on the relationship between the two factors can be approximately fitted by a power-law relation,Ta∝v-α, with its exponentα>0 under the variation of temperature being smaller than that under the variation of intramolecular strain.
However, the underlying mechanism of these features in the relationship between velocity and attachment duration is unclear.In this work, we address this issue.For this purpose,we study theoretically the dynamics of the motor under variation of intramolecular strain, solution temperature, ATP concentration and rate of ATP transition to ADP that can be realized by mutating the residues near the nucleotide-binding pocket, reproducing quantitatively the available experimental data and providing predicted results.
2.General equations for the dynamics of the kinesin motor
To study the tradeoff between velocity and attachment duration of the kinesin motor, we use the model for chemomechanical coupling of the kinesin motor proposed by Xie,[27]which gives a good explanation of diverse experimental data on the dynamics of the motor.[9–11,27–30]The pathway of the chemomechanical coupling at saturating ATP concentrations is schematically shown in Fig.1,and has been described in detail before[27](see also supplementary information).Throughout we focus on the case of no load on the motor.Before NL docking, the NL of the MT-bound head is not in the forward orientation under no load on the coiled-coil stalk (Fig.1(b)),so the rate of ATP transition to ADP is much smaller than the NL-docking rate;thus,for simplicity,the transition of ATP to ADP in the MT-bound head before NL docking in Fig.1(b)is not considered here.

Fig.1.Model of kinesin dimer stepping on and detachment from MT.Panels (a)–(o) illustrate the chemomechanical coupling pathway at saturating ATP concentrations(see supplementary information for a detailed description).The figure is modified from that in Refs.[27,28].
Based on Fig.1, the equations for the dynamics of the motor at saturating ATP concentrations are briefly presented in the following.
In the intermediate(INT)state,after the reduction of the binding energy between the two heads (Fig.1(c)), the probabilityPEfor the detached head to diffuse forward and to bind to the front tubulin can be written as[27]
whereE0is the total free energy change associated with the large conformational change of the head in the ATP state and the NL docking,kBis the Boltzmann constant andTis the absolute temperature.In this work, we focus only on the case of no load on the motor.Under a load,PEis a function of the load.[27]
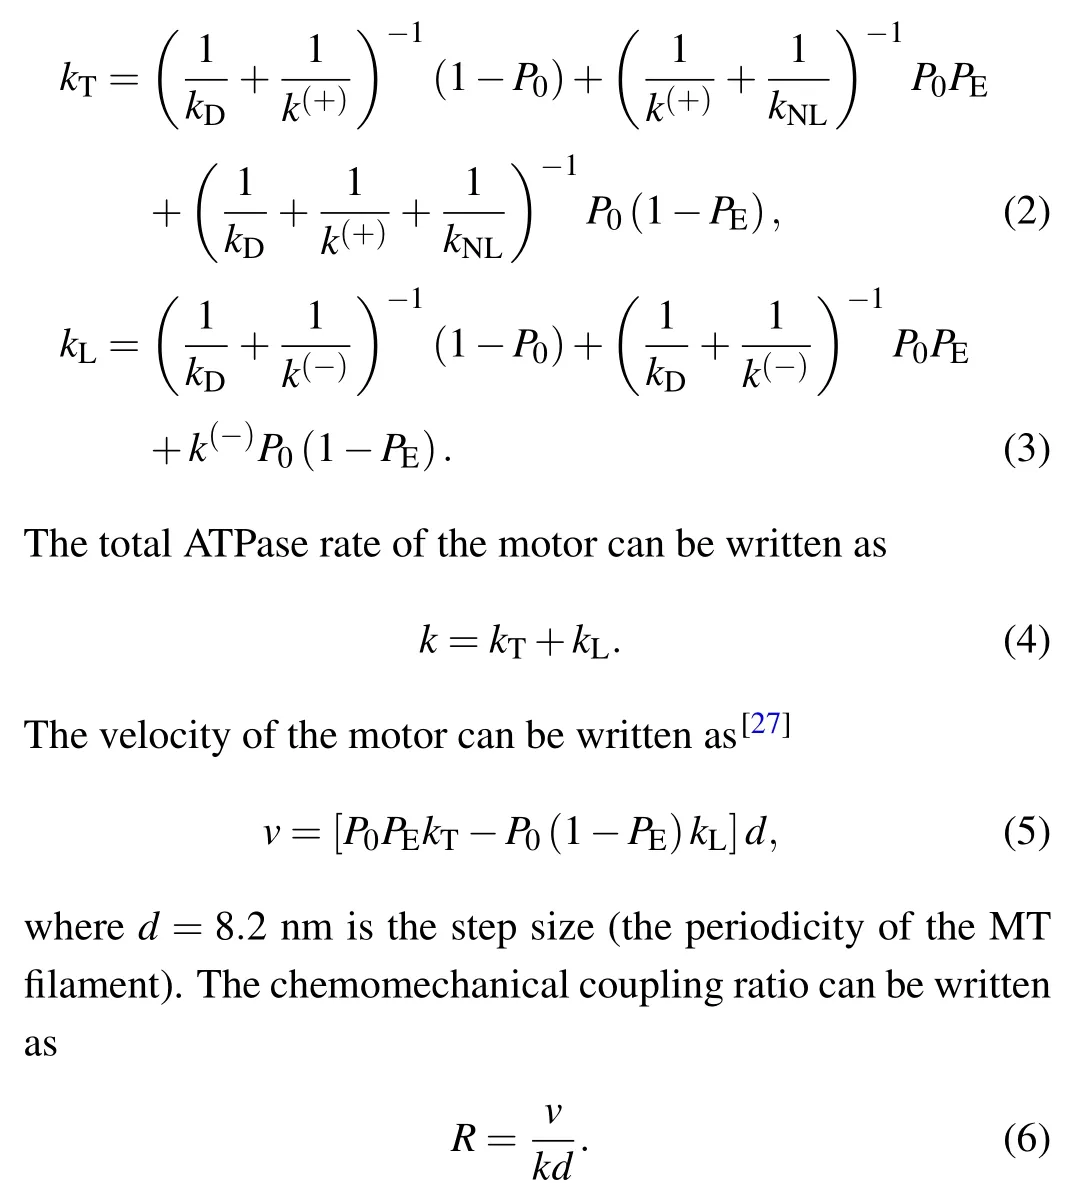
In the two-head bound state (Fig.1(a)), after ATP transition to ADP in one head, by overcoming the weak affinityEw1of the head for localαβ-tubulin within a short timetr(of the order of 10 µs), the probability for the ADP head to detach from the local tubulin and then diffuse to the INT position is denoted byP0.The rates of transition of ATP to ADP in the head with the forward NL orientation and that without the forward NL orientation are denoted byk(+)andk(-), respectively.The rate of ADP release from the head bound to MT is denoted bykD,which is considered here to be independent of NL orientation.In the INT state (Fig.1(b)), the rate of the large conformational change of the ATP head,which is associated with NL docking and great reduction in the binding energy between the two heads,is denoted bykNL.During the stepping process,the average ATPase rates of the trailing and leading heads, which are denoted bykTandkL, respectively,can be approximately written as[27]
In the weak MT-binding period (Figs.1(g), 1(i), and 1(o)),both heads are in the ADP state, with one head bound to MT with affinityEw2(>Ew1) and the other detached from MT having a high binding energy to the MT-bound head.The occurrence probability of the weak MT-binding period in one ATPase cycle can be written as[27]
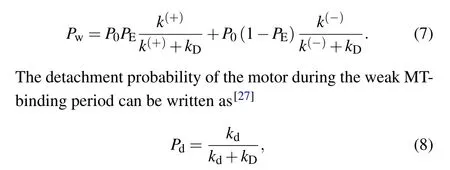
wherekdis the detachment rate during the weak MT-binding period.The detachment rate of the motor during processive motion, which arises from detachment occurring in the weak MT-binding period,can be written as[27]
During processive motion of the motor,the weak MT-binding period can only occur occasionally in one chemomechanical coupling cycle,and if it occurs it constitutes only a small fraction of the whole period of the chemomechanical coupling cycle because ADP release is a non-limiting step of ATPase activity.This implies that in one chemomechanical coupling cycle the motor is almost always in the strong MT-binding period.Denoting the detachment rate of the motor during the strong MT-binding period byεs, the total detachment rate of the motor can then be approximately written as[29]
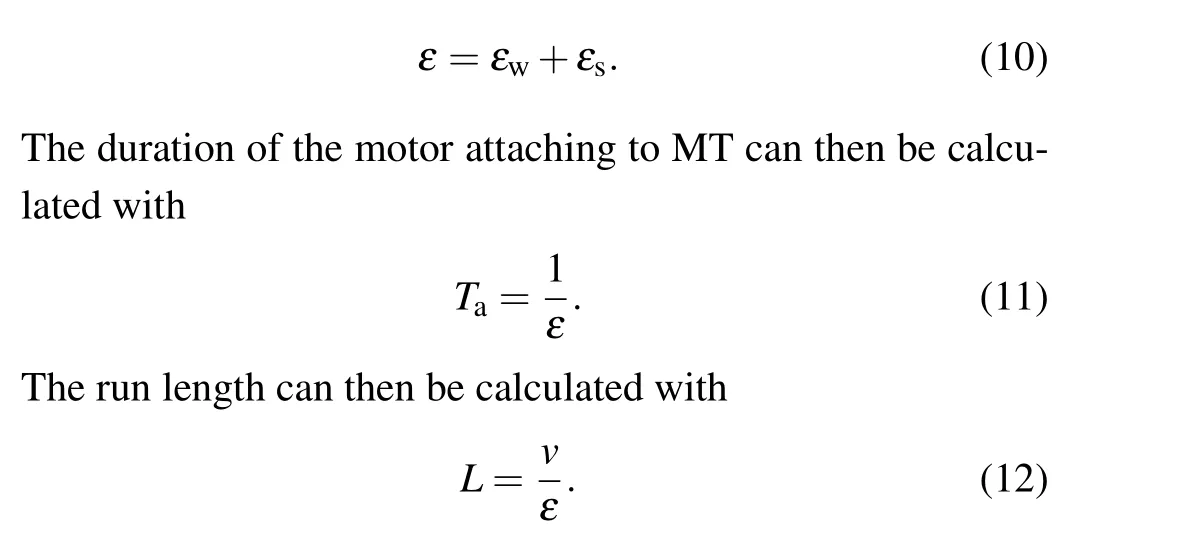
3.Results and discussion
In a previous work,[27]the load dependences of the velocity,run length and dissociation rate of WT kinesin motors were studied.In this work,in order to explore the physical origin of the tradeoff between the velocity and total attachment duration of the kinesin motor on MT we study the effects of varying intramolecular strain, solution temperature, ATP concentration and the rate of ATP transition to ADP on the velocity and attachment duration.
3.1.Effect of varying intramolecular strain
In this section,we study the effect of varying intramolecular strain on the dynamics of a human kinesin motor at saturating ATP concentrations.As in the experiments of Yildizet al.,[21]variation of intramolecular strain can be realized by inserting additional residues with various lengths of polyproline and glycine–serine repeats, preceded by two lysines and followed by a single glycine residue,between the NL and the coiled-coil stalk.As in Ref.[21], the engineered dimer with the insertion ofnprolines is callednP, wherenis an integer,and the engineered dimer with the insertion of seven repeats of glycine–serine residues is called 14GS.The engineered NL of 14GS is more flexible than that of 26P.[21]As previous allatom molecular dynamics simulations showed,[30]for the WT dimer with each NL having 14 residues a large intramolecular strain of about 28 pN can be induced when the two heads are bound to two successive tubulins on an MT filament, which are 8.2 nm apart.As noted in Ref.[21], the engineerednP dimer has a smaller intramolecular strain than the WT dimer;with increase innthe intramolecular strain becomes smaller,and the engineered 14GS dimer has a smaller intramolecular strain than the 26P dimer.As shown by previous Brownian dynamics simulations,[30]for the WT dimer after ATP transition to ADP in one head the large intramolecular strain can easily drive the ADP head to detach from the local tubulin and diffuse to the INT position with probabilityP0≈1, whereas for the engineered dimer with the insertion of six residues in the NL, due to the smaller intramolecular strainP0becomes evidently smaller than 1.Moreover, it is expected thatP0decreases with increase innfor thenP dimers, and the 14GS dimer has a smallerP0than the 26P dimer.
As seen from Eqs.(1)–(12),to study theoretically the dynamics of the WT and engineered motors, values for the parametersk(+),k(-),kD,kNL,E0,kd,εsandP0are required.Here,for human kinesin under the experimental conditions of Yildizet al.[21]we takek(-)=3.6 s-1,kD=300 s-1,kNL=1500 s-1andE0= 3.6kBT(Table 1), which are the same as those determined previously that quantitatively explain the available experimental data for Drosophila kinesin.[27]In addition,we takeεsto be very small,for exampleεs=0.01 s-1(Table 1),which quantitatively explains the available experimental data.[9]The other three parametersk(+),kdandP0are adjustable here to make the theoretical results consistent with the experimental data of Yildizet al.[21]By takingk(+)=62 s-1(Table 1), the theoretical results for velocity versusP0are shown in Fig.2(a), where it is seen that whenP0= 0.884,0.623,0.468,0.342,0.260,0.175,0.158,0.141 and 0.088,the theoretical velocities are in quantitative agreement with the experimental ones for the WT,0P,2P,4P,6P,13P,19P,26P and 14GS motors, respectively.Then, with the above parameter values the theoretical results for the ATPase rate and chemomechanical coupling ratio for the WT and engineered motors are also consistent with the experimental data[21](Figs.2(b)and 2(c)).With the above parameter values, and by additionally takingkd=6.3 s-1(Table 1), the theoretical results for the run length for the WT and engineered motors are also consistent with the experimental data[21](Fig.2(d)).Furthermore, with the results for the velocity (Fig.2(a)) and those for the attachment duration (Fig.2(e)), the obtained relationship between velocity and attachment duration is also in good agreement with that obtained from the experimental data[21](Fig.2(f)).In a word, with only three adjustable parameters,k(+),kdandP0,all the theoretical results for the WT and engineered motors are in quantitative agreement with the available experimental data[21](Figs.2(a)–2(d)and 2(f)).
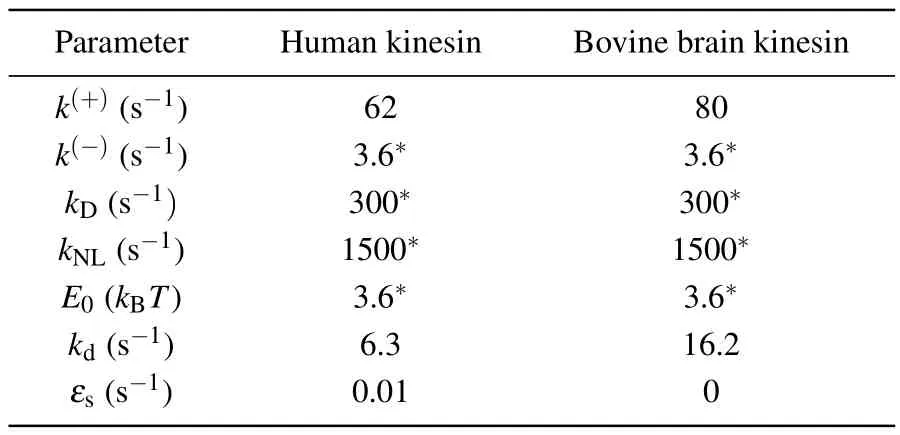
Table 1.Parameter values for human kinesin-1 under the experimental conditions of Yildiz et al.[21] and for bovine brain kinesin-1 at temperature T =298 K(25 ◦C)under the experimental conditions of Nara and Ishiwata.[25] Values with an asterisk are identical to those used before.[27]

Fig.2.Effect of varying intramolecular strain on the dynamics of human kinesin-1 at saturating ATP concentrations.Lines are theoretical results,filled symbols are experimental data from Yildiz et al.[21] and open symbols are predicted data,with WT,0P,2P,4P,6P,13P,19P,26P and 14GS motors corresponding to P0=0.884,0.623,0.468,0.342,0.260,0.175,0.158,0.141 and 0.088,respectively: (a)velocity versus P0;(b)ATPase rate versus P0;(c)chemomechanical coupling ratio versus P0;(d)run length versus P0;(e)attachment duration versus P0;(f)relationship between velocity and attachment duration.
The origin of the tradeoff between velocity and attachment duration (Fig.2(f)) can be briefly explained as follows.As noted from Fig.2(b) and Fig.S1 (see supplementary information), the ATPase rate of the motor,k, the ATPase rate of the trailing head,kT, and the ATPase rate of the leading head,kL,are insensitive to the variation ofP0.SincePEis independent ofP0(see Eq.(1)),from Eq.(5)it is noted that the velocity is approximately proportional toP0.From Eqs.(7)–(9) it is noted that the detachment rate of the motor, which arises from detachment occurring in the weak MT-binding periods,εw, is also approximately proportional toP0.Since the total detachment rate of the motor,ε,is determined mainly byεwbecauseεs≪εw, the attachment duration of the motor is approximately inversely proportional toP0.Therefore, with increase inP0, the velocity decreases whereas the attachment duration increases, implying a tradeoff between velocity and attachment duration.
3.2.Effect of varying temperature
In this section,we study the effect of varying the solution temperature on the dynamics of a bovine brain kinesin motor at saturating ATP concentrations.The dependence of the rate constants of the ATPase activity on absolute temperatureTcan be calculated using the transition state theory formula[31–34]
wherek0is a universal constant that is equivalent to the rate constant with zero activation energy,E(+)ais the activation energy of ATP transition to ADP in the kinesin head with its NL in forward orientation,E(-)ais the activation energy of ATP transition to ADP in the kinesin head with its NL not in forward orientation,E(D)ais the activation energy of ADP release from the MT-bound head, andE(NL)ais the activation energy of NL docking.As determined in the literature, the universal constantk0≈6×10¹²s-1,[31–34]and thus in this work we takek0=6×10¹²s-1.
The detachment of the motor from MT during the weak MT-binding period can be considered as a Brownian particle escaping from a potential well of depthEw2.ForEw2≫kBT,the dependence of the detachment rate during the weak MTbinding period,kd,on absolute temperatureTcan be approximately written as[35]
wherekd0is the detachment rate withEw2=0 atT=298 K(25◦C).It should be mentioned that in Eq.(17), for approximation, we have not considered the variation of the solution viscosity and of affinityEw2withTin the range of 293 K(20◦C)and 313 K(40◦C)studied in this work.Under a zero energy barrier, detachment of the kinesin motor from MT is equivalent to the free diffusion of a Brownian particle with a size of about 6 nm in a solution with a reflecting boundary,with the detachment timetd0being of the order of 1µs.Thus,the detachment ratekd0=1/td0is about 106s-1.
In this section,we focus on the WT bovine brain kinesin motor.Since for the WT caseP0approaches 1, for simplicity we takeP0=1 here.Sinceεsis very small and at saturating ATP the time of a chemomechanical coupling cycle is short,for approximation we can neglect the detachment of the motor in a chemomechanical coupling cycle during the strong MT-binding period and thus takeεs=0 (Table 1) (see next section).Then,from Eqs.(1)–(12)it is seen that to study theoretically the dynamics of the WT bovine brain kinesin motor, values for the remaining parametersk(+),k(-),kD,kNL,E0andkdare required.As in the previous section, here we also takek(-)=3.6 s-1,kD=300 s-1,kNL=1500 s-1andE0=3.6kBT=14.8 pN·nm atT=298 K(25◦C)for bovine brain kinesin (Table 1).The remaining two parametersk(+)andkdare adjustable here to make the theoretical results consistent with the experimental data of Nara and Ishiwata.[25]AtT=298 K(25◦C),by takingk(+)=80 s-1andkd=16.2 s-1(Table 1)the theoretical results of the velocity,attachment duration and run length are close to the experimental data.[25]
With the above values ofk(+)=80 s-1,k(-)=3.6 s-1,kD=300 s-1andkNL=1500 s-1atT=298 K(25◦C)(Table 1),using Eqs.(13)–(16)we obtainE(+)a=102.98 pN·nm,E(-)a= 115.73 pN·nm,E(D)a= 97.54 pN·nm andE(NL)a=90.92 pN·nm.With these values ofE(+)a,E(-)a,E(D)aandE(NL)a, the dependences ofk(+),k(-),kDandkNLonTcan be calculated with Eqs.(13)–(16).The dependence ofPEonTcan be calculated with Eq.(1),whereE0=14.8 pN·nm(see above).With the above value ofkd=16.2 s-1atT=298 K(25◦C)(Table 1),using Eq.(17)the calculated results for the relationship betweenkd0andEw2are shown in Fig.3(a).Thus,for a givenkd0,which determinesEw2from Fig.3(a),the dependence ofkdonTcan be calculated with Eq.(17).As mentioned above,kd0is about 106s-1.Thus,we takekd0=106s-1here.The theoretical results for the velocity,attachment duration and run length versusTare shown in Figs.3(b)–3(d).It is interesting that without any adjustable parameters here the theoretical results are in quantitative agreement with the experimental data of Nara and Ishiwata.[25]The predicted results of the chemomechanical coupling ratio versusTare shown in Fig.3(e), with the ratio being kept nearly equal to one.Furthermore, with the results for the velocity (Fig.3(b)) and those for the attachment duration(Fig.3(c)),the obtained relationship between the velocity and attachment duration is also in good agreement with that obtained from the experimental data[25](Fig.3(f)).In a word,with only two adjustable parametersk(+)andkdto reproduce the experimental data for velocity, attachment duration and run length for one temperature,without any other adjustable parameters,all the theoretical results for other temperatures are in quantitative agreement with the available experimental data[25](Figs.3(b)–3(d)and 3(f)).
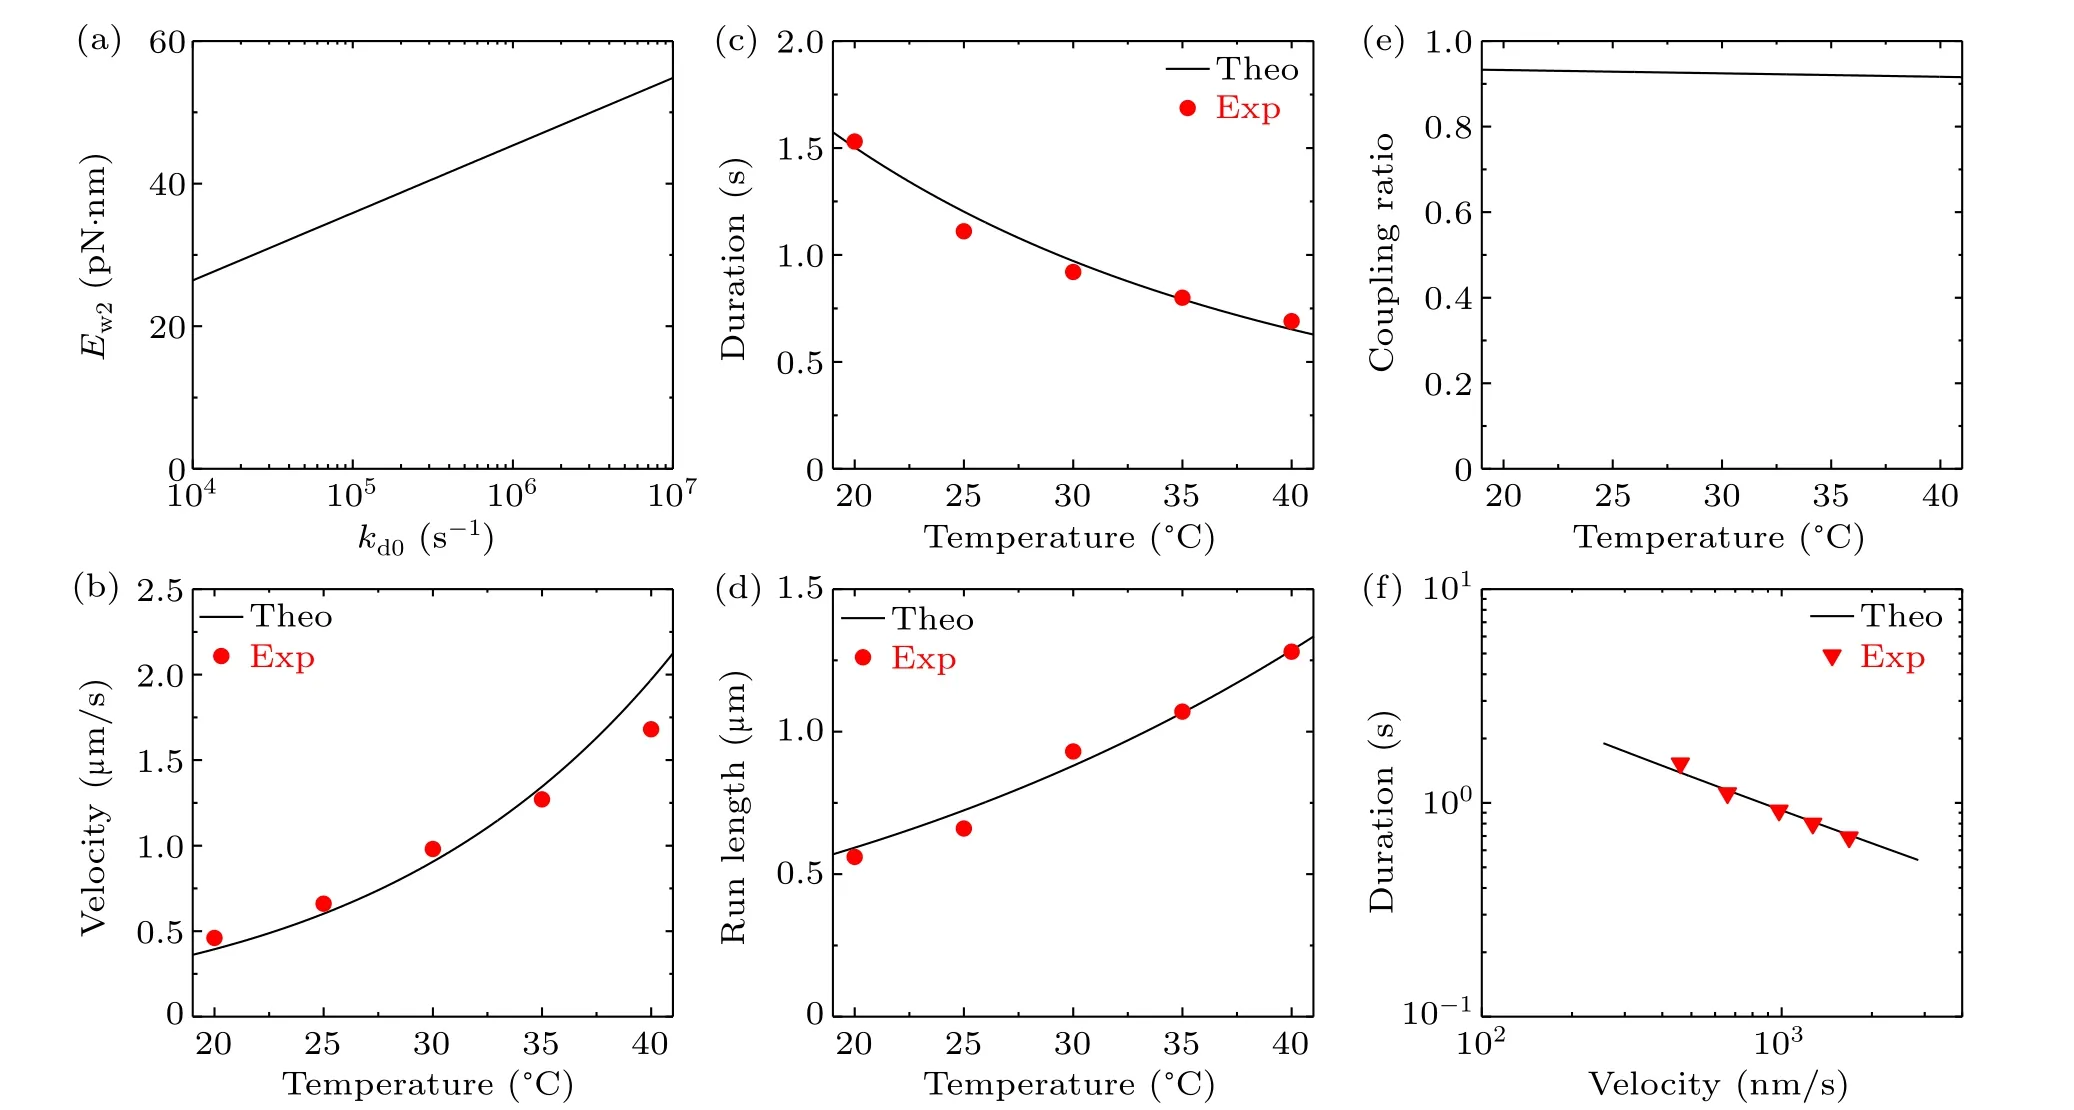
Fig.3.Effect of varying solution temperature on the dynamics of bovine brain kinesin-1 at saturating ATP concentrations.Lines are theoretical results and symbols are experimental data from Nara and Ishiwata:[25] (a)the relationship between kd0 and Ew2,which gives the detachment rate during the weak MT-binding period,kd=16.2 s-1,at temperature T =298 K(25 ◦C);(b)velocity versus temperature;(c)attachment duration versus temperature;(d)run length versus temperature;(e)chemomechanical coupling ratio versus temperature;(f)relationship between velocity and attachment duration.
The origin of the tradeoff between velocity and attachment duration (Fig.3(f)) can be briefly explained as follows.From Eq.(5) we havev=[PEkT-(1-PE)kL]dfor the WT bovine brain kinesin motor withP0=1.From Eq.(1), it is noted that due toPEapproaching 1,PEis insensitive toT(see Fig.S2(a)in the supplementary information).From Eqs.(2),(3)and(13)–(16),it is noted thatkTandkLincrease approximately exponentially withT(see Figs.S2(b)and S2(c)in the supplementary information).Thus,the velocityvincreases approximately exponentially withT(Fig.3(b)).Due tokdbeing much smaller thankDandEw2being smaller thanE(D)a,from Eqs.(7)and(8)it is noted thatPwPddecreases approximately exponentially withT(Fig.S2(d) in supplementary information).By comparing Figs.S2(b)and S2(c)with Fig.S2(d),it is seen that the magnitude of the increasing slope of log(kT+kL)versus log(T) is larger than the magnitude of the decreasing slope of log(PwPd)versus log(T).Thus,from Eq.(9)it is expected thatεwwill increase approximately exponentially withT,which leads to the attachment duration decreasing approximately exponentially withT(Fig.3(c)).Consequently, with increase inT, the velocity increases whereas the attachment duration decreases, implying a tradeoff between the two factors.
3.3.Effect of varying the ATP concentration
In this section, we study the effect of varying the ATP concentration on the dynamics of a bovine brain kinesin motor at fixed temperatureT=298 K(25◦C).As above,for the WT motor we takeP0=1.As derived before(see supplementary information in Ref.[29]),at non-saturating ATP concentrations the average ATPase rates of the trailing and leading heads can be approximately written as
wherekbis the second-order rate constant of ATP binding to the nucleotide-free head,k-1is the rate of ATP release from the head with an open nucleotide-binding pocket(i.e.,the leading head) and the rate of ATP release from the head with a closed nucleotide-binding pocket(i.e.,the trailing head)is implicitly taken to be zero.At non-saturating ATP concentrations, but with the equations forkTandkLbeing replaced by Eqs.(18) and (19), all other equations are the same as those presented in Section 2.
Here, we consider two values forεs, withεs= 0 andεs=0.01 s-1.As done before (see supplementary information in Ref.[29]),we takekb=2µM-1·s-1andk-1=80 s-1here.All other parameter values for the bovine brain kinesin motor are listed in Table 1.In Figs.4(a)–4(e), we show the theoretical results of the velocity,ATPase rate,chemomechanical coupling ratio,run length and attachment duration versus ATP concentration.Furthermore, with the results for velocity (Fig.4(a)) and those for attachment duration (Fig.4(e)),the obtained relationship between velocity and attachment duration is shown in Fig.4(f).From Fig.4(c) it is seen that with change in the ATP concentration the chemomechanical coupling ratio is kept nearly equal to 1, which is in agreement with the available experimental data.[15,16]This feature of the chemomechanical coupling ratio(Fig.4(c))is similar to that for a change of solution temperature (Fig.3(e)) but contrasts with that for a change in intramolecular strain(Fig.2(c)).Thus, for varying ATP concentration, as for varying solution temperature,the increase in velocity arises mainly from an increase in the ATPase rate.From Fig.4(e) it is seen that the attachment duration decreases with increase in the ATP concentration.The increase of velocity with increase in ATP concentration(Fig.4(a))and the decrease of attachment duration with increase in ATP concentration(Fig.4(e))result in the run length being nearly independent of ATP concentration whenεs=0 and the run length at very low ATP concentrations(e.g.,2 µM) being smaller than at saturating ATP concentrations(e.g.,2 mM)whenεs=0.01 s-1(Fig.4(d)).In addition,from Figs.4(d)and 4(e)it is seen that at saturating ATP the effect ofεson the dynamics of the motor is very small and thus can be neglected,as done above.From Fig.4(f)it is seen that a tradeoff between velocity and attachment duration is also present for varying ATP concentration.
The origin of the tradeoff (Fig.4(f)) can be briefly explained as follows.From Eq.(1) it is seen thatPEis independent of ATP concentration.Thus, fromv=[PEkT-(1-PE)kL]dfor a WT bovine brain kinesin motor withP0=1 (Eq.(5)) the velocity is proportional tokTandkL.From Eqs.(18) and (19), it is noted thatkTandkLincrease with ATP concentration.Thus, the velocity increases with ATP concentration (Fig.4(a)).From Eqs.(7)–(9), it is noted thatεwincreases linearly with increase inkT+kL.Thus,the total detachment rateε,which is determined mainly byεw,increases with ATP concentration.Therefore, with increase in the ATP concentration, the velocity increases whereas the attachment duration decreases, implying a tradeoff between velocity and attachment duration.
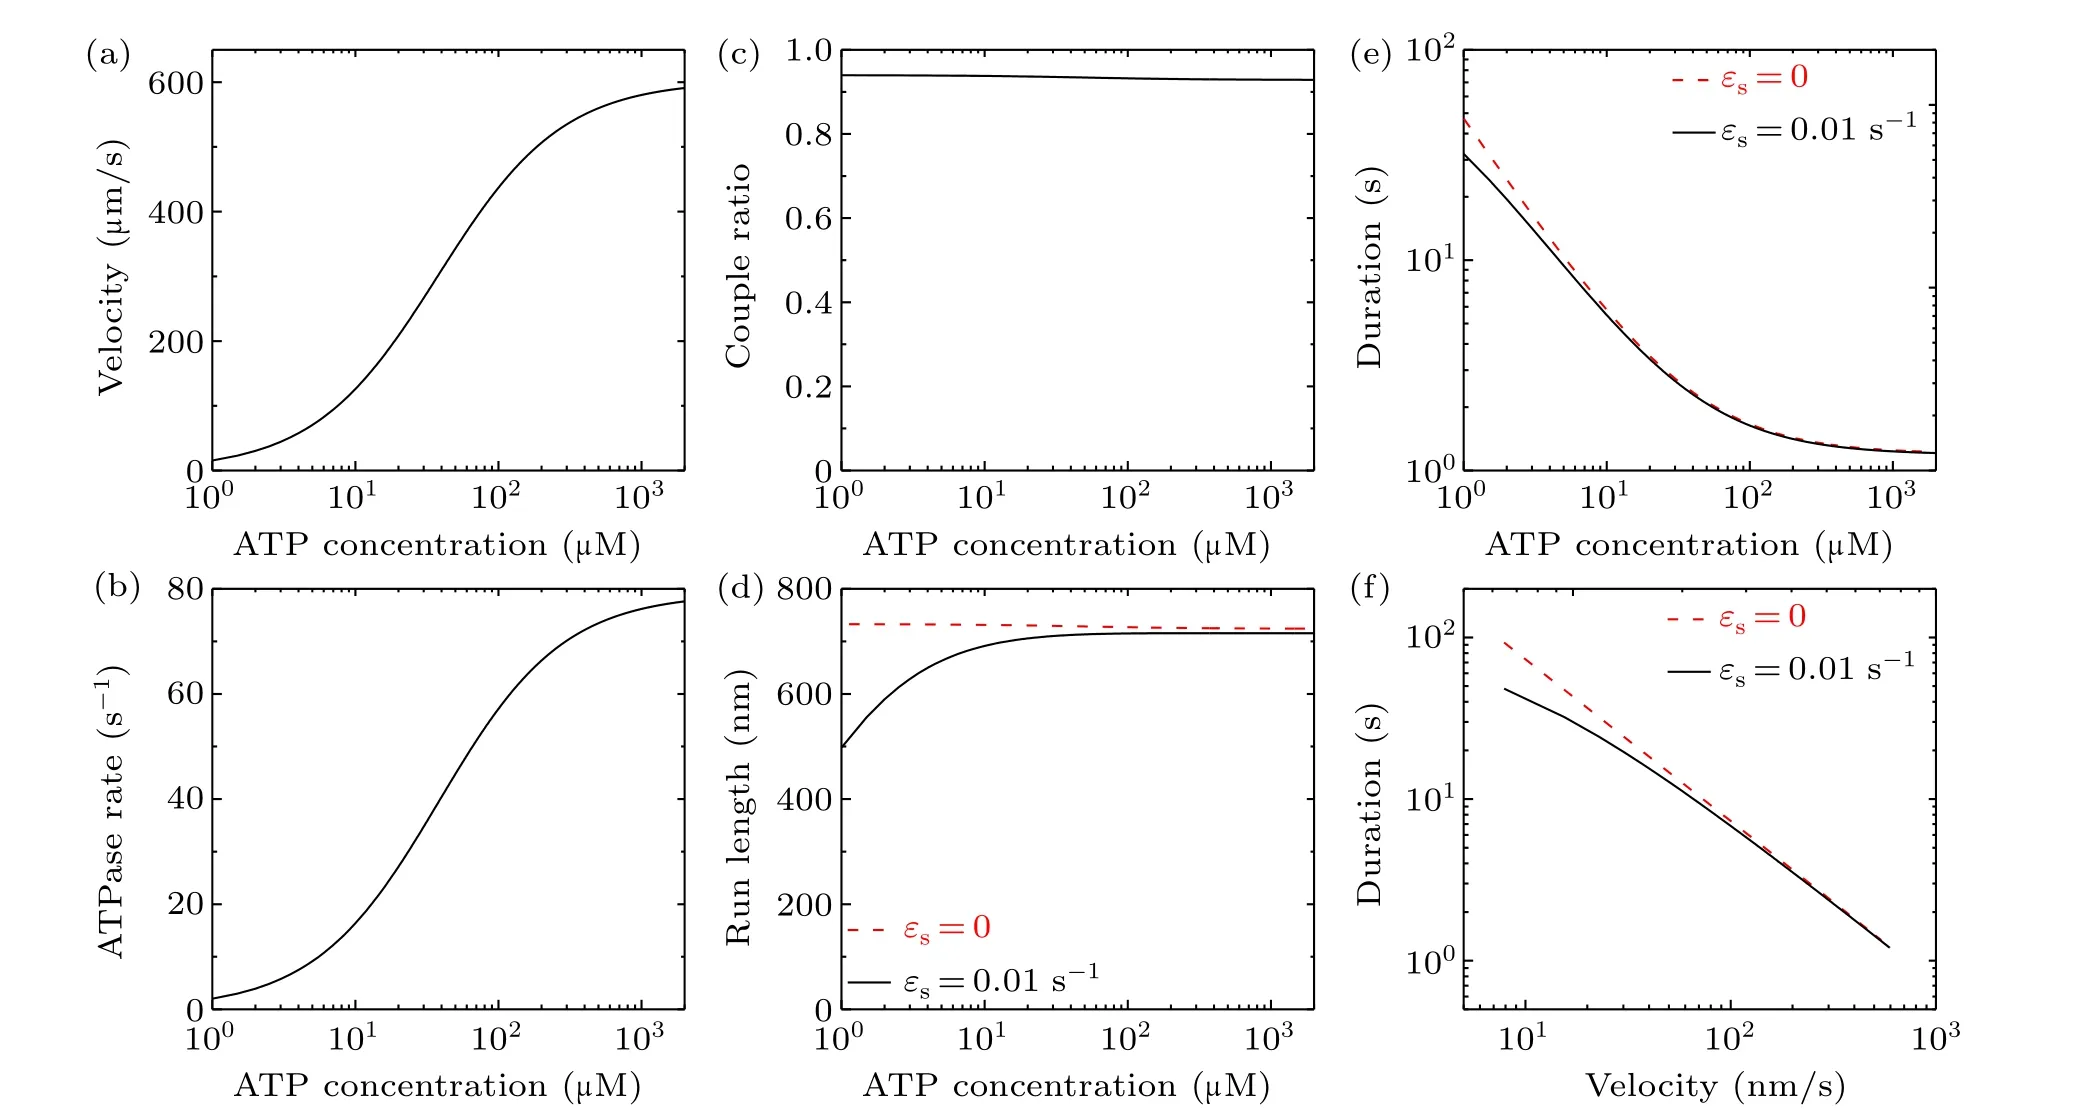
Fig.4.Effect of varying ATP concentration on the dynamics of bovine brain kinesin-1 at temperature T =298 K(25◦C).(a)Velocity versus ATP concentration: the velocity is independent of εs.(b)ATPase rate versus ATP concentration: the ATPase rate is independent of εs.(c)Chemomechanical coupling ratio versus ATP concentration: the ratio is independent of εs.(d) Run length versus ATP concentration for εs =0 and εs=0.01 s-1.(e)Attachment duration versus ATP concentration for εs=0 and εs=0.01 s-1.(f)Relationship between velocity and attachment duration for εs=0 and εs=0.01 s-1.
3.4.Effect of varying the rate of ATP transition to ADP
In this section, we study the effect of varying the rate of ATP transition to ADP on the dynamics of a bovine brain kinesin motor at saturating ATP and at fixed temperatureT=298 K (25◦C).In experiments, this can be realized by mutating residues near the nucleotide-binding pocket.For simplicity, we consider that the mutation has little effect on the rate of ADP release.For the mutated case, the rates of ATP transition to ADP in heads with and without forward NL orientation,k(+)andk(-),are taken to be multiplied by a factorα(α ≤1)relative to the WT case,while all other parameters are the same as for the WT case.In other words, except fork(+)andk(-)being replaced byαk(+)andαk(-),respectively,all equations are the same as those given in Section 2.
As above, for the WT motor we takeP0= 1 here and consider two values forεs, namelyεs=0 andεs=0.01 s-1.All other parameters for the bovine brain kinesin motor are listed in Table 1.In Figs.5(a)–5(e)we show the theoretical results for the velocity,ATPase rate,chemomechanical coupling ratio, run length and attachment duration versusα.As expected,the ATPase rate,and thus the velocity,increase approximately linearly with increase inα(Figs.5(a)and 5(b)),giving a chemomechanical coupling ratio that is nearly independent ofα(Fig.5(c)).Interestingly, with increase inαthe attachment duration decreases faster than linearly(Fig.5(e)),resulting in the run length decreasing faster than linearly(Fig.5(d)).We can explain the origin of these features as follows.SinceP0=1,PEis nearly equal to 1,kNL≫k(+)andk(-)≪k(+),and from Eqs.(2)–(5)it is noted thatkT,kL,kandvincrease approximately linearly with increase inα.SincekD≫k(+)andkD≫kd, from Eqs.(7) and (8) it is noted thatPwPdincreases approximately linearly with increase inα.As already mentioned,kTandkLincrease approximately linearly with increase inα.Thus,from Eq.(9)we note that with the increase inα,εwincreases faster than linearly, resulting in the attachment duration decreasing faster than linearly.Furthermore,with the results for velocity (Fig.5(a)) and those for attachment duration (Fig.5(e)), the obtained relationship between velocity and attachment duration is plotted in Fig.5(f),showing the tradeoff between the two factors.
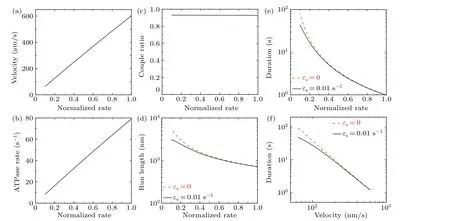
Fig.5.Effect of varying the rate of ATP transition to ADP on the dynamics of bovine brain kinesin-1 at temperature T =298 K(25 ◦C)and at saturating ATP concentrations.The normalized rate of ATP transition to ADP is defined as the rate for the motor with mutation of residues near the nucleotide-binding pocket normalized by that for the WT motor.(a)Velocity versus normalized rate of ATP transition to ADP:the velocity is independent of εs.(b)ATPase rate versus normalized rate of ATP transition to ADP:the ATPase rate is independent of εs.(c)Chemomechanical coupling ratio versus normalized rate of ATP transition to ADP: the ratio is independent of εs.(d) Run length versus normalized rate of ATP transition to ADP for εs =0 and εs =0.01 s-1.(e) Attachment duration versus normalized rate of ATP transition to ADP for εs =0 and εs=0.01 s-1.(f)Relationship between velocity and attachment duration for εs=0 and εs=0.01 s-1.
3.5.Comparison of the relationship between velocity and attachment duration for different cases
In Figs.2(f),3(f),4(f)and 5(f)we show the relationship between the velocity and attachment duration for four different cases.To make a clearer comparison,we summarize these relationships in Fig.6(solid lines),where the available experimental data[21,25]are also shown(triangles).In Fig.6,curve 1(red solid line)corresponds to the curve shown in Fig.2(f)for the case of varying intramolecular strain, curve 2 (blue solid line) corresponds to the curve shown in Fig.3(f) for the case of varying solution temperature,curve 3(black solid line)corresponds to the solid curve shown in Fig.4(f) for the case of varying ATP concentration and curve 4(green solid line)corresponds to the solid curve shown in Fig.5(f) for the case of varying the rate of ATP transition to ADP.
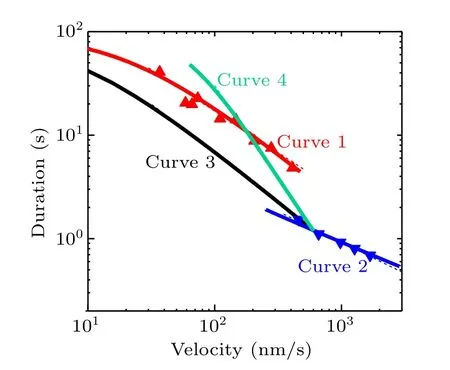
Fig.6.Relationships between velocity and attachment duration under four different cases.Curve 1 (red solid line) corresponds to the curve shown in Fig.2(f)for the case of varying intramolecular strain,with the red triangles being the experimental data from Yildiz et al.[21] Curve 2(blue solid line) corresponds to the curve shown in Fig.3(f) for varying solution temperature, with the blue triangles being the experimental data from Nara and Ishiwata.[25]Curve 3(black solid line)corresponds to the solid curve shown in Fig.4(f)for varying ATP concentration.Curve 4(green solid line)corresponds to the solid curve shown in Fig.5(f)for varying the rate of ATP transition to ADP.Thin dashed lines are the power law(Ta ∝v-α)fitting to the solid curves in the region of larger v or to the experimental data if they are present,with α =0.8,0.6,0.95 and 1.8 for curves 1,2,3 and 4,respectively.
By comparing curve 2 with curve 1, it is interesting that for varying solution temperature the attachment duration decreases more slowly with velocity than for varying intramolecular strain.This can be explained as follows.For varying solution temperature (see Subsection 3.2), since log(PwPd) decreases with log(T)(Fig.S2(d))it is expected that the magnitude of the increasing slope of log(v)versus log(T)is larger than that of log(εw)versus log(T),resulting in the magnitude of the increasing slope of log(v) versus log(T) being larger than the magnitude of the decreasing slope of log(Ta) versus log(T).By comparison,for varying intramolecular strain(see Subsection 3.1),the magnitude of the increasing slope of log(v)versus log(P0)is nearly equal to that of log(εw)versus log(P0).Thus, for varying solution temperature the attachment duration would decrease more slowly with velocity than when intramolecular strain is varied.
By comparing curve 3 with curve 1, it is seen that for varying ATP concentration and varying intramolecular strain we have similar rates of decrease of attachment duration versus velocity.This can be explained as follows.For varying ATP concentration(see Subsection 3.3),the velocity is proportional tokTandkL, andεwis also proportional tokTandkL,withkTandkLincreasing with ATP concentration.For varying intramolecular strain (see Subsection 3.1), the velocity is approximately proportional toP0, andεwis also approximately proportional toP0.The slight difference in the rate of decrease of attachment duration versus velocity between the two cases can be explained as follows.For varying ATP concentration,the change in velocity arises from the change in the ATPase rate whereas the chemomechanical coupling ratio is virtually unchanged (Fig.4).By contrast, for varying intramolecular strain, the change in velocity arises from the change in the chemomechanical coupling ratio whereas the ATPase rate is virtually unchanged(Fig.2).
By comparing curve 4 with curve 3, it is seen that for varying rate of ATP transition to ADP the attachment duration decreases faster with velocity than when ATP concentration is varied.This can be explained as follows.For varying rate of ATP transition to ADP(see Subsection 3.4), with increase inαthe velocity increases approximately linearly (Fig.5(a))whereas the attachment duration decreases faster than linearly(Fig.5(e)).By comparison, for varying ATP concentration(see Subsection 3.3),the velocity is proportional tokTandkL,andεwis also proportional tokTandkL, withkTandkLincreasing with ATP concentration.
Similar to the work of Rizvi,[26]we fit the theoretical results (solid curves) in the region of largervor fit the experimental data if they are present using the power-law relationTa∝v-α(thin dashed lines), withα=0.8, 0.6, 0.95 and 1.8 for curves 1, 2, 3 and 4, respectively.Note thatα=0.8 for curve 1 under the case of varying intramolecular strain andα=0.6 for curve 2 under the case of varying temperature are the same as the values obtained in Ref.[26].Interestingly, it is seen that for a varying rate of ATP transition to ADP(curve 4)αhas the largest value of 1.8,which is the same as that obtained in Ref.[26] by fitting the experimental data of Clearyet al.[36]for a dynein motor (see Fig.S3 in the supplementary information).Note that the experimental data of Clearyet al.[36]for a dynein motor were obtained by mutating residues that affect the ATPase activity,which is similar to the case of variation of the rate of ATP transition to ADP studied here for the kinesin motor.As shown by previous modeling studies,the cytoplasmic dynein dimer could have a similar chemomechanical coupling pathway to the kinesin dimer.[37]Thus, it is expected thatα= 1.8 obtained here for a kinesin motor should be consistent with that obtained by fitting the experimental data of Clearyet al.[36]to the theoretical equations for a dynein motor.
4.Concluding remarks
In this paper we have studied the dynamics of kinesin motors theoretically under four different cases,including varying intramolecular strain,solution temperature,ATP concentration and the rate of ATP transition to ADP that can be realized by mutating the residues near the nucleotide-binding pocket.The theoretical results explain quantitatively the available experimental data and provide predictions.The results show that different cases can lead to different rates of decrease of the attachment duration versus velocity.The origin of the tradeoff between velocity and attachment duration is explained.The origin of the difference in the decreasing rate of attachment duration versus velocity for different cases is explained.Finally, it should be mentioned that this work only focuses on the case of no load on the motor.However, note that under a given load on the motor,the tradeoff between velocity and attachment duration for the four cases should be still maintained.
Acknowledgment
We are very grateful to Professor P Xie for the constructive discussions and comments on the manuscript.
猜你喜欢
中国环境科学(2023年8期)2023-08-29
林业科技(2022年2期)2022-04-27
方圆(2019年13期)2019-07-26
审计月刊(2019年4期)2019-06-18
宝藏(2018年12期)2019-01-29
宝藏(2018年5期)2018-05-26
汽车之友(2017年14期)2017-07-31
中华奇石(2014年12期)2014-07-09

- Chinese Physics B的其它文章
- Unconventional photon blockade in the two-photon Jaynes–Cummings model with two-frequency cavity drivings and atom driving
- Effective dynamics for a spin-1/2 particle constrained to a curved layer with inhomogeneous thickness
- Genuine entanglement under squeezed generalized amplitude damping channels with memory
- Quantum algorithm for minimum dominating set problem with circuit design
- Protected simultaneous quantum remote state preparation scheme by weak and reversal measurements in noisy environments
- Gray code based gradient-free optimization algorithm for parameterized quantum circuit