
Effect of cognitive training on brain dynamics
2024-02-29 09:17GuiyangLv吕贵阳TianyongXu徐天勇FeiyanChen陈飞燕PingZhu朱萍MiaoWang王淼andGuoguangHe何国光
Chinese Physics B 2024年2期
Guiyang Lv(吕贵阳), Tianyong Xu(徐天勇), Feiyan Chen(陈飞燕),Ping Zhu(朱萍), Miao Wang(王淼), and Guoguang He(何国光)
School of Physics,Zhejiang University,Hangzhou 310027,China
Keywords: brian dynamics,functional brain networks,cognitive training,abacus-based mental calculation
1.Introduction
The human brain is composed of billions of neurons in various levels of complex structures.Revealing the relationship between complex structures and functions of the brain is one of the current focuses of neuroscience.Su´arezet al.built artificial neural networks with the network structures of brain regions.[1]The networks have shown stronger performance in the memory coding task than any other networks, which indicates that the network structures are essential for the brain to perform tasks efficiently.The work by Kanakaet al.revealed that a randomly connected recurrent neural network(RNN)can carry out memory work by modifying certain connections of the network and a signal is transmitted through the interaction between synapse and external input.It means that the neural signal sequence may emerge through learning from the unstructured network architectures.[2]Therefore,flexible and variable connections of brain regions are necessary for the brain to realize various cognitive tasks.At present,most of the whole-brain dynamics researches have focused on the synchronization or chimera state among brain regions by the interaction between the coupled nodes with the structural brain network.[3–5]It is lack to understand how the structures in brain networks affect the overall performance of the brain,and how the information contained in the network structures is expressed through dynamic activities.
In terms of cognitive experiments, it is known that the human brain is highly plastic.[6]Cognitive training can lead to the modification of the brain’s functional excitation mode and achieve better task performance.Abacus-based mental calculation(AMC)is one of typical cognitive training method.[7–9]Previous studies have shown that the resting-state functional connections between the brain regions of the subjects would be changed by long-term abacus mental arithmetic training.[10,11]The experiments demonstrated that AMC training can enhance the subjects’ numerical processing efficiency[12]and improve their working memory.[13]Based on task-state fMRI,it was found that the brain excitation patterns and functional structures between brain regions for the experimental group with AMC training are different from those for the control group.[14]The overall performance of the brain is determined by the network structures and node dynamics.[15,16]Up to date,most AMC researches are focused on revealing the correlation between cognitive abilities and functional structures.The influence of functional connections on brain dynamics is rarely reported.How functional connectivity affects the overall dynamics of the brain remains unclear.
Brain activity not only is based on structural networks,but also depends on factors such as external stimuli and neurotransmitter levels.[5,17]It is found that some brain regions are not directly connected in structure, but they show functionally relations,[18]which means that the functional networks are the embodiment of brain interaction after various factors are coupled.Therefore, we utilize the functional brain networks as the connection structures of brain regions in our work.The resting-state fMRI data of the AMC group and the control group are collected to establish the functional networks and dynamic behaviors of functional networks from the AMC group and the control group are investigated in this work.Indeed, small networks based on simple oscillators are also capable of reproducing the collective dynamics of the brain and are expected to be used for disease-related simulations.[19]For example,whole brain dynamics simulations based on the FHN model are able to demonstrate spontaneous brain activity.[20]Like the FHN model,the Hindmarsh–Rose(HR)model has a wealth of dynamic characteristics from single neuron to neuron clusters and is often used in brain dynamics modeling.[21]The neural network model based on neuron models can reproduce EEG-like oscillatory signals.[22]Mitchellet al.used the same method to reproduce the process of seizures in mice.[23]Chouzouriset al.and Kanget al.used the HR model and FHN model to replace a brain region to study the synchronization and chimera state of brain.[24,25]Ramlowet al.used the FHN model to study unihemispheric sleep in the human brain.[26]A similar approach was used in the early diagnosis of brain tumors.[27]Antonopouloset al.verified that the brain evolves by maximizing its information flow capacity through HR neural networks.[28]Focusing on dynamic modeling based on brain networks,Santoset al.discovered chimera-like states in cat brain networks with the HR model.Our previous study has demonstrated that the dynamics of the resting-state brain can be simulated using the HR model and functional networks.[29]Ansarinasabet al.used the HR model and functional networks based on EEG signals to identify chimera states in both attention deficit hyperactivity disorder (ADHD) patients and control groups.In the presence of emotional stimuli, the ADHD group exhibited premature synchronization,leading to abnormal brain emotional processing function.[30]
In view of wide applications of the HR model, it is feasible to replace one brain region with the HR model in the brain networks.A complete brain dynamics model can be constructed on the basis of functional connections of the brain and the HR model.Our previous work proved that this model can well simulate the dynamic behavior of the brain at resting state.[29]Using this model, we try to study the dynamic differences between the AMC group and the control group, and reveal the functions of AMC training on brain dynamics.
The rest of this article is structured as follows.The resting-state functional brain networks are introduced in Second 2.In Section 3, the resting-state brain network dynamics model is described and simulations are conducted.The task-state brain dynamics model is given in Section 4,and the dynamic differences between the AMC group and the control group are pointed out too.The differences in the topological structure of the resting-state functional networks between the AMC group and the control group are analyzed in Section 5.The conclusion is given in Section 6.
2.Functional brain networks of the resting-state
The structures of functional networks in the restingstate are similar to those in the task-induced states to some extent,[31,32]and the task-related activation patterns can be explained partly by the functional connections between brain regions in the resting state.[33]In order to study the effect of functional connectivity on brain dynamics, we collect fMRI data of 25 subjects trained by AMC and other 24 subjects as a control group.The data are measured in the resting state.The corresponding functional networks in the resting-state are constructed.All subjects are from urban families,have normal hearing,normal or corrected vision,no neurological or mental disorders,and no special educational assistance requirements.Participants in the experimental group and the control group are randomly selected.The details about the experiment can be found in Ref.[34].
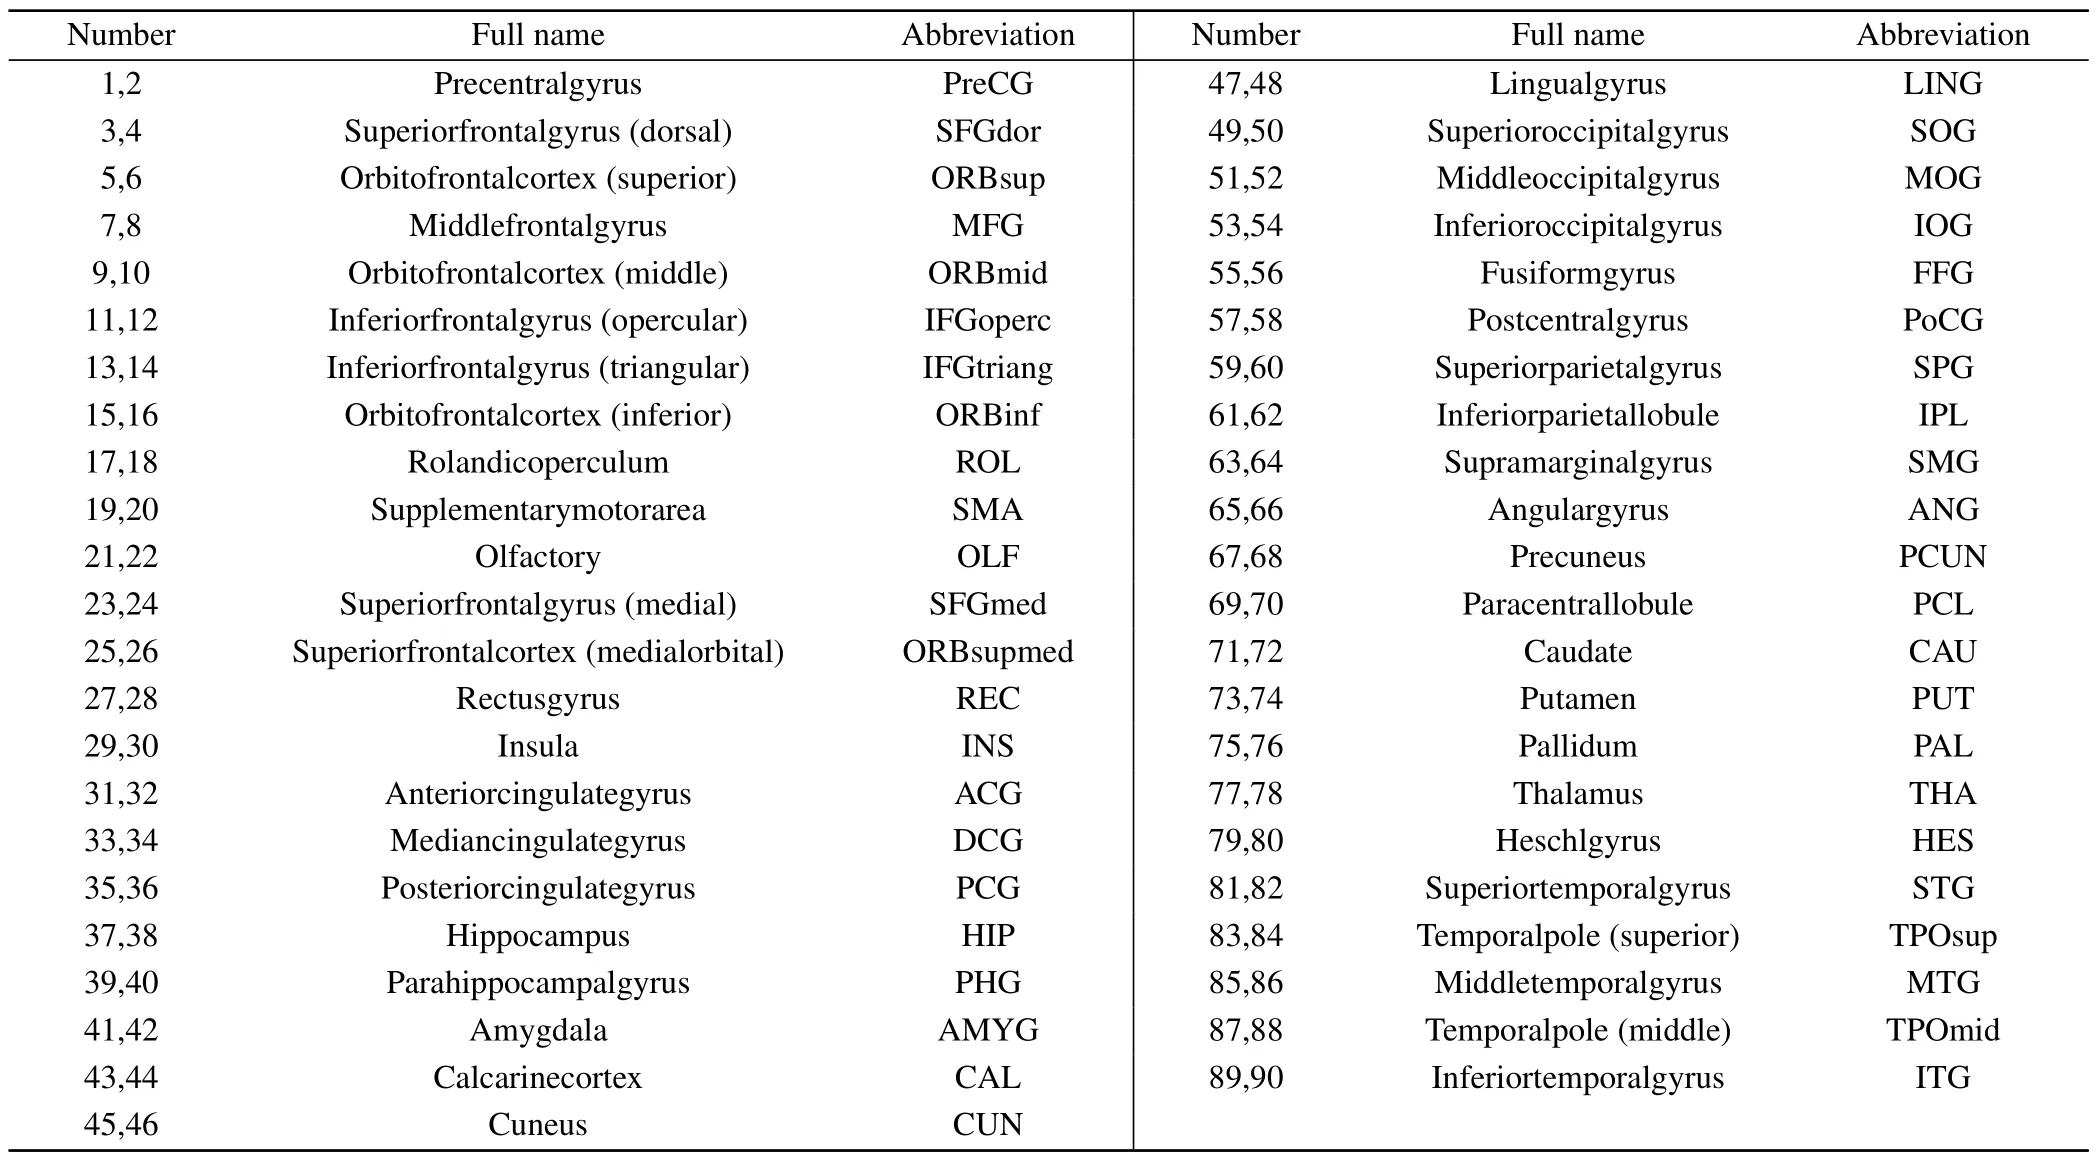
Table 1.Regions of interest included in the AAL-atlas(45 in each cerebral hemisphere,90 in total,odd/even numerical order for left/right hemisphere).
Different templates for brain regions would lead to different number of nodes and topology structures in brain networks.[35]We believe that the main dynamic properties would be similar in different templates.In order to make comparisons with previous studies, we used the widely adopted AAL template,[36]which divides the brain into 90 regions as shown in Table 1.The correlations between brain regions are expressed by Pearson correlation.The correlation coefficient matrix of the functional brain network for a subject is denoted byR.Rijis the correlation coefficient between thei-th andj-th brain regions.
Usually, there are individual differences in functional connections among subjects.[37]To highlight the changes in brain functional connectivity caused by AMC training and to avoid the influence of individual differences,we take an average on functional connections for different groups,that is,two averaged correlation coefficient matrices are obtained for the AMC group and the control group.The correlation coefficient matrices are shown in Fig.1.
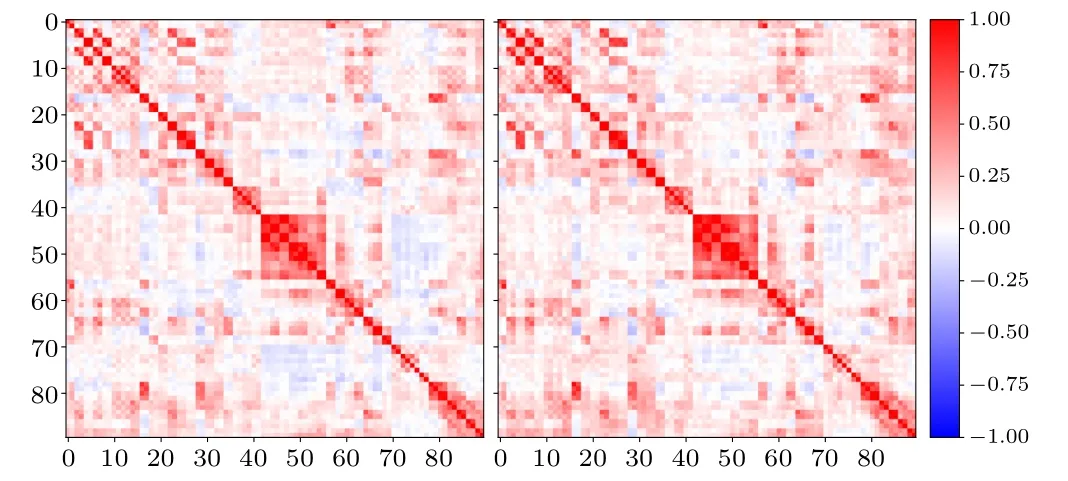
Fig.1.Correlation coefficient matrices of the control group and AMC group.Left: the control group.Right: the AMC group.
In addition, in constructing a functional brain network,experimental noise should be removed while the connection density between brain regions is in a reasonable range to ensure that there are no isolated nodes.It is therefore necessary to select a thresholdTfor the correlation coefficient matrix.When the absolute value of the correlation coefficientRijis less thanT, it is considered that there is no functional connection between the two brain regions, and theRi jis turned to be 0.For averaged correlation coefficient matrices of the AMC group and the control group,we choose thresholdTas 0.22 based on the following criteria: no isolated nodes and a connection density of approximately 20%in networks.The matrices after thresholding are shown in Fig.2.It can be found that the connection structures of brain networks for the AMC group and the control group are similar,but not identical.
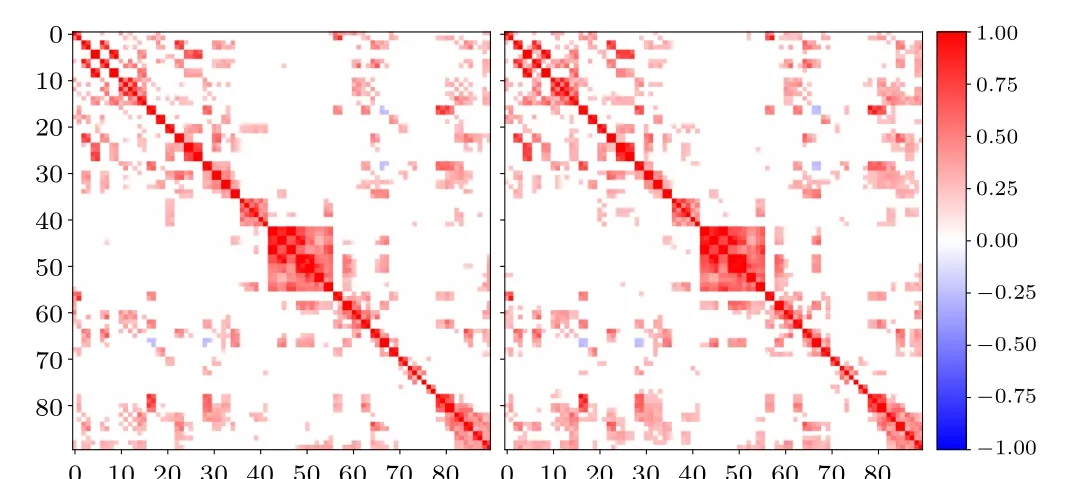
Fig.2.The correlation coefficient matrices of the control group and the experimental group after threshold processing.Left: the control group.Right: the AMC group.
3.Resting-state brain dynamics
3.1.Model of resting-state brain dynamics
The HR model can exhibit most dynamic properties observed at the level of real neurons,such as regular and irregular spiking and bursting,and at the level of the collective brain behaviors.In order to explore the influence of functional connections between brain regions on the dynamic activities of the brain,the HR model is introduced to functional brain networks of the AMC group and the control group.A dynamics model for a resting-state functional brain network was established by using the HR model instead of brain regions and the correlation coefficients between brain regions as the connection weights.[29]The dynamics model can be expressed as
wherexirepresents the cortical electrical signal of thei-th brain region, anda,b,c,d,r,s, andxrare model parameters;Ibiasis the bias current, which regulates the intensity of dynamic activity of brain regions;σis the gain coefficient, which regulates the connection strength between brain regions.The parameters are set as follows,a=1.0,b=3.0,c=1.0,d=5.0,s=4.0,r=0.006,xr=-1.56,Ibias=1.6,andσ=1.2.We find that all brain regions in the functional brain networks of the AMC group and the control group exhibit bursts of spikes, as shown in Fig.3(a).Different from a single HR model, the nodes in the networks show obvious entrainment behavior, that is, the fast oscillations of the encoded signals are mixed with lower frequency oscillations,which is an effective means for information transmission between neurons.[38,39]The dynamic behavior shown in Fig.3(a)is consistent with the remote communication mode in the brain,in which low-frequency resonances determine the longdistance information exchange while high-frequency oscillations characterize the local neural activities in the brain.[40]
We perform Fourier transform on the cortical electrical signal of brain regions.Fourier transform of Fig.3(a)is shown in Fig.3(b).Compared with the resting state EEG signal shown in Fig.3(c),it can be found that the spectrum characteristics of the cortical electrical signal generated by our model is consistent with that of the resting state EEG signals.
In order to analyze the dynamic characteristics of brain regions,we count the spikes in bursts.In accordance with the patterns of node bursts, the time width of the burst is defined as the interval from the time when the potential,denoted asx,exceeds the threshold of-1.3 to the time when it falls below the threshold of-1.3 (ending the bursting discharge).Additionally, within this bursting discharge interval, a spike was confirmed when the potential change goes from negative to positive.
The spikes in bursts are almost stable or random in some brain regions,while in other brain regions spikes in bursts look similar periodic, as shown in Figs.4(a)–4(c).In order to distinguish the dynamic behavior of the brain regions, we make spatial transformation on the spikes according to the following equation:
whereMnrepresents the number of spikes in then-th burst,andNrepresents the total number of bursts.The results of spatial transformation on the spikes are shown in Figs.4(d)–4(f).The dynamic behavior of brain regions can be divided into the stable mode,the chaotic mode,and the periodic mode.
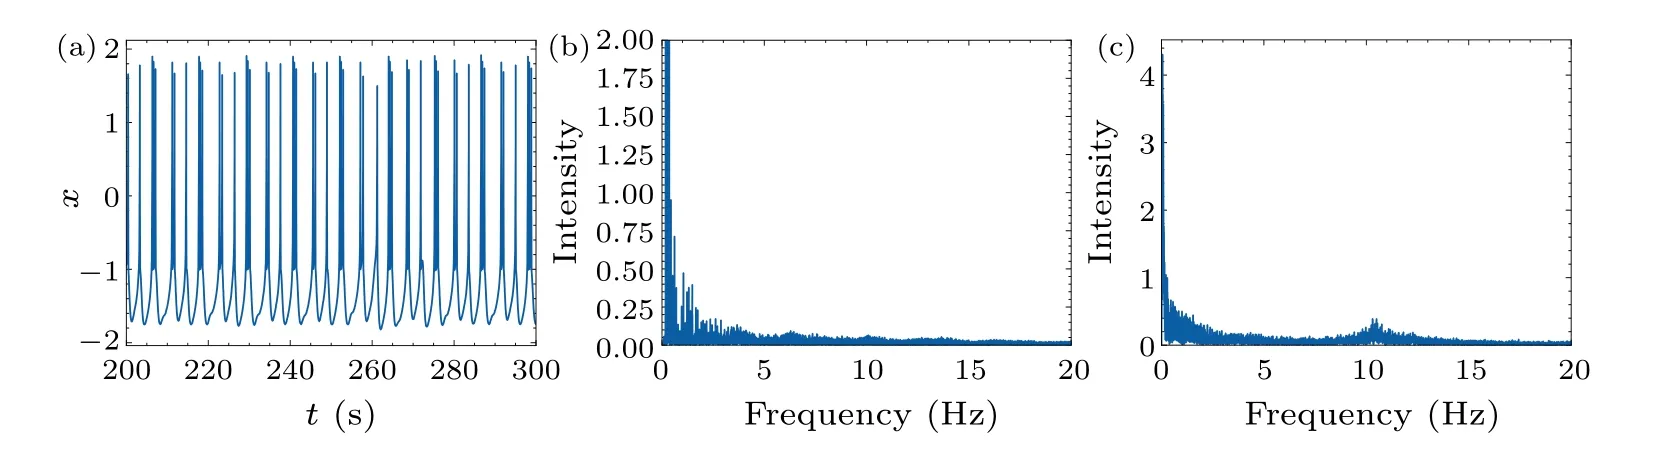
Fig.3.(a) The signal of PUT(R) of control group.(b) Spectrum distribution of PUT(R)’s signal.(c) Typical resting-state EEG spectrum distribution.
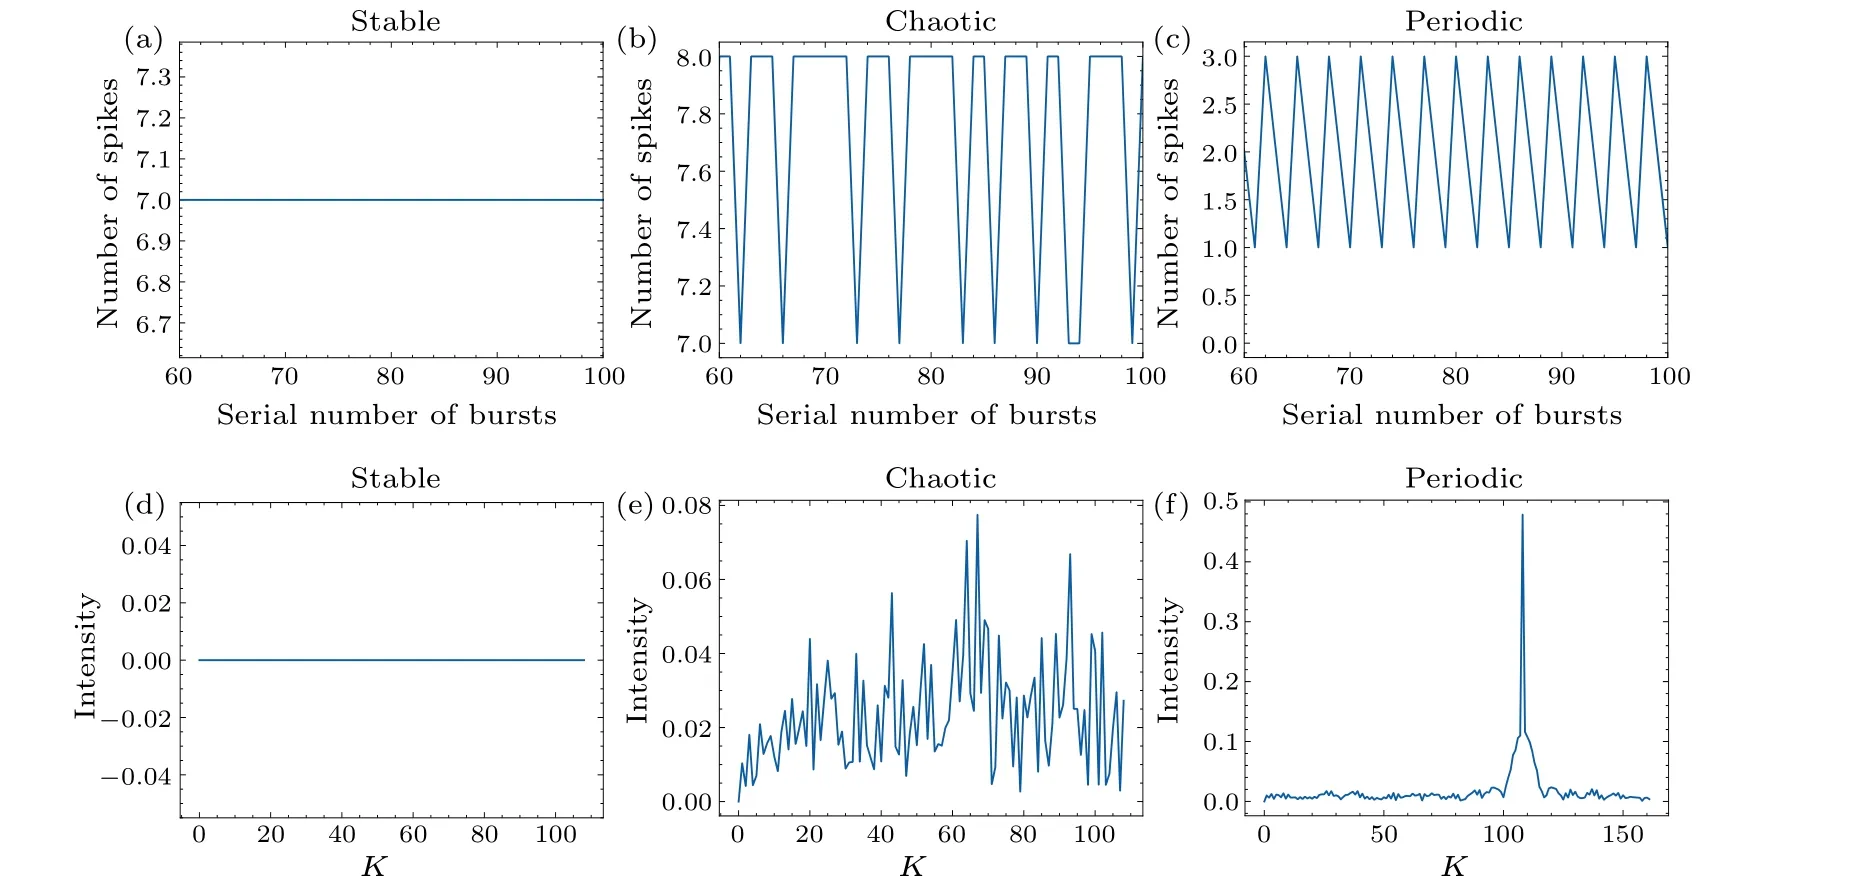
Fig.4.The numbers of spikes and their spatial transformations of different modes (control group).[(a), (d)] IFGoperc(L), stable mode.[(b),(e)]TPOsup(R),chaotic mode.[(c),(f)]PUT(R),periodic mode.
3.2.Results of resting-state dynamics
Our previous work revealed that the brain regions in periodic mode are active ones.[29]Under the same parameter settings,we obtain all activated brain regions of the AMC group and the control group.As shown in Fig.5, the AMC group and the control group have four common activated brain regions under the same parameter settings, namely CAU(L,R)and PUT(L,R)brain areas.CAU and PUT form the basal ganglia,which play an important role in advanced cognitive activities such as learning, memory, reward, motivation, emotion,and romantic interaction.[41,42]Meanwhile, the AMC group has other three activated brain regions which are AMYG(L),and THA(L,R).Further analysis revealed that the activated brain regions in both the AMC group and the control group are located in the basal ganglia.Previous research indicates that the basal ganglia network is similar to the default mode network and is one of the main activation areas in the restingstate brain.[43]More brain regions are inspired in the AMC group.It is confirmed that AMC training induces functional changes in brain activation and such plasticity may be transferable beyond the AMC.[44]Wanget al.,based on task-based fMRI,confirmed similar group difference of the activation regions between the AMC group and the control group,and the difference was closely related to the subjects’performance in then-back task.[34]
Our dynamical simulations based on the resting-state functional brain network prove that the differences of brain activation between the AMC group and the control group exist.Since the parameter settings of our dynamic model are the same for both the AMC group and the control group,we guess that the group differences on the activation of brain regions are caused by the different connectivity of their functional brain networks.
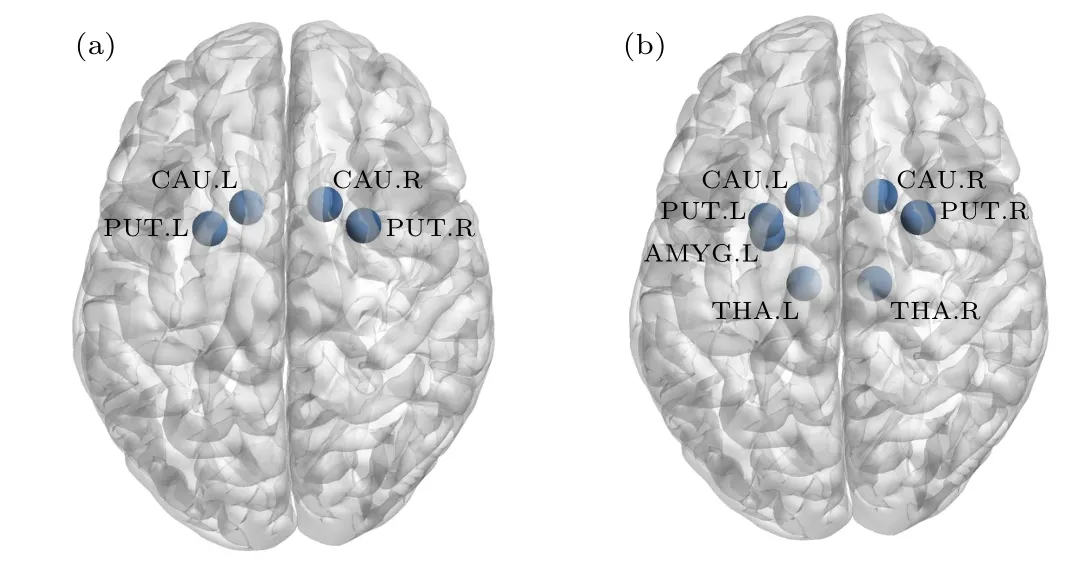
Fig.5.(a)Activated brain area of control group,(b)activated brain area of AMC group,plotted with BrainNet Viewer.[45]
4.Task state brain dynamics
4.1.Dynamic characteristics of task states
Transcranial alternating current stimulation (tACS) can induce brain activation or inhibition and has been widely cited in studies related to brain dynamics.[46]For example,tACS at the appropriate frequency induces phosphenes, activating the visual cortex.[47]We therefore add sinusoidal signals to brain networks to simulate the brain dynamics in the task states.The dynamic model of the brain is transferred as follows:
whereIextis an external sine stimulus, and the other parameters are the same as those used in Section 3.After adding the sinusoidal signals,the activities of most brain regions become periodic mode.The result further demonstrates that the periodic mode is a kind of active performance.We count the excitation rate(the proportion of brain regions in the periodic mode)and the response intensity(the average dynamic intensity of brain regions obtained under Fourier transform at the same cycle as the external sinusoidal signals).The response intensity represents the synchronization of networks.
As shown in Fig.6(a), when the cycle of the sinusoidal signals is near 150(the time length in the HR model),the dynamics of the brain networks varies significantly.At small cycle, the excitation rates of the AMC group and the control group are similar,and both show high excitation rates.When the cycle is about 150 or above 150,the periodic mode is suppressed, and the AMC group exhibits a higher excitation rate than the control group.The response intensities at different cycles are plotted in Fig.6(b).The response intensity is dependent on the cycle.When the cycle is less than 150, the response intensity displays positive correlation with the cycle,and the response intensity of the AMC group is lower than that of the control group.When the cycle is greater than 150,the response intensities of the two groups are relatively stable,while the response intensity of the AMC is higher than that of the control group.
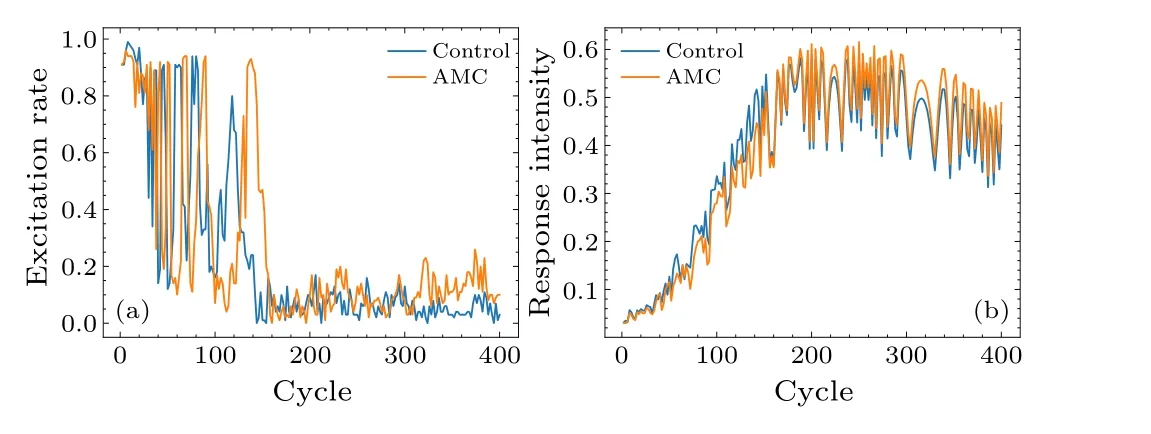
Fig.6.(a)The excitation rates.(b)The average response intensities.
4.2.State space analysis
The state space is a two-dimensional space shaped by the average time width of the bursts and the average number of spikes in the bursts, and is used to describe the communication behavior between the neuron clusters.[38]We introduce the state space to find out the origin of the dynamic differences between the AMC group and the control group.We mark the dynamic behaviors of all brain regions for the AMC group and the control group with the stimulus of sinusoidal signals at different cycles in the state space,as shown in Fig.7.
Analyzing the distributions of brain region activities in the state space,one can observe that obvious mode switching exists for both groups as the cycle of sinusoidal signals increases, as shown in Figs.7(a)–7(c).In the state space, the power exponents of the state distributions of the brain activities evolve from positive to negative as the cycle of sinusoidal signals increases.The power law is strong evidence that the brain works near a critical state.[48]Based on multiple datasets,Fonteneleet al.found that the critical exponents point to a universality class different from mean-field directed percolation.[49]Further research by Fosqueet al.revealed that as external stimuli drive the cortex, quasi criticality predicts a departure from criticality along a Widom line with exponents that decrease in absolute value,while still approximately maintaining a dynamical scaling relation.[50]
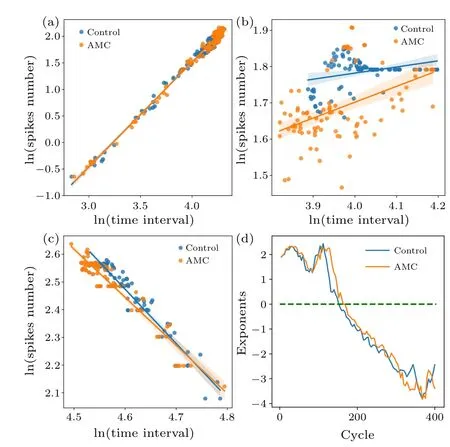
Fig.7.The distributions of brain activities in the state space with the stimulus of sinusoidal signals at different cycles:(a)cycle=8,(b)cycle=150,(c)cycle=256.(d)Exponent distribution over cycles.
Near the transition points between positive and negative exponents,the average excitation rates of both groups decrease rapidly as shown in Fig.6(a).The response intensity represents the synchronization of networks.From Fig.6(b), one can find that the overall synchronization of the brain networks for both groups has positive correlation with the cycle below the transition points and reach the maximum near the transition points.We define the states of brain networks with a high excitation rate and positive power exponent as the overall task states, and others are the critical state with high synchronous oscillation.
As shown in Fig.6, the AMC group has a higher excitation rate, but a lower response intensity during the overall task states than the control group,which means that the AMC group can do tasks with less concussion and higher efficiency by integrating the functional brain networks.The difference of the power exponents between the AMC group and the control group shown in Fig.7(d) indicates that the AMC group exhibits the overall task states in longer length of cycles,that is,the AMC group has stronger ability to perform task.In addition,the power exponents with different cycles also show a power law, which indicates further that the brain works near the critical state.
Previous research showed that AMC training can lead to a change in the excitation patterns of the subjects’brain,[9,11]strengthen working memory,[13]and improve the efficiency of numerical processing.[12,51]Evidence shows that these changes may be transferable beyond the AMC.[44]Our simulations based on functional brain networks confirm the differences of brain dynamics between the AMC group and control group,and AMC training can enhance the abilities of subjects to perform tasks.Since we use the same models for the AMC group and control group, our results indicate that the differences of brain dynamics come from the change of functional structures in brain networks by AMC training.
5.Graphy theoretical analysis of resting-state functional networks
Because the parameter settings for each node are consistent in our dynamic model, the differences in the overall and local dynamics of the network are attributed to differences in network structure only.Here, we use graph theory metrics to further analyze the differences in the topological structure of the resting-state functional networks between the AMC group and the control group.We calculate the connection density,connection strength, clustering coefficient, and characteristic path length for both networks.The specific definitions of these metrics are as follows:
Connectivity densityThe ratio of connections between brain regions to the possible number of connections, i.e., the proportion of non-zero elements in the correlation coefficient matrix after thresholding.
Connection strengthThe connection strength of a node represents the average strength of its connections to all other nodes.The network’s connection strength is the average of the connection strengths of all nodes,i.e.,the mean of the correlation coefficient matrix after thresholding.
Clustering coefficientThe clustering coefficient of a node is the ratio of the number of triangles formed by the node with other nodes to the total possible number of triangles.The network’s clustering coefficient is the mean of the clustering coefficients of all nodes,representing local efficiency.
The characteristic path lengthThe shortest path length of a node is the average number of minimum connecting edges required for it to be connected to other nodes.The network’s characteristic path length is the mean of the shortest path lengths for all pairs of nodes,representing global efficiency.
The topological characteristics of the AMC group and the control group networks are shown in Fig.8.Compared to the control group, the AMC group exhibits higher connection strength and connection density.Furthermore, the AMC group has a higher clustering coefficient and a lower shortest path length, indicating higher local and global efficiency.We believe that this optimization in network connectivity is the reason for the improvement in the dynamics of the AMC group.
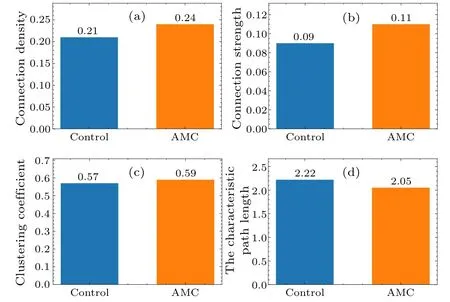
Fig.8.Differences in graph theory metrics between the networks of the control group and the AMC group: (a)connection density,(b)connection strength, (c) clustering coefficient, (d) the characteristic path length.
6.Conclusion
The dynamic behaviors of the brain at the resting and task states for the AMC group and the control group are simulated with the dynamic model established based on functional brain networks and the HR model.For the resting state, besides the common activated brain regions, more brain regions are inspired in the AMC group.A stimulus with sinusoidal signals to brain networks is used to simulate the brain dynamics in the task states.The dynamic characteristics are extracted by the excitation rates, the response intensities and the state distributions.Observing these quantities at different cycles of sinusoidal signals,obvious mode switching exists near the cycle of 150 for both groups.The state distributions of brain in the state space are expressed as a power law.The power exponents are dependent on the cycle of the external signals and turn from positive power exponent to negative ones as the cycle of the external signals increases.The transition points are near the cycle of 150.It is confirmed that brain works near a critical state.The AMC group displays a more extended active period in the overall task states,suggesting superior capabilities of task performance.
Since the dynamic parameters of each brain region are consistent during the experimental process, the differences in dynamics between the AMC group and the control group are attributed to differences in network connectivity only.Analysis reveals that compared to the control group,the AMC group has a higher network clustering coefficient and a smaller characteristic path length, indicating better local and global efficiency.We believe that the optimization in network structure is a potential reason for the superior dynamic performance of the AMC group.Our work proves that the changes in the functional structures of the brain with AMC training make the dynamic behaviors of subjects more efficient.The research method in this work can be used to simulate dynamic behavior of the brain and evaluate its dynamic performance.
Acknowledgement
Project supported by the National Natural Science Foundation of China(Grant Nos.62276229 and 32071096).
猜你喜欢
雪豆月读·低年级(2023年6期)2023-09-19
作文周刊·小学一年级版(2022年24期)2022-06-18
作文·小学低年级(2021年4期)2021-11-02
Chinese Physics B(2021年10期)2021-10-28
快乐作文(1.2年级)(2019年3期)2019-09-10
艺术品(2019年4期)2019-05-30
乡村地理(2018年3期)2018-11-06
艺术品(2018年9期)2018-10-23
中学数学杂志(初中版)(2017年4期)2017-08-28
湖海·文学版(2015年4期)2016-01-28

- Chinese Physics B的其它文章
- Unconventional photon blockade in the two-photon Jaynes–Cummings model with two-frequency cavity drivings and atom driving
- Effective dynamics for a spin-1/2 particle constrained to a curved layer with inhomogeneous thickness
- Genuine entanglement under squeezed generalized amplitude damping channels with memory
- Quantum algorithm for minimum dominating set problem with circuit design
- Protected simultaneous quantum remote state preparation scheme by weak and reversal measurements in noisy environments
- Gray code based gradient-free optimization algorithm for parameterized quantum circuit