
Source localization in signed networks with effective distance
2024-02-29 09:17ZhiWeiMa马志伟LeiSun孙蕾ZhiGuoDing丁智国YiZhenHuang黄宜真andZhaoLongHu胡兆龙
Chinese Physics B 2024年2期
Zhi-Wei Ma(马志伟), Lei Sun(孙蕾), Zhi-Guo Ding(丁智国), Yi-Zhen Huang(黄宜真), and Zhao-Long Hu(胡兆龙),†
1Zhejiang Normal University,School of Computer Science and Technology,Jinhua 321004,China
2Shanghai Business School,School of Business and Economics,Shanghai 200235,China
3Jinhua Polytechnic,School of Information Engineering,Jinhua 321016,China
Keywords: complex networks,signed networks,source localization,effective distance
1.Introduction
The uncontrolled dissemination of malicious content through the widespread diffusion and propagation of information in real life can result in significant societal losses.Examples include the rapid spread of false information on social media,[1,2]virus intrusion into computer networks,[3–5]the swift spread of negative or potentially harmful speech affecting national security,[6]as well as the emission of industrial pollutants and hazardous substances.[7,8]While much research has focused on studying information diffusion from the perspective of maximizing influence,[9,10]this paper addresses a reverse problem, namely source localization, which aims to accurately and efficiently identify the initial spreader of information.
Considerable advancements have been achieved in the field of source localization in complex networks.Shah and Zaman were pioneers in systematically investigating the identification of virus sources in networks, utilizing the classical susceptible–infectious–recovered (SIR) model.They introduced the rumor centrality measure in tree-like networks to estimate the source of information propagation.[11]This measure captured the likelihood of a node becoming a source based on its high rumor centrality.The authors extended this measure to general networks by assuming information spreads through breadth-first algorithms.Zhuet al.proposed the Jordan centrality algorithm for source localization, which yielded more accurate results for general networks compared to the rumor centrality measure.[12]Brockmannet al.introduced effective distance and combined it with maximum likelihood estimation to locate the source,enabling reliable prediction of disease arrival times.[13]Jianget al.further utilized effective distance to transform the original network,facilitating a clear understanding of complex diffusion processes.They employed ak-center method to identify multiple sources and the corresponding infection areas in general networks.[14]Other methods have also been proposed for source localization, including maximum likelihood estimation,[11,15–17]statistical physics,[18–21]reverse propagation,[22–34]machine learning,[35,36]etc.[37–39]
However,existing source localization research overlooks the signed nature of node connections, which is frequently encountered in signed networks, such as social networks that incorporate friend and enemy relationships.[40–42]Different from traditional networks, signed networks exhibit distinct properties in many aspects, including the information spread threshold cascades,[43]and the design of immunization strategies.[44]Zhanget al.discovered that an increase or clustering of negative interpersonal relationships in signed networks can lead to social unrest,thereby affecting the spread of diseases or information.[45]However, it is not clear whether signed networks show different results from traditional networks in terms of source localization.This paper concentrates on signed networks and proposes corresponding localization methods based on their structural characteristics.
Because it is not practical to obtain information from all nodes, quickly and accurately locating the source with a small number of observation nodes (also called as sensors or observers) is the main challenge.In existing research, observers are often chosen randomly or heuristically based on network centrality or community measures.However, these approaches are sensitive to outliers and may lead to falsepositive conclusions.Pintoet al.were the first to propose a reverse propagation method for source localization.[22]Paluchet al.selected observation nodes based on the ordering of node infection times,combined with gradient descent and reverse propagation,which improved localization accuracy and efficiency but required a large number of observers.[29]Huet al.used reverse propagation to infer the initial propagation time matrix and presented a greedy algorithm for optimizing observer selection, significantly reducing the number of observers needed.[46]These methods, however, are limited to single-source localization studies.Fuet al.presented the max–min method for addressing multi-source localization based on reverse propagation.[24]Building upon this work, Huet al.observed that the initial propagation time of the true source occurs at its maximum frequency in the referred initial propagation time matrix,leading to the proposal of a maximum–maximum source localization method.[30]Integer programming methods can improve accuracy, but observer selection remains random.[28]Nevertheless, the random observation method is still adopted,requiring a relatively large number of observers.Additionally,researchers have explored the optimal placement problem of observers in complex networks,including betweenness centrality(BC),[47]high coverage,[48]and other approaches.[49]The observation theory can be adopted to achieve the minimum number of observers,but only for linear diffusion systems.[50]Wanget al.proposed a full-order neighbor coverage(FONC)strategy to enhance the utilization of observers, significantly improving source localization accuracy.[31]The core idea of the FONC algorithm lies in excluding nodes in the same order as observers from being selected as observers,thereby increasing the utilization of observer nodes.Considering the difference in the propagation ability of positive and negative edges of signed networks, we convert the propagation ability of positive and negative edges into effective distance, and propose a new observer selection method.Meanwhile, for comparison, we propose several observer selection methods based on FONC.Furthermore, we develop a method for source localization in signed networks through reverse propagation.Our contributions are summarized as follows.
(i) We are the first to investigate source localization in signed networks, taking into account the signed nature of information propagation in social networks.
(ii) Based on the structural characteristics of signed networks,we propose a new method to optimize observer selection with effective distance.
(iii) Leveraging the idea of reverse propagation, we provide a source localization method specifically designed for signed networks.
(iv) By using effective distance to select observation nodes, we achieve high accuracy of source localization and high operating efficiency.
(v) The higher the proportion of positive edge, and the higher the ratio of positive edge propagation ability to negative edge propagation ability, the more beneficial to source localization.
The organization of this paper is as follows.In Section 2,we first introduce the signed network model and the propagation model.Then we present the observer selection strategy with effective distance.Finally, combining with the selected observers, we develop the method of source localization in signed networks with reverse propagation.In Section 3, we evaluate the accuracy of the algorithm for source localization.Finally,we summarize and discuss the paper.
2.Model and methods
2.1.Signed network model
The signed network is denoted asG={V,E},where the node setV={v1,v2,...,vN}and the edge set(vi,vj,wij)∈E,wij= 1 indicates the existence of a positive edge between nodesviandvj, whilewij=-1 indicates the existence of a negative edge.Figure 1(a)is a simple structure of the signed network.In this paper, we assume that the topological structure of networkGis known and remains unchanged.
2.2.Propagation model
In this paper, the susceptible–infectious (SI) model is adopted.Srepresents the susceptible state, andIrepresents the infected state.At timet0,information starts to spread.At a certain timet,a node is in either theSorIstate.In a signed network, positive edges and negative edges have a different propagation probability.We useθ+to represent the propagation probability of positive edges andθ-to represent the propagation probability of negative edges.Generally,θ+>θ-.Here,we assume that the information propagation starts from an unknown nodes*,and the initial propagation timet0is also unknown.The propagation process is as follows.
(i)At the initial timet0,only the source nodes*is in the informed(infected)state.
(ii) The informed nodes pass the information to their neighbors in the next time step based on the corresponding propagation probability of edge.
2.3.Observer selection strategies
Algorithm 1 Define the effective distance matrixS, as shown in Fig.1(b).The elementsSi jin matrixSrepresent the propagation score from nodevito nodevj.The propagation scoreSijis obtained by adding up the propagation probability on the shortest path from nodevito nodevj.If there are multiple equal shortest paths,we select the shortest path with the highest number of positive edges.The sum of elements in each row represents the total propagation score of the node.We select the node with the highest total propagation score as the observer and iterate untilηfor all nodes inV∖Obecomes 0.
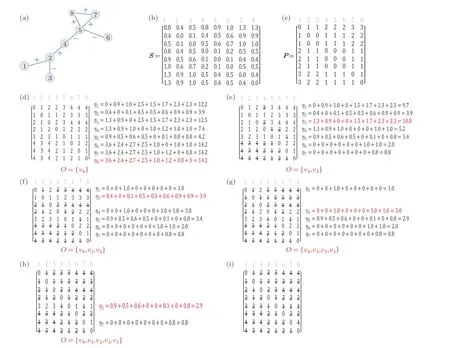
Fig.1.(a)A simple illustration of a signed network.+indicates the positive edge and-indicates the negative edge.(b)Effective distance matrix S.(c)Positive edge matrix P.(d)–(i)The process of Algorithm 4 for observer selection.Here,we assume that the propagation probability of positive edges θ+ is 0.4,and the propagation probability of negative edges θ- is 0.1.
Algorithm 2 Full-order neighbor coverage strategy(FONC).[31]We definedv j,vk=mas nodevkbeing them-thorder neighbor of nodevi,indicating the shortest distance betweenvjandvk.For an observero,we defineVvkoas the set of nodes that have the same shortest distance tovkas the observero.In other words,for anyvj ∈Vvko,we havedo,vk=dvj,vk>0.The FONC algorithm is an observer selection algorithm based on a greedy strategy, and its main algorithmic idea is as follows.
(i)LetObe the set of observer nodes,initially empty.
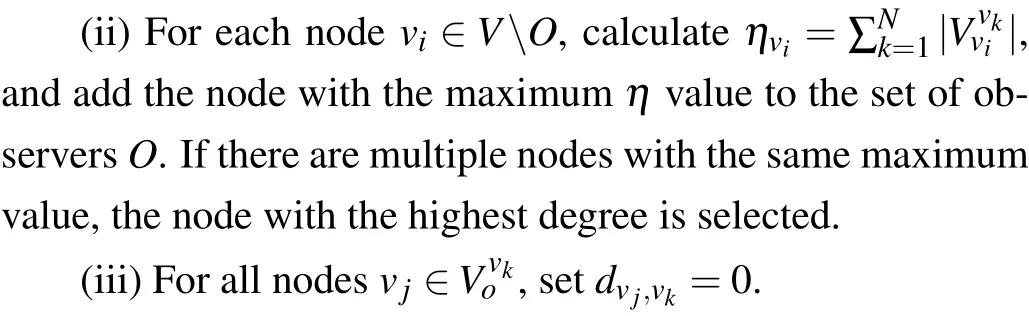
(iv)Repeat steps(ii)and(iii)untilηfor all nodes inV∖Obecomes 0.
Based on the FONC algorithm and considering the characteristics of positive and negative edge propagation capacities in the signed network, we improve the FONC algorithm and propose three observer selection algorithms as follows.
Algorithm 3Define the positive edge matrixP,as shown in Fig.1(c).The elementsPi jin matrixPrepresent the number of positive edges on the shortest path from nodevito nodevj.The sum of elements in each row in the matrix represents the total number of positive edges from the node to other nodes.Based on the FONC strategy, when there are multiple nodes with the sameηvalue, we choose the node with more positive edges as the observer.The reason is that positive edges have stronger propagation capabilities, and paths with more positive edges are more likely to be the real propagation paths.
Algorithm 4By directly combining the effective distance with the FONC strategy,we no longer calculate theηvalue for each node directly.Instead, we incorporate the propagation probability of edges into the calculation ofηvalue and select observers based on the newly calculatedηvalue,thereby obtaining the optimal group of observers.To be specific, we simulate this strategy in Figs.1(d)–1(i).Figure 1(d)is the distance matrix corresponding to the network in Fig.1(a), and we calculate theηvalues of each node based on the effective distance of the network.If we selectv1as the observer node,thendv1,v2=1,so none of the first-order neighbors ofv2will be selected as observer nodes.Among them,v1,v3, andv4are all first-order neighbors ofv2.By using the effective distance matrixS,we obtain the propagation scoresS21,S23,andS24of all first-order neighbors ofv2, which sum to 0.9.The same calculations are performed for the remaining nodes,and we obtain aηvalue of 12.2 for nodev1.Nodesv6,v7,andv8have the highestηvalues, and we randomly selectv8as the observer node for the first step.We addv8to the set of observersOand delete elements in each column that are equal to the corresponding element in the eighth row of the distance matrix, see Fig.1(e).Then we calculate theηvalues of the nodes inV∖Ousing the remaining distance matrix and select a new observer node,repeating this process until all elements in the distance matrix are deleted.Figures 1(e)–1(i)show the remaining steps of selecting observer nodes.Finally,we obtain the set of observer nodesO={v8,v3,v2,v4,v5}.
2.4.Source localization method in signed networks based on maximum likelihood estimation
Based on the aforementioned algorithms, we can obtain the observer setO≜{ok}Kk=1⊂V,representing a set ofKobservers.Definetoas the absolute time moment when observer nodeoreceives information.We defineOto represent the observer and the receiving time,i.e.,O≜{(o,to)},for allo ∈O.
Accurately locating the source based on the observed node state is equivalent to identifying which node caused the observed data we obtained, making it a maximum likelihood estimation(MLE)problem.Sinces*is uniformly random over the networkG,the optimal estimator can be expressed as[22]wheredis the observed delay,μdenotes the deterministic delay, andΛrepresents the delay covariance.Intuitively, when selecting nodesas the source,μandΛrespectively represent the mean and covariance of the observed delayd(a random vector),calculated by the following two formulas:

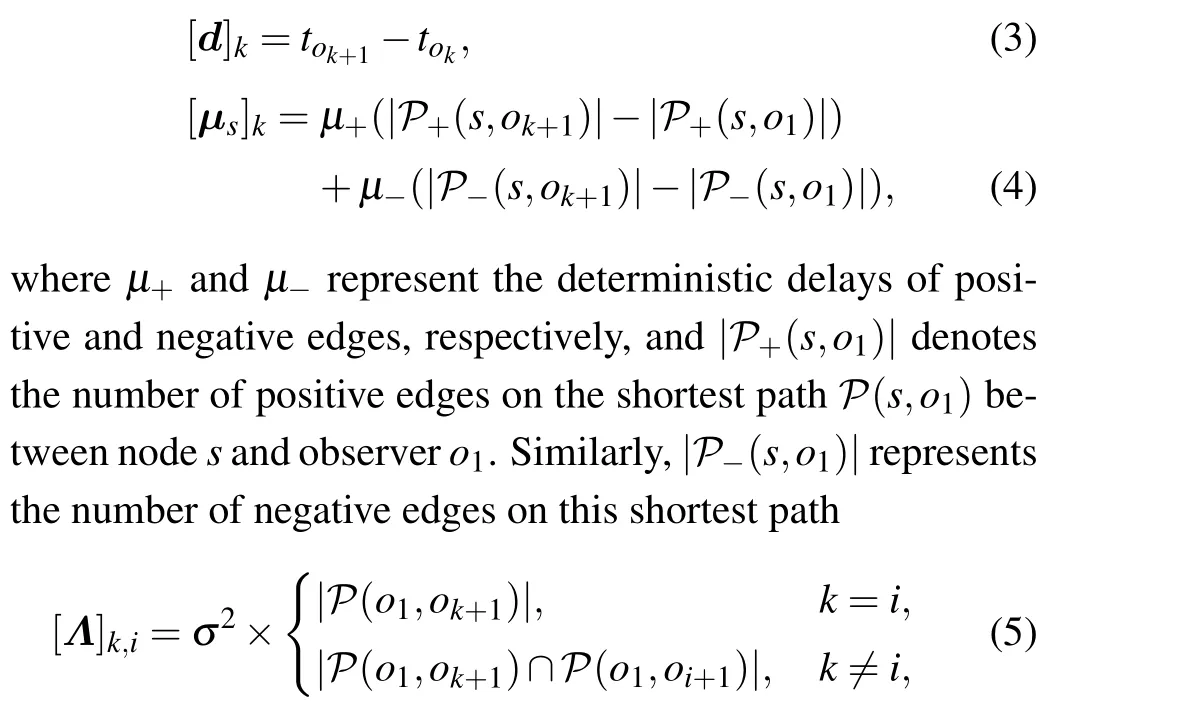
wherekandiare positive integers ranging from 1 toK-1.
3.Results
We verify the proposed method for the source localization with two synthetic networks, namely Erdös–R´enyi (ER)[51]and Barab´asi–Albert (BA)[52]networks.Based on the characteristics of signed networks, we assume that there is a difference in propagation delay between positive and negative edges.We do not consider the balance between positive and negative edges in the signed network.[53,54]
3.1.Relationship between observer ratio and network size
First, we investigate the impact of the selected observer rationOon our proposed strategies for different network sizes in both ER and BA networks.The observer rationOis defined as follows:
whereNOrepresents the number of selected observers,andNis the network size.
According to the analysis presented in Fig.2, Algorithms 2–4 require similar observer ratio for the same network size in both BA and ER networks.However, Algorithm 1 requires more observers.This discrepancy can be attributed to the fact that Algorithm 1 selects the node with the maximum total propagation score as an observer using the effective distance matrixS,and does not take into account the influence ofη,which necessitates a larger number of observers to cover the entire network.As depicted in Fig.2,as the network scale increases, although the number of observation nodes rises, the proportion of observation nodes decreases.Notably, Algorithm 1 requires more observers in BA networks compared to ER networks.Therefore, the network structure significantly impacts the selection of observers.

Fig.2.The relationship between the observer ratio nO under the four algorithms and the network size N in (a) BA networks and (b) ER networks.The network size values are N={100,200,500,1000,2000},respectively.The average degree〈k〉=10,positive edges account for 80%of the total edges in the network, the propagation probability of negative edges θ- =0.1, and the propagation probability of positive edges θ+=0.4.All the results are average of 200 independent simulations.
3.2.Relationship between observer proportion and average degree
Here,we further analyze the observer selection ratios for the four algorithms under different average degrees.From the data presented in Fig.3, it can be observed that Algorithm 1 selects a relatively larger percentage of observers,while Algorithms 2–4 roughly select observers within the range of 20%to 30%.In Fig.3(a), it can be seen that the observer ratios required by the four algorithms decrease as the network average degree increases.This phenomenon may be attributed to the fact that denser network structures lead to higher average degrees of observation nodes,enabling them to cover a wider range and monitor more information.It is worth noting that for ER networks,as shown in Fig.3(b),when the average degree〈k〉 is less than a certain value, such as 14, a lower number of observers suffices.However, as the average degree continues to increase, more observers are needed.This suggests that for relatively homogeneous networks,as the network becomes denser,it becomes challenging to distinguishηvalues for many nodes,making it difficult to reachη=0 and requiring more observer nodes.
3.3.Effects of proportion of observation nodes on source localization
To evaluate the performance of our source localization method, we use the area under receiver operating characteristic (AUROC) metric,[55,56]a standard measure from signal processing.The AUROC ranges from 0 to 1, where 1 indicates perfect source localization, i.e., the source can be completely distinguished from other nodes in the network.A random guess corresponds to an AUROC of 0.5.
First, we study the effect of different observer ratios on the accuracy of source localization in signed networks.Based on the experimental results shown in Fig.4, it can be observed that the overall accuracy of the four algorithms increases as the observer rationOincreases (except for Algorithm 1).In Fig.4(a), when the observer ratio exceeds 10%,Algorithm 1 outperforms other algorithms.Similarly, in the results in Fig.4(b),Algorithm 1 also demonstrates better performance of source localization in ER networks.When the observer rationOranges from 60%to 80%,the AUROC value of Algorithm 1 is around 0.9,indicating that the observers selected by Algorithm 1 can better locate the source.It should be noted that whennOexceeds a certain value, such as 80%,the AUROC unexpectedly decreases.This may be due to the increased likelihood of error estimation in the reverse propagation algorithm when there are more observation nodes.
3.4.Effects of average degree on source localization
In this section, we investigate the influence of different network average degrees on source localization in signed networks.From the observations depicted in Fig.5,Algorithm 1 demonstrates a high localization capability in both BA and ER networks under different average degrees.Although there appears to be a range, such as an average degree between 8 and 14, with relatively higher accuracy, it is not significantly outstanding.This suggests that the proposed method exhibits strong robustness to network structure.Furthermore,while the network average degree has a substantial impact on the proportion of observers,as shown in Fig.3(b),it has a relatively minor impact on source localization.
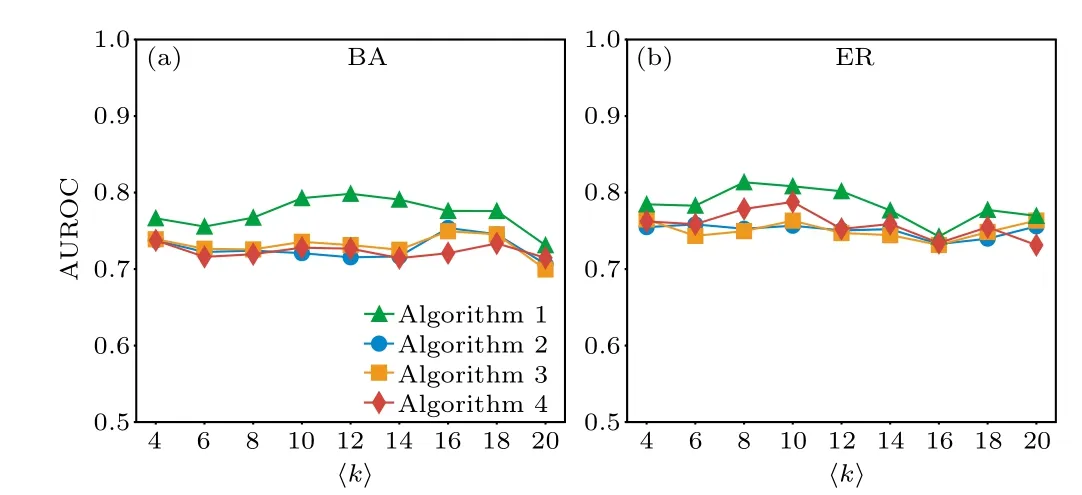
Fig.5.The relationship between the AUROC and different network average degrees〈k〉in BA networks(a)and ER networks(b).The network size is N =100 and the observer ratio is nO =20%.The positive edges account for 80%of the total edges in the network,the propagation probability of negative edges θ- =0.1, and the propagation probability of positive edges θ+ =0.4.All the results are average of 200 independent simulations.
3.5.Effects of propagation probability of positive and negative edges on source localization
The propagation probability of positive and negative edges in the signed network influences propagation dynamics,but its impact on source localization remains unclear.Therefore,we further investigate its effects on source localization in signed networks.
From Figs.6(a) and 6(b), it is evident that as the propagation probability of positive edges increases, the AUROC of all four algorithms exhibits an upward trend.Specifically,Algorithm 1 consistently achieves noticeably higher AUROC value compared to Algorithms 2–4, as observed in Fig.6(a).Similarly, in Fig.6(b), Algorithm 1 also demonstrates commendable localization capability in ER networks.This further illustrates the significant influence of the propagation capacities of positive and negative edges on source localization in signed networks.Additionally,we conclude that as the propagation probability of positive edges increases,the performance of source localization also improves.It is worth noting that in ER networks, as shown in Fig.6(b), whenθ+is relatively small,the AUROC of Algorithm 1 does not differ significantly from other three algorithms.This may be attributed to the shorter average path lengths in ER networks,resulting in relatively close distances between nodes.As Algorithm 1 selects observers through the effective distance matrixS,whenθ+is small, the shortest path values between nodes in the ER network do not differ significantly, leading to no significant improvement in source localization.
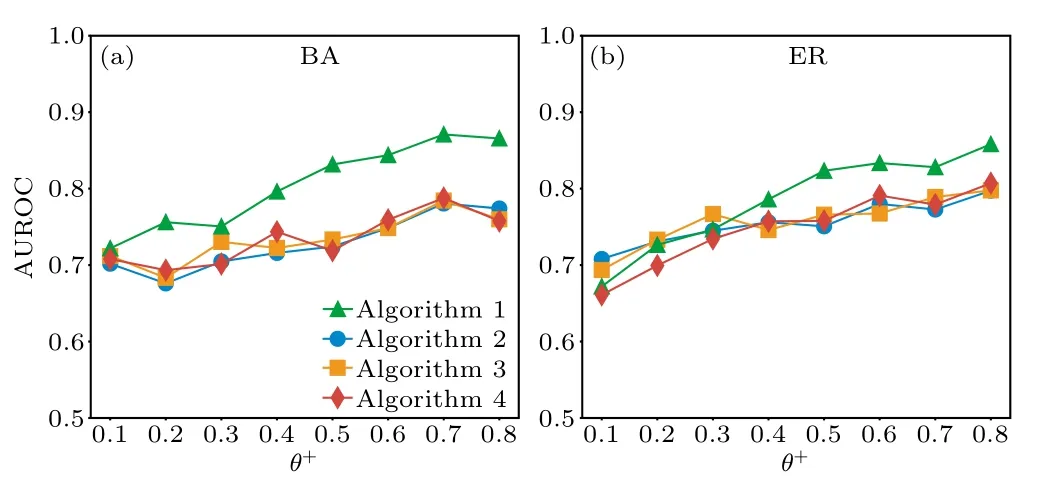
Fig.6.The relationship between the AUROC and the propagation probability of positive and negative edges in BA networks (a) and ER networks (b).The propagation probability of negative edges is θ- =0.1 and the propagation probability of positive edges is within the range θ+ ={0.1,0.2,0.3,0.4,0.5,0.6,0.7,0.8}.The network size is N =100,the average degree is〈k〉=10,the observer ratio is nO=20%,and positive edges account for 80% of the total edges in the network.All the results are average of 200 independent simulations.
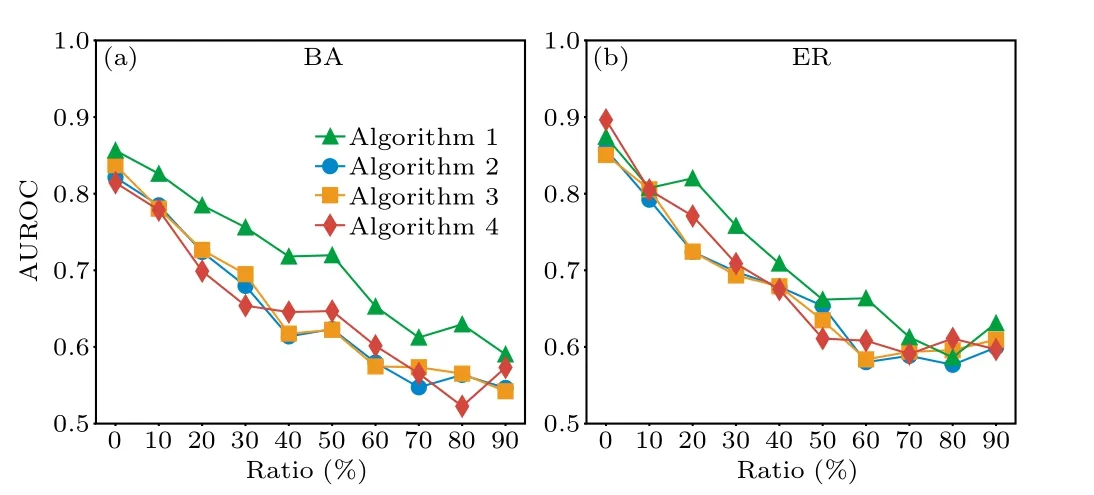
Fig.7.The relationship between the AUROC and the ratio of positive and negative edges in BA networks(a)and ER networks(b).The x-axis ratio represents the ratio of negative edges to the total number of edges in the network,ranging from 0 to 0.9.The network size is N=100,the average degree is〈k〉=10,the observer proportion is nO=20%,the propagation probability of negative edges is θ- =0.1, and the propagation probability of positive edges is θ+ =0.4.All the results are average of 200 independent simulations.
3.6.Effects of ratio of positive and negative edges on source localization
Furthermore, we investigate the influence of the ratio of positive and negative edges in signed networks on the source localization.As shown in Fig.7, we can find that as the ratio of negative edges increases, the AUROC of the four algorithms decreases.This indicates that a higher proportion of positive edges enhances the source localization performance of the algorithms.Therefore,we can conclude that these four algorithms are more suitable for signed networks with a higher proportion of positive edges.This finding aligns with real social networks, where individuals typically have more friends than enemies,contributing to better survival in society.
3.7.Effects of the location of source on source localization
Considering that the source at different locations may affect the accuracy of the source localization,we select the node with the largest degree,the node with the smallest degree,and the node with the largest betweenness centrality in the network as the propagation source,respectively,to further explore how the source at different locations affect the source localization.As can be seen from Fig.8, in BA and ER networks,Algorithm 1 shows good source localization when the source node is the node with the largest degree or the node with the largest betweenness centrality,but when the source node is the node with the smallest degree, the AUROC is lower.It indicates that the source on the periphery of the network is not easy to be located.
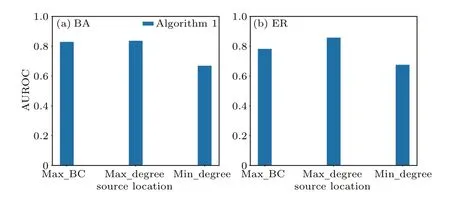
Fig.8.The relationship between the AUROC and the source at different location in BA networks(a)and ER networks(b).The network size is N =100, the observer proportion is nO =20%, the average degree is〈k〉=10, the propagation probability of negative edges is θ- =0.1,the propagation probability of positive edges is θ+=0.4,and the proportion of positive edges in the network is 80%.All the results are average of 200 independent simulations.
3.8.Robustness analysis—propagation probability
The previous results are obtained by using an average delay time ofµ+=θ+for each positive edge,and an average delay timeµ-=θ-for each negative edge.It actually contains a certain amount of noise,because the propagation delay and the propagation rate of the SI propagation model are different.Here, we assume that the information propagation delay follows a Gaussian distributionN(µ,σ2), where the meanµincorporatesµ+=θ+andµ-=θ-.We further increase the noise and study the effect of varianceσ2in Eq.(5)on source localization.
From the experimental results in Fig.9,it can be observed that Algorithm 1 consistently achieves the highest accuracy in source localization, which is consistent with the previous results.Overall, even with an increasingσ2, the change in the AUROC is not significant, demonstrating that the proposed source localization method exhibits strong robustness against propagation noise.

Fig.9.The relationship between the AUROC and the variance σ2 in BA networks (a) and ER networks (b).The network size is N =100,the observer proportion is nO=20%,the average degree is〈k〉=10,the propagation probability of negative edges is θ- =0.1, the propagation probability of positive edges is θ+ =0.4, and the proportion of positive edges in the network is 80%.All the results are average of 200 independent simulations.

Fig.10.The relationship between the AUROC and network size N.The values of N are{100,500},the observer proportion is nO=20%,the average degree is〈k〉=10,the propagation probability of negative edges is θ-=0.1,the propagation probability of positive edges is θ+=0.4,and the proportion of positive edges in the network is 80%.All the results are average of 200 independent simulations.
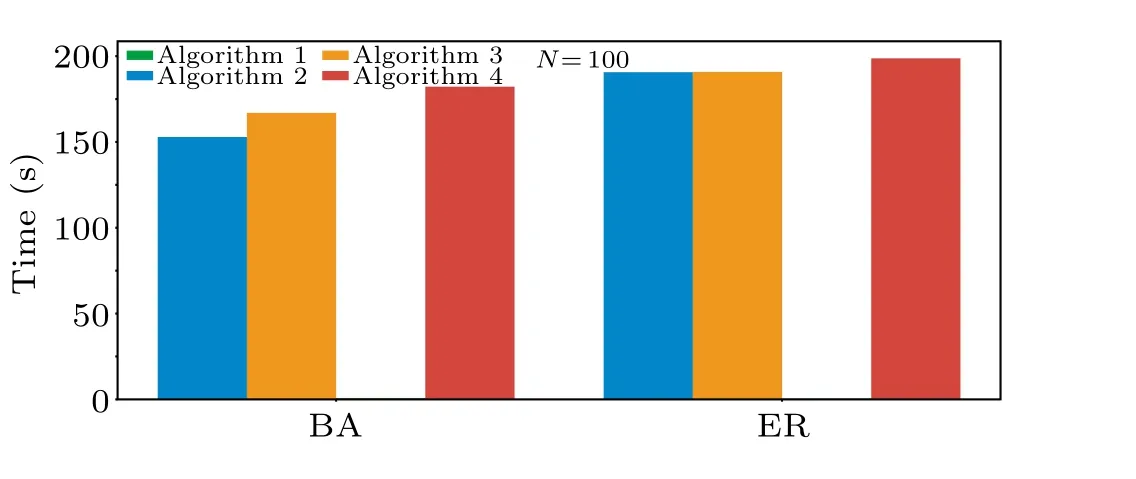
Fig.11.The running time of the four algorithms in BA and ER networks.The network size is N=100,the observer proportion is nO=20%,the average degree is〈k〉=10,the propagation probability of negative edges is θ-=0.1,the propagation probability of positive edges is θ+=0.4,and the proportion of positive edges in the network is 80%.All the results are average of 200 independent simulations.
3.9.Robustness analysis—network size
Additionally,we study the performance of the four algorithms for source localization with larger network sizes.As depicted in Fig.10, we can find that as the network size increases to 500, the source localization accuracy of the four algorithms remains almost unchanged.This suggests that the proposed algorithms have strong robustness and can be applied to source localization in large-scale networks.Among them,Algorithm 1 consistently achieves the best source localization results.
Finally,we analyze the operational efficiency of the four algorithms.Figure 11 shows the running time of the four algorithms in BA and ER networks.It is evident that Algorithm 1 requires significantly less time compared to other algorithms.This finding indicates that Algorithm 1 not only has more accurate source localization results but also has higher efficiency.
3.10.Error distance
In order to improve the credibility of the experimental results,we introduce error distance to evaluate the effectiveness of source localization.The error distance can be computed byds*,ˆs/〈d〉, whereds*,ˆsis the distance between real sources*and estimated source ˆs,〈d〉 is the average distance of the network.And further investigate the effects of different ratios of observers and different ratios of positive and negative edges on source localization.The experimental results are presented in Tables 1 and 2.

Table 1.The relationship between the error distance and different observer ratios nO in BA networks.
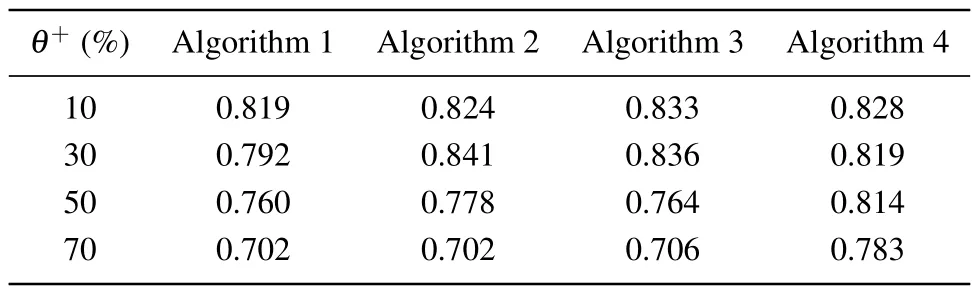
Table 2.The relationship between the error distance and the propagation probability of positive and negative edges in BA networks.The θ+represents the propagation probability of positive edges.
From Table 1, it can be observed that with different observer ratios,Algorithm 1 has a smaller error distance in most cases compared with other three algorithms.In Table 2, with the increase of positive edge propagation ability in the network,the error distance of Algorithm 1 decreases and outperforms other three algorithms, which further indicates that the stronger the positive edge propagation ability is,the more favorable the source localization is.By introducing the evaluation index of error distance,it further shows that our algorithm can find the source nodes accurately.
4.Discussion and conclusion
Accurately and efficiently identifying the source of information propagation is crucial in controlling the spread of harmful content.Many studies have revealed differences in information propagation in signed networks compared to traditional networks.However, the influence of signed network structure, as well as the proportion and propagation probability of positive and negative edges, on source localization remains unclear.In this study, we propose a new optimization strategy with effective distance for observer selection and develop a method for source localization in signed network models using reverse propagation compared with three observer selection methods based on FONC, experimental results demonstrate the overwhelming advantage of observer selection method with effective distance.Interestingly, we find that source localization accuracy increases with an increase in the number of positive edges in the signed network and with an increase in the ratio of positive edge propagation rate to negative edge propagation rate,which seemingly confirms the importance of cooperation.Furthermore, we observe that the average degree of the network has little impact on source localization accuracy.In addition, we find that the source located at the periphery of the network is not favorable for source localization.Moreover,our method exhibits robust source localization accuracy even in the presence of higher levels of noise,indicating its suitability for signed networks.The observer selection method with effective distance not only achieves high accuracy in source localization but also demonstrates superior efficiency.
The observer selection method with effective distance is highly recommended for source localization in signed networks due to its high accuracy, efficiency, and robustness.However,there are several avenues for future research.Firstly,the extension of the single-source problem to a multi-source problem in signed networks requires further investigation.Secondly, considering the impact of changing edge relationships over time, it is important to generalize the signed network source localization problem from static networks to dynamic networks.[57–60]Thirdly, exploring source localization in multi-layer networks by incorporating signed networks opens up new possibilities for research and analysis.[61–63]In this paper, we consider a simple signed network and do not consider the balance of the signed network.However,our hypothesis is feasible to a certain extent, because the enemy of our enemy is not necessarily our enemy,and the friend of our friend is not necessarily our friend.In the future research,we will further study and reveal whether there are new discoveries in the structure of balanced singed networks.
Acknowledgments
Project supported by the National Natural Science Foundation of China (Grant Nos.62103375 and 62006106), the Zhejiang Provincial Philosophy and Social Science Planning Project (Grant No.22NDJC009Z), the Education Ministry Humanities and Social Science Foundation of China(Grant Nos.19YJCZH056 and 21YJC630120), and the Natural Science Foundation of Zhejiang Province of China(Grant Nos.LY23F030003 and LQ21F020005).

- Chinese Physics B的其它文章
- Unconventional photon blockade in the two-photon Jaynes–Cummings model with two-frequency cavity drivings and atom driving
- Effective dynamics for a spin-1/2 particle constrained to a curved layer with inhomogeneous thickness
- Genuine entanglement under squeezed generalized amplitude damping channels with memory
- Quantum algorithm for minimum dominating set problem with circuit design
- Protected simultaneous quantum remote state preparation scheme by weak and reversal measurements in noisy environments
- Gray code based gradient-free optimization algorithm for parameterized quantum circuit