
Dynamic mechanical characteristics of deep Jinping marble in complex stress environments
2024-02-29 14:50ChniLouHpingXiRuZhangHaiRnHaoLuoKunXiaoYuanPngQiangTanLiRn
Chni Lou ,Hping Xi ,Ru Zhang ,Hai Rn ,Hao Luo ,Kun Xiao ,Yuan Png,Qiang Tan,Li Rn
a Institute for Disaster Management and Reconstruction,Sichuan University,Chengdu,610207,China
b College of Water Resource &Hydropower,Sichuan University,Chengdu,610065,China
c MOE Key Laboratory of Deep Earth Science &Engineering,Sichuan University,Chengdu,610065,China
d Yalong River Hydropower Development Company,Ltd.,Chengdu,610051,China
e(Chongqing) International Engineering Technology Company,Ltd.,Chongqing,401121,China
Keywords:Rock mechanics Split-Hopkinson pressure bar Coupled static-dynamic loading Different depths Holmquist-Johnson-Cook (HJC) model
ABSTRACT To reveal the dynamic mechanical characteristics of deep rocks,a series of impact tests under triaxial static stress states corresponding to depths of 300-2400 m were conducted.The results showed that both the strain rates and the stress environments in depth significantly affect the mechanical characteristics of rocks.The sensitivity of strain rate to the dynamic strength and deformation modulus shows a negative correlation with depth,indicating that producing penetrative cracks in deep environments is more difficult when damage occurs.The dynamic strength shows a tendency to decrease and then increase slightly,but decreases sharply finally.Transmissivity demonstrates a similar trend as that of strength,whereas reflectivity indicates the opposite trend.Furthermore,two critical depths with high dynamically induced hazard possibilities based on the China Jinping Underground Laboratory (CJPL)were proposed for deep engineering.The first critical depth is 600-900 m,beyond which the sensitivity of rock dynamic characteristics to the strain rate and restraint of circumferential stress decrease,causing instability of surrounding rocks under axial stress condition.The second one lies at 1500-1800 m,where the wave impedance and dynamic strength of deep surrounding rocks drop sharply,and the dissipation energy presents a negative value.It suggests that the dynamic instability of deep surrounding rocks can be divided into dynamic load dominant and dynamic load induced types,depending on the second critical depth.
1.Introduction
Space utilization and resources mining have reached depths over 1000 m across the world.For example,some underground chambers in major hydropower projects exceed 2000 m(Wu et al.,2010),and depth of resources mining has even reached 4000 m(Lippmann-Pipke et al.,2011).With increasing exploitation depths,disasters occur frequently,which brings challenges to the construction and operation of underground projects (Li et al.,2017).Thus,it is critical to reveal the correlation between rock depth and possibility of dynamic disaster occurrence.
The differences in deformation process,strength characteristics,and failure mode are the primarily indicators of rocks at depths,which are significantly influenced by external factors (e.g.temperature and in situ stress) and internal factors (e.g.crystal microstructure) (Zhang et al.,2018;Xie et al.,2021;Du et al.,2022b).Previous studies indicate that the linear failure criterion is generally valid for shallow rocks,but not appropriate for deep rocks(Hoek and Brown,1980;Wang et al.,2016;Zhang et al.,2023).Deep rocks are generally characterized with high in situ stress and considerable energy,rendering them highly susceptible to instability subjected to slight disturbances arising from drilling or blasting activities.Such disturbances typically result in release and transfer of part of the stored energy,and then failure can exhibit complexity and suddenness (Xie et al.,2019).The concept of“Three-dimensional (3D) static stress+dynamic disturbance stress”is the stress state simplification for deep surrounding rocks(Li et al.,2008).For instance,during the construction of Jinping II Hydropower Station,multiple rockbursts occurred in the auxiliary tunnel,with strong rockbursts classified as levels III and IV at depths greater than 1500 m (Wang et al.,2012).
Engineering disturbances commonly generate stress waves with high amplitudes (101-103s-1),which continuously affects the surrounding rocks and deep strata.Rocks typically suffer from a medium-high strain rate,and thus it is likely that the split Hopkinson pressure bar (SHPB) system is feasible (Zhang and Zhao,2014).Given the stress environment of deep rocks,the SHPB system has been improved significantly to accommodate axial and radial loads (Christensen et al.,1972;Li et al.,2008).The results indicated that under a static-dynamic coupling load,rocks are capable of bearing higher loads than that under static loads.Moreover,with the same strain rate range,rock strength increases as the axial compression ratio rises,but it drops sharply when the axial static loading exceeds 70%of its static strength(Li et al.,2005,2009).Under triaxial static-dynamic coupling loads,the axial pressure induces internal cracks and reduces the bearing capacity and secant modulus.Whilst,the confining pressure inhibits the fracture deformation and enhances the bearing capacity.Compression shear failure is the only failure form of rock caused by confining pressure,with the main failure mode presented as conical (Yin et al.,2012;Peng et al.,2019).Stress intensity factor(SIF) depends on heterogeneity,static stress,and strain rate;however,it may significantly decrease before the axial load reaches its static strength(Zhu et al.,2012).Considering the entire process from excavation to unloading,Gong et al.(2022) found that prestressed rocks suffer a higher strain rate caused by unloading process and are more prone to failure at similar incident energies.After excavation disturbance and stress adjustment,the surrounding rocks could reach a new stress balance.Therefore,it is imperative to figure out the dynamic mechanical behavior of deep rocks in this state.
The dynamic characteristics of deep rocks require consideration of high initial static loads;however,such loads are challenging in the SHPB system.Numerical simulation can effectively fix the shortcomings of laboratory tests,even on a large-scale engineering project (Hu et al.,2023):
(1) Equipment components,such as bullet shape,bar material and pulse shaper,can be optimized numerically(Zhou et al.,2011),and
(2) Rock deformation and stress wave propagation can be observed (Lv et al.,2018;Wang et al.,2021).
Based on experiments and numerical simulations,it shows that tensile cracks,as described by the evolution of microfractures,would play an essential role in controlling the ultimate failure mode,and stress equilibrium would also maintain for a specific time period after peaks(Zhou et al.,2017).The dynamic strength of hydrostatic pressurized rock specimens increased with strain rate,while the rate sensitivity of rock strength decreased as hydrostatic confinement increases(Du et al.,2018).Lateral inertia confinement and heterogeneity were found to be critical factors causing strain rate effect in rocks(Li et al.,2014).With respect to classical dynamic constitutive models,the Holmquist-Johnson-Cook (HJC) model represented a reasonable compromise for simulating material dynamic damage under high strain rates,large strains and high pressure(Liu et al.,2020).Zhang et al.(2016a)and Tang et al.(2020)performed SHPB simulations of passive and active confinements to understand the temperature and strain rate effects on frozen soil.Zhao et al.(2020) numerically analyzed the rockburst caused by crack evolution,simulating the scenarios of the pre-and postfailure dynamical behaviors.Unfortunately,the above results were almost obtained by taking the original rock stress(σ=γh)as the stress state for the surrounding rocks.It does not account for the natural stress state after excavation,resulting in inapplicability of existing theory for practical purpose.
For this,we tried to explore the dynamic catastrophes of rocks under varying stress environments during engineering service period.Then,a series of impact compression tests under different prestresses (corresponding to the depths of 300-1400 m) were conducted.Additionally,a set of HJC model parameters suitable for high-strength brittle rock was calibrated and a series of impact compression simulations (corresponding to depths of 300-2400 m) were conducted.The variations of bearing capacity,deformation process and energy evolution of rock with depths were revealed,which would provide a scientific guidance for safety and stability analyses of deep engineering.
2.Dynamic damage characteristics of Jinping marble at depths
2.1.Experiments
2.1.1.Material and specimens
China Jinping Underground Laboratory (CJPL) is the deepest underground laboratory in the world at present.It is located 2400 m beneath the surface of Jinping Mountain in Liangshan Yi Autonomous Prefecture,Sichuan Province,China.Fig.1a illustrates the geological section of Jinping Mountain,of which 80% of the tunnel line is hosted in marble formation.The marble of the Triassic Baishan Formation T2b used in this experiment is sampled at a depth of 2400 m(see Fig.1b).The rock mass is thick,complete and fresh.Due to self-weight and tectonic action,the surrounding rocks have been subjected to long-term high in situ stresses.During project operation,there are still some accidents of dynamic damage to the surrounding rocks,and the frequency of dynamic accidents increases significantly with depth.

Fig.1.Drilling and production: (a) Geological profile of Jinping Mountain (Ma et al.,2015),(b) marble cores,and (c) marble specimens (part).
The analysis results of X-ray diffraction (XRD) indicate that Jinping marble is predominantly composed of dolomite(CaMg(CO3)2,85%)and calcite(CaCO3,14%),with a minor amount of quartz(SiO2,<1%)detected in the deeper core of the borehole.The average density is 2820 kg/m3,and the standard static uniaxial compressive strength and uniaxial tensile strength have been measured to be 180.65 MPa and 7.43 MPa,respectively.The elastic modulus and Poisson’s ratio are 68.42 GPa and 0.28,respectively.According to the effects observed in SHPB tests and specimen size range recommended by International Society for Rock Mechanics and Rock Engineering(ISRM)(Dai et al.,2010;Zhou et al.,2012),it is appropriate to process cores collected from the same borehole,into 82 cylindrical specimens with dimensions of φ50 mm × 40 mm.The rocks exhibit high geometrical integrity and petrographic uniformity.Both ends of each specimen were also carefully polished.Specifically,these specimens were selected as their longitudinal wave velocities fell within the range of 4500-5000 m/s,as shown in Fig.1c.
2.1.2.Procedures
The excavation process of deep caverns can lead to large deformation and stress redistribution of surrounding rocks,while the rock mass in front of the working face(hardening zone)of the cavern remains unchanged in its initial spatial position.The stress evolution process of this area can be divided into three stages: in situ stress stage,excavation disturbance stage,and stress stability stage (Zhang et al.,2016 b;Zha et al.,2021),as shown in Fig.2.When the chamber is formed,the hardening zone becomes the primary load-bearing part that plays a crucial role in the long-term stability of deep cavern.Then,the representative pointA(r,θ)within the hardening zone ahead of the excavation working face is selected as the research object,whereris the radial distance from the center of the cavity and θ is the angle in the polar coordinate calculated from the horizontal axis.When entering the stress stability stage (Point 4),the surrounding rocks rebound and undergo stress redistribution,resulting in a maximum principal stress decrease at pointA.For circular caverns,the initial stress state can be calculated by (Zha et al.,2021):

Fig.2.Schematic of the stress change during excavation disturbance (Zhang et al.,2016b;Zha et al.,2021).
where σr,σθand τrθrepresent the current radial stress,tangential stress and shear stress,respectively;pvandphare the vertical and horizontal stresses,respectively;andr0is the cavern radius.
After cavern excavation and formation,stress concentration around the boundary depends mainly on the cavern contour.Therefore,the tangential stress concentration and radial stress unloading coefficient of deep surrounding rocks can be defined as αshapeand βshape,respectively.For general in situ stress conditions,Eq.(1) can be simplified as
(1) Horizontal direction
(2) Vertical direction
where λ is the lateral pressure coefficient (horizontal to vertical stress ratio),and γ is the overlying strata bulk density.
The peak stress concentration usually appears underneath the cavern contour,that is,r≈r0.The above equations can be further simplified as σθ=(3-λ)γHin horizontal direction,σθ=(3λ-1)γHin vertical direction,and σr=0.For deep engineering,it is found that the lateral pressure coefficient λ is in the range of 0.8-1.5,and the horizontal stress is commonly dominant in deep caverns (Yu et al.,2022).Therefore,αshape=3λ-1 represents this state.
After excavation,the stress state rapidly adjusts to a relatively stable state of the surrounding rocks,and the peak stress adjusts accordingly.The position of the maximum value can be determined asr0/r=by the strain nonlinear softening constitutive relationship,and αshapeand βshapecan be expressed by
For laboratory tests,the value of αshapeand βshapeshould be considered as the most unfavorable combination,and the first and third principal stresses (σ1and σ3) of weak points on the surrounding rock wall after formation of a circular tunnel chamber are written as follows:
Eq.(5)serves as a means of measuring the occurrence stress of rocks in long-term engineering service conditions.Based on the geological conditions(Wu et al.,2010;Stephansson and Zang,2012)and in situ stresses of the Jinping Hydropower Station (Ma et al.,2015),the average bulk density of the overlying strata is 26.5 kN/m3,and the lateral pressure coefficient is 1.2.Then,the prestatic loading conditions of deep surrounding rocks at different depths can be calculated,as listed in Table 1.

Table 1Prestatic loading conditions corresponding to different depths at Point 4.
Fig.3 illustrates the modified triaxial SHPB system(Gong et al.,2019).This system enables the coupling of a 100 MPa axial static load and a 20 MPa radial static load,corresponding to a maximum depth of 1400 m.The density of the waveguide bar is 7820 kg/m3,the elastic modulus is 233 GPa,and the Poisson’s ratio is 0.28.The incident and transmitted bars have lengths of 2.0 m and 1.5 m,respectively,with a diameter of 50 mm.A spindle-shaped striker is employed to generate a half-sine stress wave,which minimizes wave oscillation and dispersion effect (Li et al.,2000).During experiments,the strain gauges were attached to the middle of the waveguide bars to record the stress waves,and different triaxial static loads were applied and maintained before subjecting the rock specimens to varying strain rates (101-102s-1) at impact gas pressures of 0.7-2 MPa.
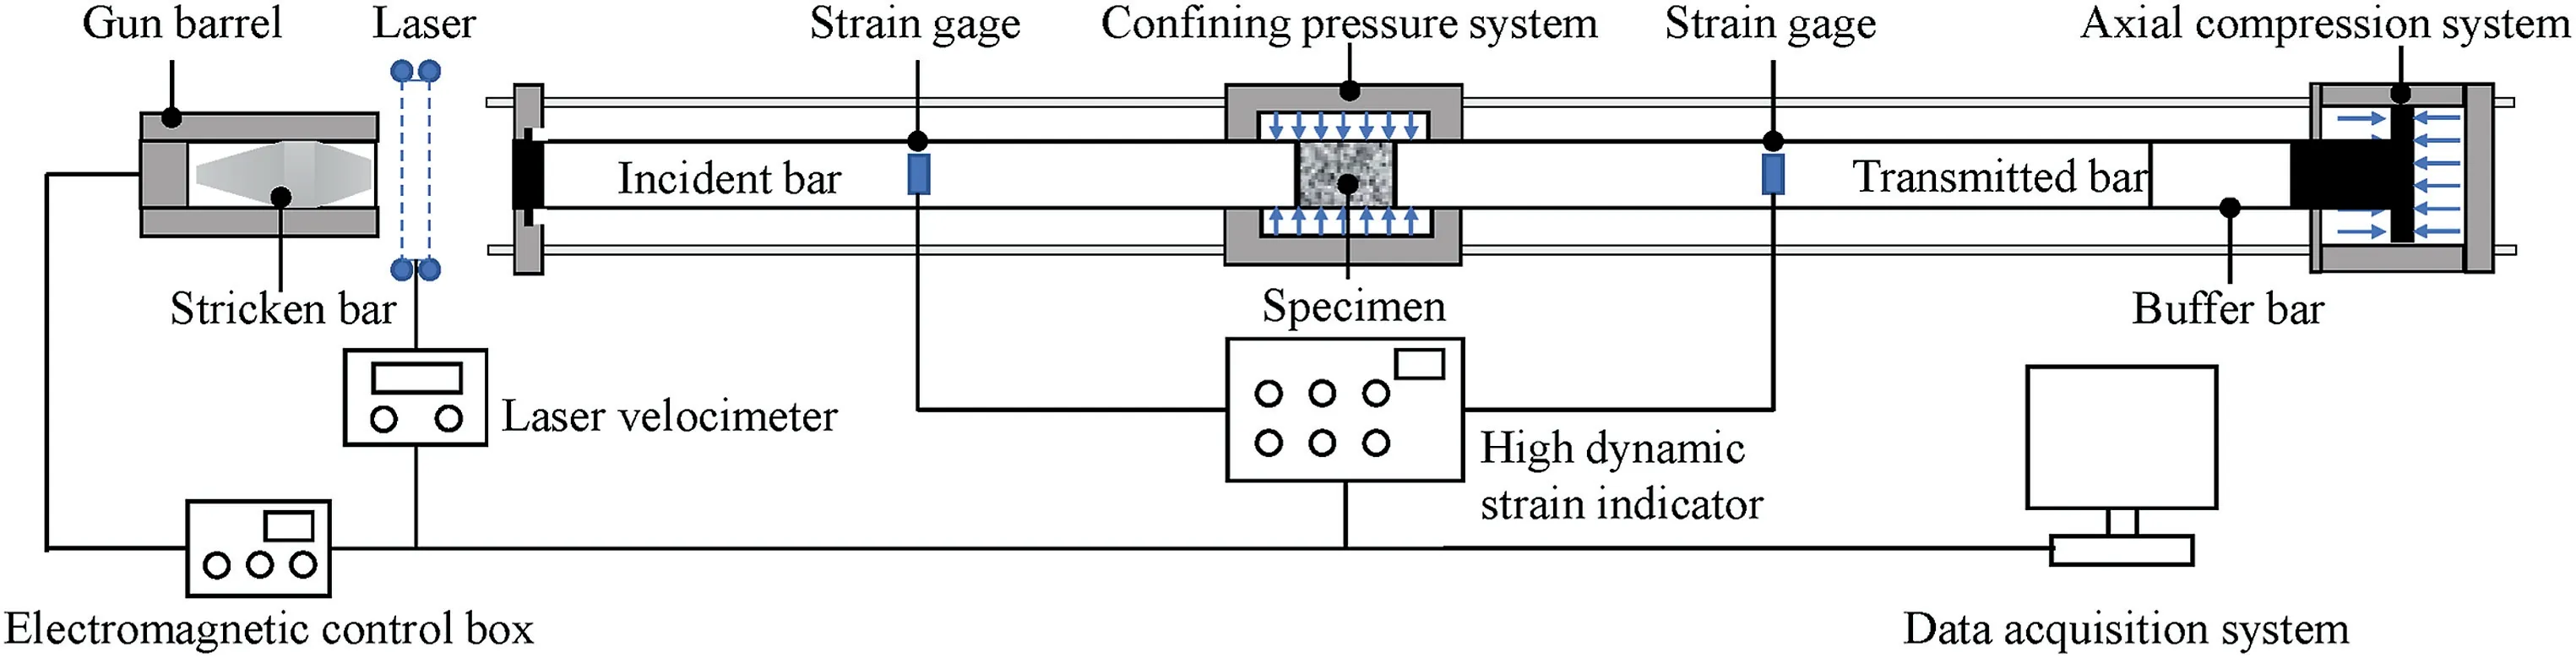
Fig.3.Modified triaxial SHPB system (after Gong et al.,2019).
Stress waves,satisfying the one-dimensional stress wave theory,are analyzed based on the two-wave method,as follows (Xia and Yao 2015):
whereE0is the elastic modulus of the bar;A0andAsare the crosssectional areas of the rock specimen and bar,respectively;C0andlsare the stress wave velocity and length of the bar;and εI,εR,and εTare strain signals of the incident,reflected and transmitted waves,respectively.
The strain gauge on the incident bar captures the voltage signals of both incident and reflected waves,while the strain gauge on the transmitted bar solely captures those of the transmitted wave.Utilizing the aforementioned formulas,the captured waveform can be transformed as plotted in Fig.4.Notably,the stress-time curve of the stress between the rock specimen and the contact surface of the incident bar (curve In.+Re.) is calculated via the superposition of the incident and reflected waves.Meanwhile,the stress-time curve of the stress between the rock specimen and contact surface of the transmitted bar (curve Tr.) is estimated solely through the transmitted wave.
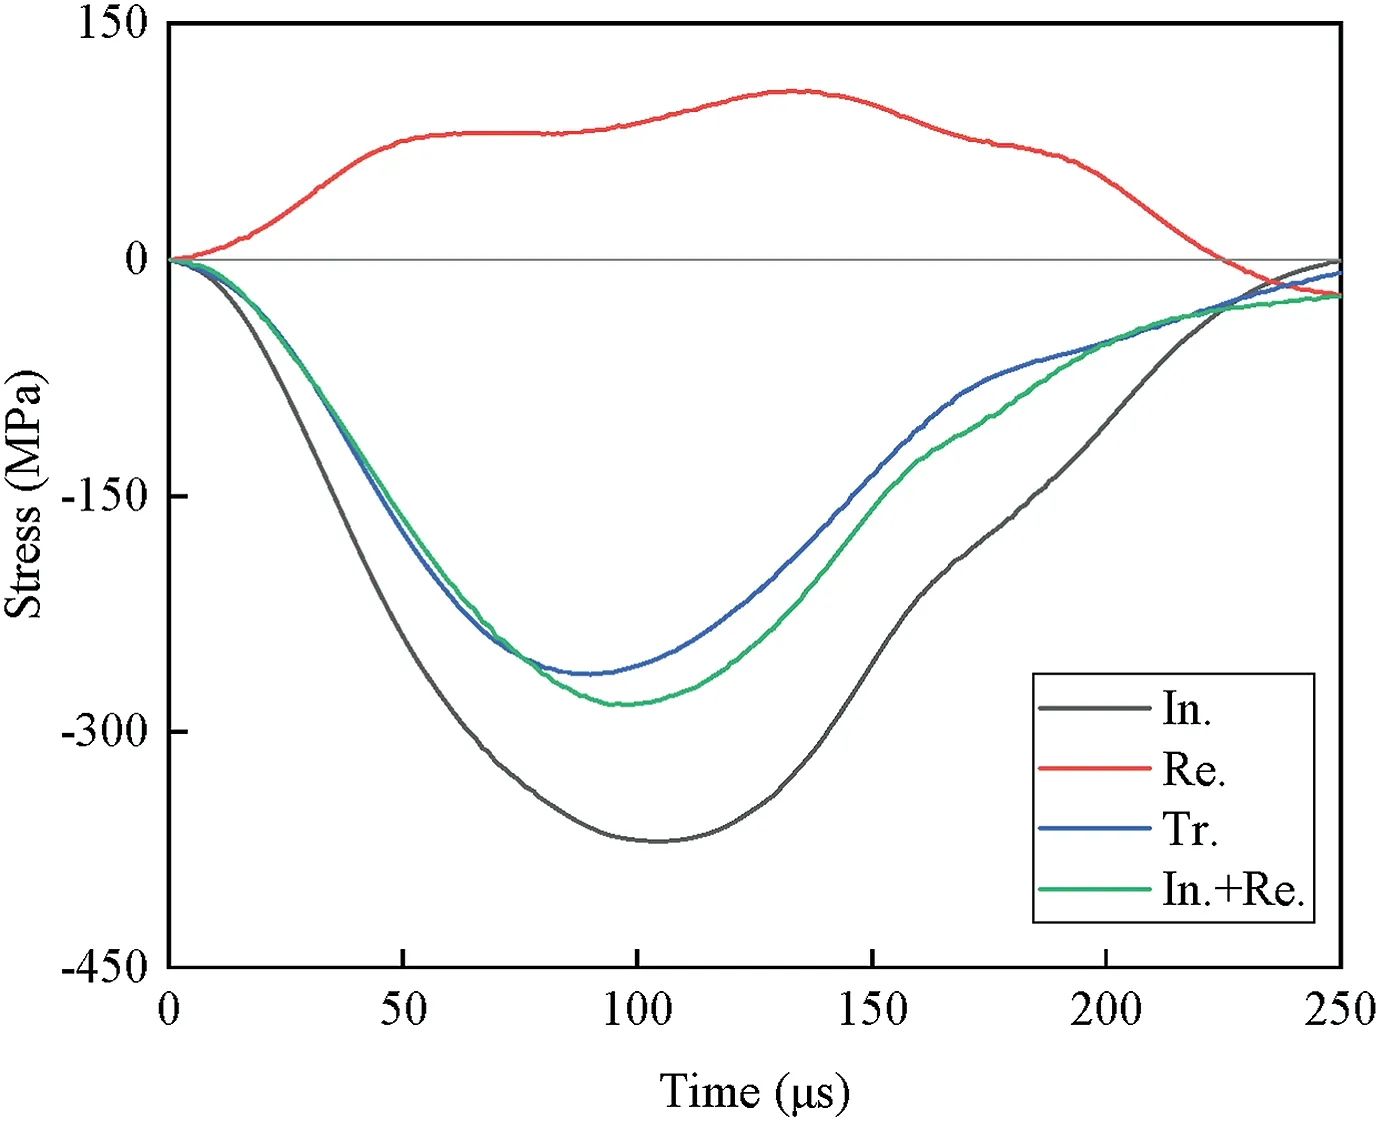
Fig.4.Fitted curves of the loading stress wave.
2.2.Stress-strain characteristics of marble at different depths
Fig.5 illustrates the dynamic stress-strain curves of marble in five different stress environments.The entire stress-strain curve is shown in Fig.5f,which can be divided into five typical stages:nearelastic section (segmentOA),nonlinear section (segmentAB),transitory section(segmentBC),unloading section(segmentCDorCF) and rebound section (segmentDE).

Fig.5.Stress-strain curves of marbles in different stress environments: (a) 300 m,(b) 600 m,(c) 900 m,(d) 1200 m,(e) 1400 m,and (f) typical curve.
At low strain rates,the stress-strain curve exhibits a marked rebound at the post-peak stage (stage V),resulting from elastic energy release after reaching the peak.Specimens exposed to such conditions maintain a certain bearing capacity after impact loading and undergo a “closed” impact failure.However,there is no rebound stage after the peak at high strain rates as rock damage exacerbates under impact load,leading to irreversible deformation and significant loss of bearing capacity.The stress-strain curve shows an “open” impact failure under such circumstances.
2.3.Dynamic deformation at different depths
Under triaxial stress environment,microdefects inside the rock are compressed to varying degrees,enabling the elastic phase to be regarded as the beginning of its stress-strain curve,and gradually approaching the plastic deformation phase once the dynamic strength reaches half of its ultimate value.Therefore,the average deformation modulus that comprehensively considers both the elastic and plastic deformation stages is selected to measure the deformation ability of the rock:
whereEdis the average deformation modulus;E1andE2are the first and second secant modulus,respectively;E3is the deformation modulus of the loading section,which is calculated as the slope of the tangent line at the point σd50;σdis the peak stress;σd50is 50%of the dynamic peak stress;εdis the peak strain;and εd50is the strain at the σd50point (Tang et al.,2018).
Fig.6a and b shows the fitting results of the deformation modulus and peak strain,respectively.The trends observed are relatively straightforward,yet their behaviors are different.Specifically,the deformation modulus and the peak strain demonstrate lesser depth sensitivity at the same strain rates.However,when considering the same stress environment,the deformation modulus exhibits a near-linear decrease with increasing strain rate,whereas the peak strain shows an opposite upward trend.

Fig.6.Variation in deformation parameters: (a) Deformation modulus,(b) peak strain,(c) relationship between modulus and depth at different strain rates,and (d) relationship between peak strain and strain rate at different depths.
Fig.6c shows the relationship between the deformation modulus and depth at strain rates of 70-90 s-1,100-120 s-1,and 140-160 s-1.The deformation modulus declines with depth at the same strain rate,indicating that marble subjected to an external disturbance at depth is more prone to generating significant deformation before failure,which matches with the scenario of large deformation before the instability of deep high-stress caverns.In the same stress environment,the higher the strain rate,the smaller the deformation modulus,as an intense impact load induces significant axial deformation of the rock,resulting in a small deformation modulus of the stress-strain curve.
Fig.6d shows the peak strain variation of marble.The peak strain is not significantly affected by the stress environment but positively correlates with the strain rate,indicating that the peak strain is primarily controlled by the dynamic load.Therefore,controlling the dynamic load and excavation rate during mining is essential to prevent large deformation of surrounding rocks under dynamic loads.
Rock in different stress environments in depth typically experiences varying deformations under dynamic loads,as shown in Fig.7.At a relatively shallow depth,compression-shear stress damages the rock,creating axial cracks that penetrate both ends of the specimen.A fractured ring belt around the main rock body presents a conical shape after stripping fragments,particularly at a depth of 600 m.As the depth increases,the binding effect of static load intensifies,and the degree of local axial crack extensions in rock decreases.At a depth of 1400 m,the rock does not exhibit macroscopic failure,and cracks only extend inwards for a short distance on the surface.
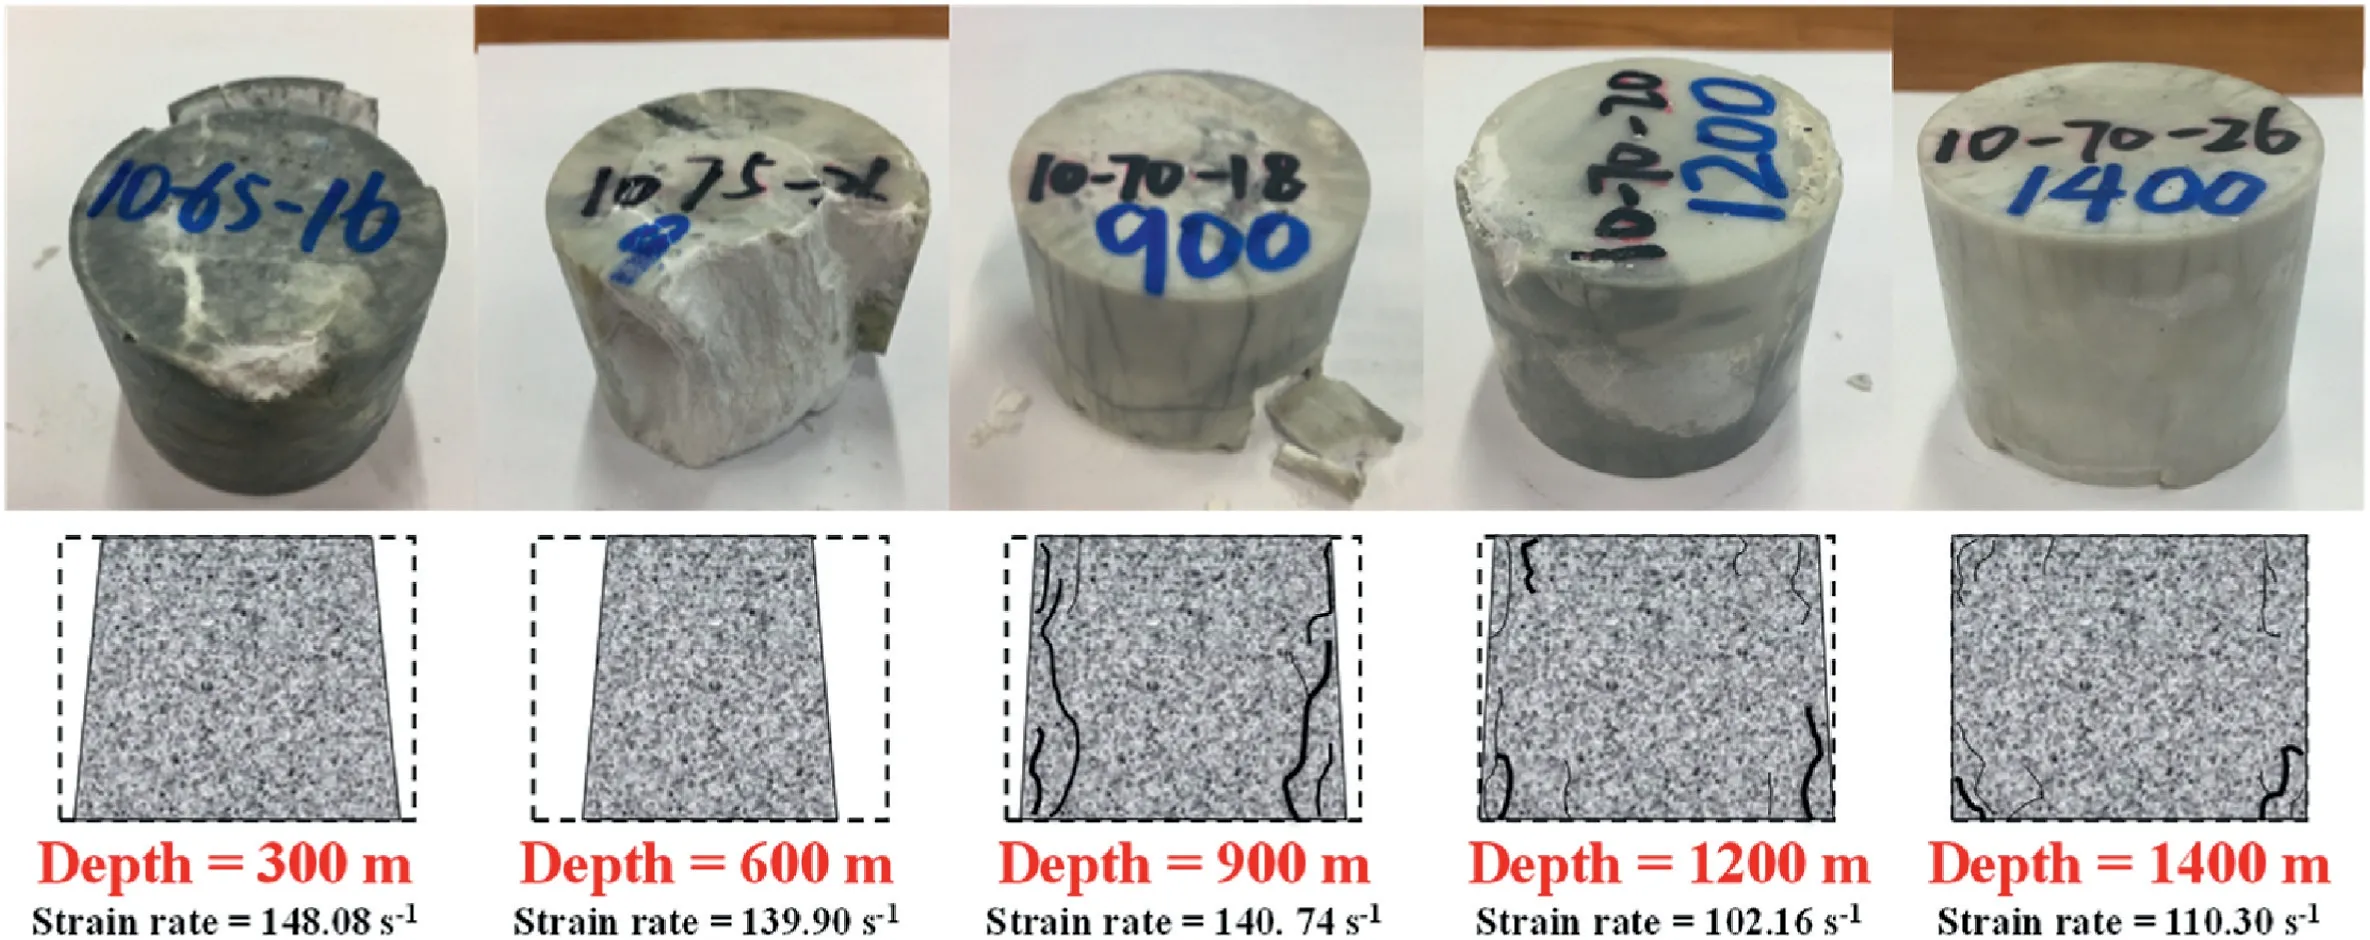
Fig.7.Typical failure modes at different stress environments.
2.4.Bearing capacity at different depths
Fig.8a shows the fitting results of the peak strength,indicating that there is a minimum peak strength under the conditions of shallow depth (<900 m) and low strain rate (<70 s-1).The peak strengths are observed at large depth (>1200 m) and high strain rate (>100 s-1),followed by a gradual decline upon reducing both depth and strain rate.Additionally,the dynamic strength has a positive correlation with depth at strain rates from 20 s-1to 160 s-1.As the strain rate increases,the dynamic load generates more microcracks and stronger macrocrack interactions are observed,leading to an increase in bearing capacity due to the consumption of external work for rock deformation.
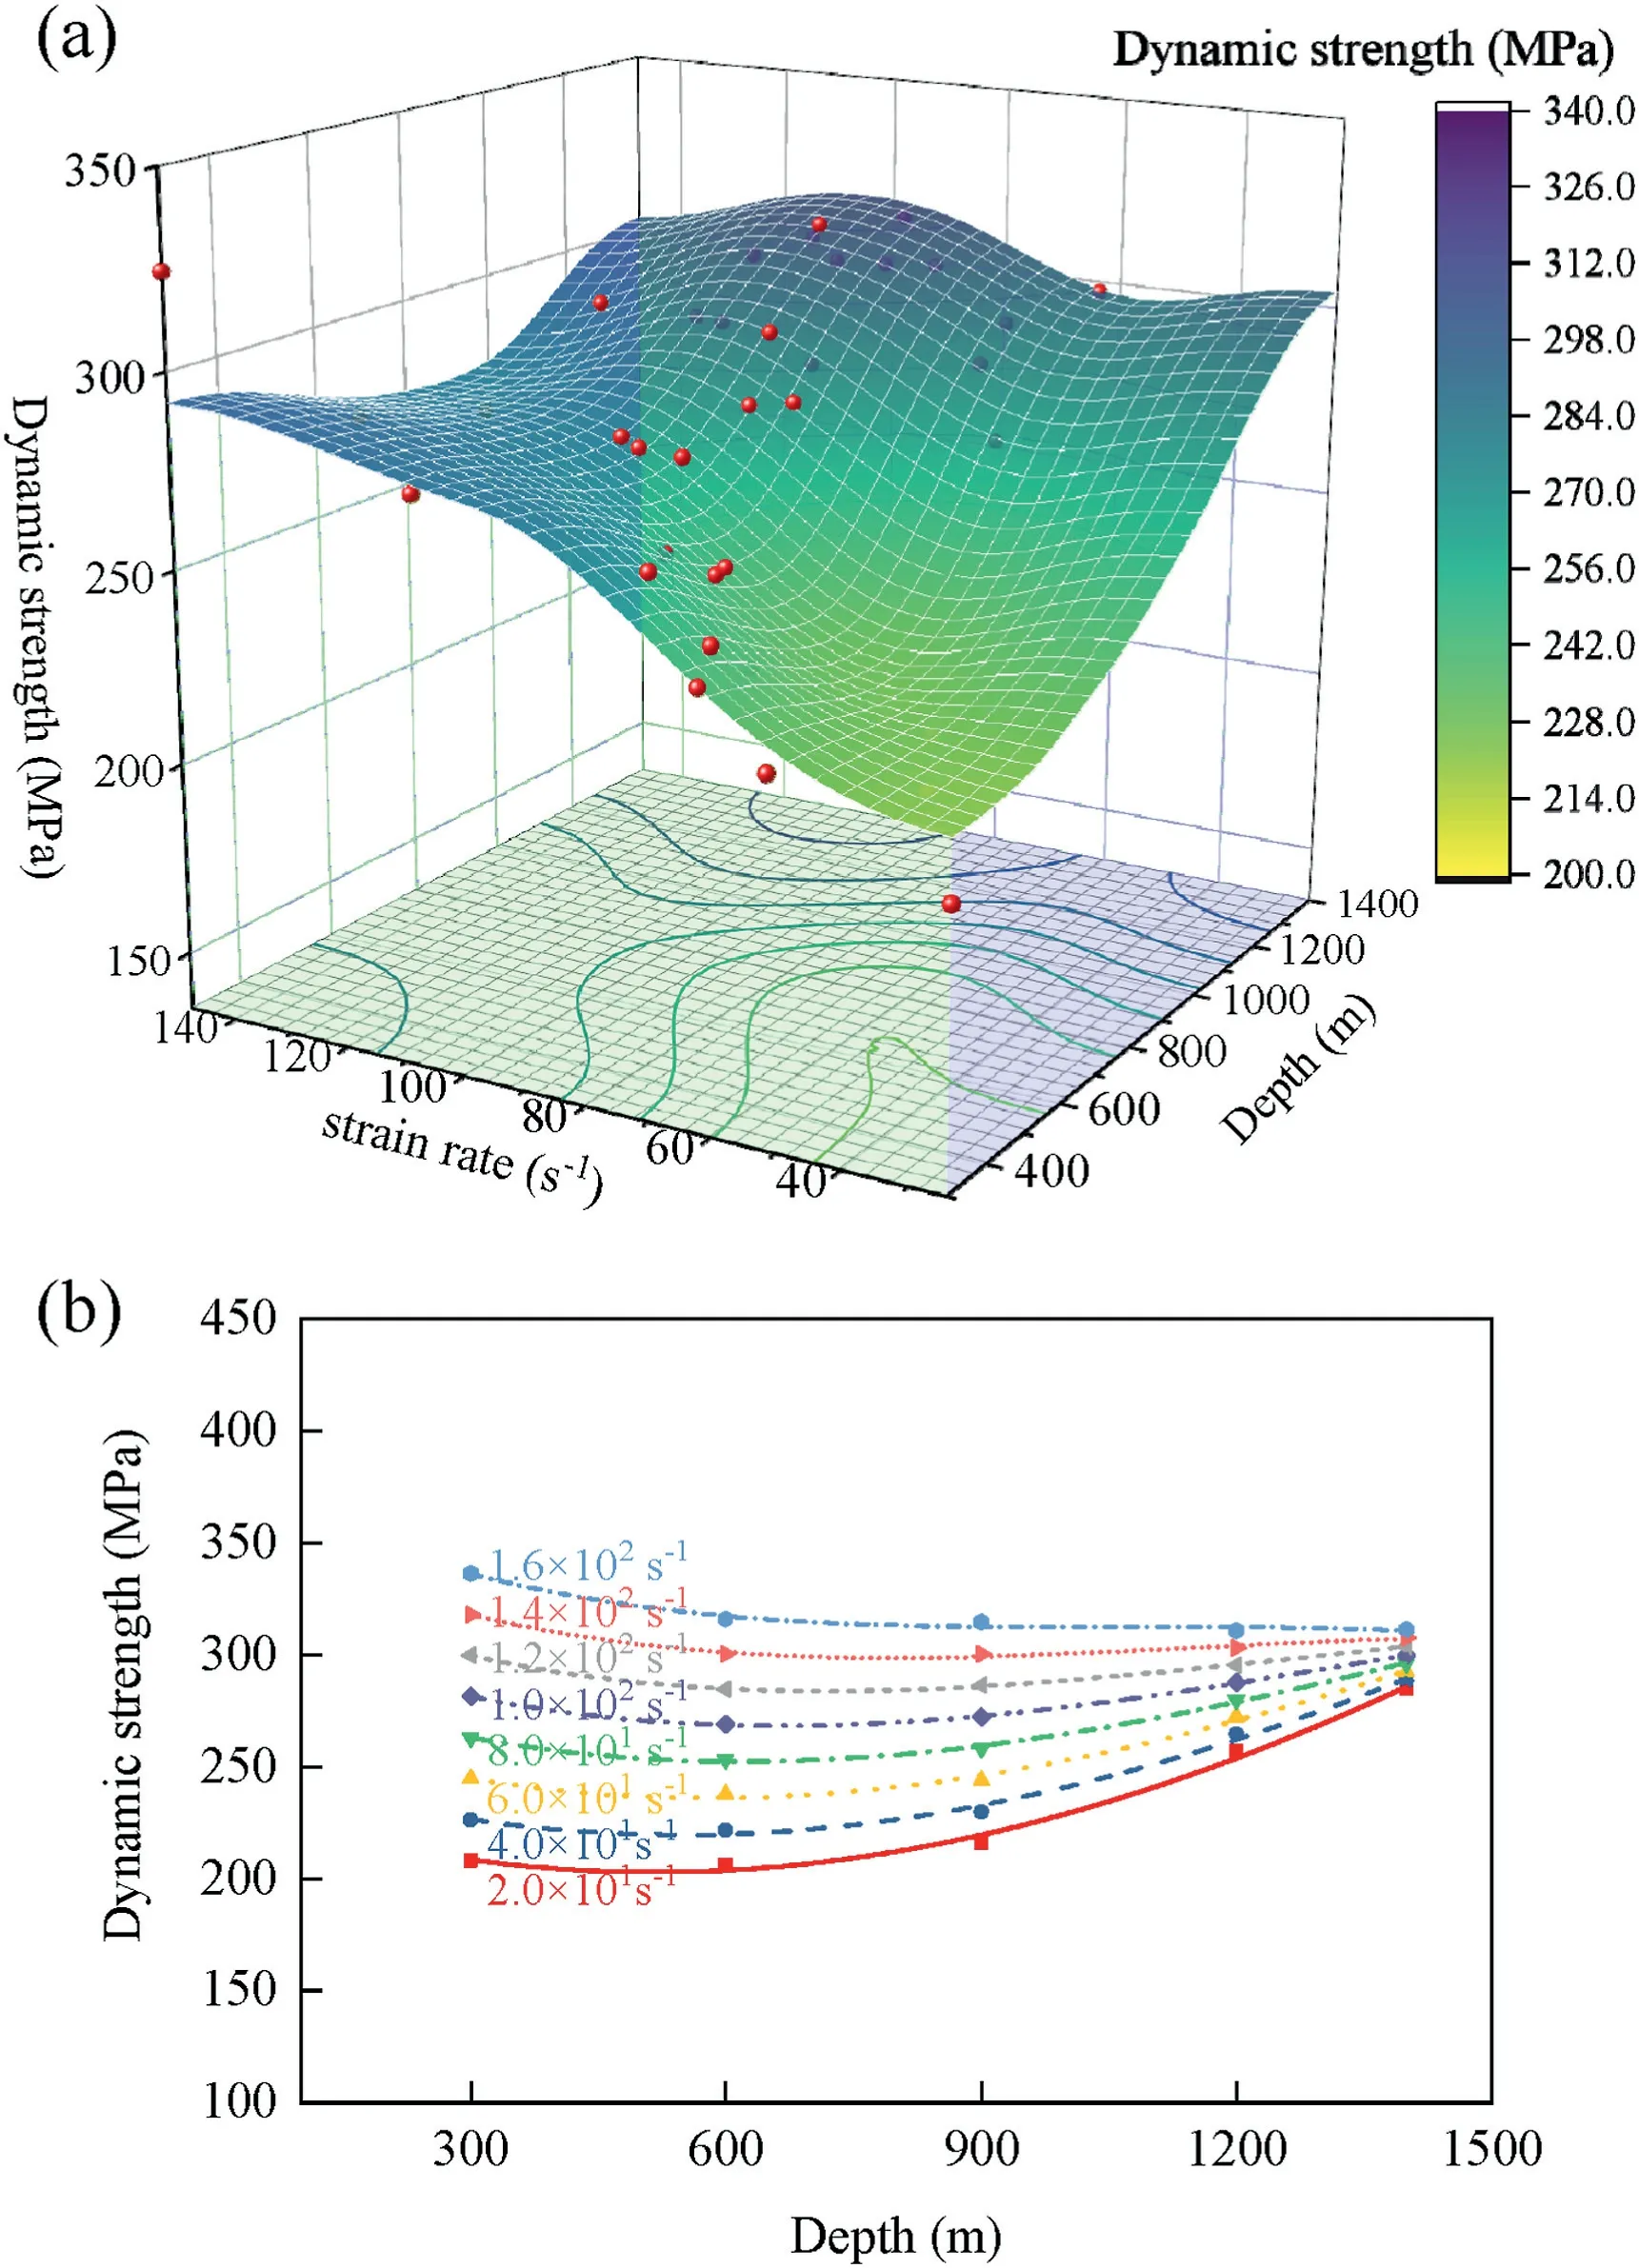
Fig.8.Dynamic strengths of marble with: (a) Different depths under various strain rates,and (b) depth at strain rate of 20-160 s-1.
Fig.8b shows the relationship between dynamic strength and depth at strain rate of 20-160 s-1.It is observed that the dynamic strength strain rate sensitivity diminishes with increasing depth.Despite the correlation decrease between the dynamic strength of rock and dynamic load intensity,the effects of dynamic disasters become more profound as the depth increases.Consequently,assessing disaster risk of underground engineering based solely on dynamic strength is insufficient.Dynamic strength exhibits a tendency to decrease and then increase with depths from 300 m to 1400 m,contrary to previous results without considering rock longterm stress states (Gong et al.,2019).At depths greater than 600-900 m,marble exhibits obvious ductility characteristics,with an extended strain-softening stage and a more pronounced plastic stage.Macroscopic cracks in the rock decrease,and the damaged body after peeling off remains intact.As a result,internal accumulated defects are minimal during the loading process,and the difference in wave impedance with strain rate is minor,indicating a weaker strain rate effect.However,at shallower depths,the insufficient occurrence stress fails to constrain effectively the circumferential deformation,highlighting the brittleness characteristics.The stress-strain curve exhibits some resilience and a noticeable strain rate effect,as well as macroscopic failure.The number and volume of rock fissures increase with the strain rate,leading to a decrease in the solid media.When stress waves act on the specimen,an increased number of pores and cracks will strengthen stress wave reflection at micro-interfaces,and weaken their transmission and wave impedance.Non-uniform stress is generated inside the rock,causing some local damage.It can form multidimensional fracture surfaces,and exhibits a significant strain rate effect.In addition,rocks demonstrate varying initial compaction degrees under long-term stress environments at different depths.Static compression tests reveal that beyond this depth,the stress applied to the rock reaches its crack initiation stress threshold (approximately 30% of its static strength).The initial pores have been compacted,and the rock enters the nonlinear deformation stage under existing stress conditions,resulting in a reduced difference in the rock wave impedance and a less pronounced strain rate effect.
2.5.Energy evolution at different depths
Strength and deformation are important rock mechanical indices,and energy transformation is the essence of the physical process of matter.According to one-dimensional stress wave theory and energy conservation law,incident energyWI(t),reflected energyWR(t),and transmitted energyWT(t) during dynamic loading are given as
where σI,σRand σTare the stresses of the incident,reflected and transmitted waves,respectively.
Generally,when the kinetic energy consumed by fragment ejection is less than 5% of the total,it can then be neglected.Dissipation energyWAand dissipation energy densityefof rocks during the failure process are given by
whereVis the specimen volume(Peng et al.,2020).
Fig.9a shows the fitting result of the dissipation energy density,where the maximum value appears at a strain rate of 120 s-1and depth of 600 m.The dissipation energy density shows a significant decreasing trend with a reduced strain rate in the high strain rate range(>80 s-1)or an increased depth at shallow depths(<900 m),but shows slight variations at other depths or strain rates.

Fig.9.Dissipation energy density: (a) Variation with different depths under various strain rates,and (b) relationship with depth at different strain rates.
Fig.9b shows the relationship between the dissipation energy density and depth at strain rates of 70-90 s-1,100-120 s-1and 140-160 s-1.Within the same strain rate range,the larger the depth,the higher the elastic energy storage,resulting in much higher elastic storage being released.Therefore,the dissipation energy density of marble is relatively small.At the same depth,the dissipation energy density correlates positively with the strain rate and increases at a larger strain rate.As the impact intensifies,primary crack propagation and secondary crack initiation occur simultaneously,leading to a decrease in rock fragmentation after crushing and an increase in energy consumption at failure.
3.Numerical modeling
3.1.HJC constitutive model for rock material
The HJC model is a constitutive model widely employed for rock-like materials,as it incorporates the influence of damage,strain rate,and hydrostatic pressure (Holmquist and Johnson,2011).The HJC model contains 20 parameters,which needs to be calibrated by experimental data of the same batch of marble.
The strength surface equation of the HJC model,shown in Fig.10,is given as follows:

Fig.10.Strength surface equation of the HJC model (Holmquist and Johnson,2011).
whereA,B,CandNare the strength parameters;Dis the damage variable;and σ*,P*,and*are the normalized equivalent stress,equivalent pressure and strain rate,respectively,which are equal to the ratio of the actual value to the reference:
wherefcis the quasi-static uniaxial compressive strength,and0is the reference stain rate.
IfD=0 and*=1,Eq.(16)can be simplified as σ*=A+BP*N,which has the same starting point as the envelope of the Mohr-Coulomb criteria (Abigail and Ernest,2016;Kucewicz et al.,2021):
wherecis the cohesion,and φ is the internal friction angle.Eq.(8)can be fitted as σ1=4.74σ3+164.62 MPa (see Fig.11a) based on Jinping marble triaxial compressive tests,andAcan be determined byA=c/fc.At this time,Eq.(16)can be fitted as σ*=2.07P*0.75+0.21 (Fig.11b),with determinedBandNvalues.

Fig.11.Parameters of Jinping marble: (a) Mohr-Coulomb fitting,(b) yield surface fitting,(c) strain rate coefficient determination,and (d) pressure parameter fitting.
Fig.11c shows the (P*,σ*) results at three different strain rates.By removing the pressure effect(Ren et al.,2017),a linear function is fitted as σ*=0.0872lnε*+0.7501,andC=0.0872 is the slope of this curve.In addition,σ*should not be greater thanSmaxand Holmquist’s assumption that a value of 7.0 is sufficient in this study.
The parameterDrepresents the damage accumulated from the equivalent plastic strain εpand the plastic volumetric strain μp,which is determined by
where Δεp+Δμprepresents the plastic strain increment,is the total plastic strain,T*=T/fcis the normalized maximum stretching hydrostatic pressure,EFMIN=0.01 is the minimum plastic strain when damaged,andD1=0.048 andD2=1 are the material damage parameters.
The parameterPrepresents the actual hydrostatic pressure,which is divided into three stages as follows:
wherePc=fc/3 is the crushing pressure;Plis the compaction pressure;Kis the bulk modulus;μ is the volumetric strain;=(μ-μl)/(1+μl)is the modified volumetric strain;μc=Pc/Kis the crushing volumetric strain;μl=ρg/ρ-1 is the compacted volumetric strain (ρ is the apparent density;and ρgis the compacted density,which can be measured by the wax seal method and volumetric flask method,respectively);andK1,K2andK3are the pressure constants.
The third stage of the state equation can be fitted by the Hugoniot empirical formula:
whereC0=2100 m/s andS=1.63 are the empirical constants given by the Los Alamos National Laboratory(Marsh,1980),and the result of the third stage is shown in Fig.11d.
Thus,all parameters for Jinping marble are summarized in Table 2.
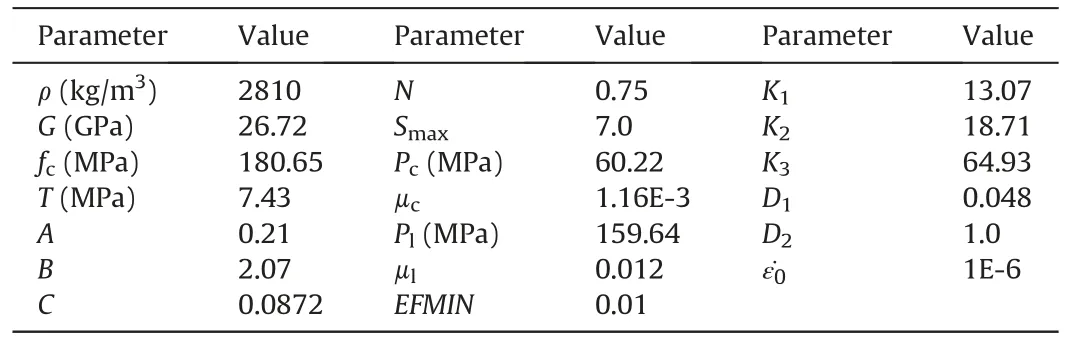
Table 2HJC constitutive model material parameters of Jinping marble (Lou et al.,2021).
3.2.Impact tests on Jinping marble at different depths
3.2.1.Numerical model
Fig.12 shows a simplified SHPB test system.It consists of an incident bar,transmitted bar,and specimen.Element Solid 164 and mapping mesh were selected to establish and grid the model in LSDYNA software,where the waveguide bars used the same elastic material and the specimen utilized the HJC constitutive model.Specifically,the cross-sectional grid division was externally circular and internally square with 32 segments along the diameter direction.The grid sizes for the incident and transmitted bars were 10 mm and 15 mm,respectively.The specimen was 1 mm wide along the axial direction,resulting in 153,600,115,200 and 30,720 elements,respectively.Automatic surface contact and penalty function algorithm were adopted,and the MAT_ADD_EROSION keyword was added to simulate the crack growth process and specimen failure.The strain failure criterion produced the best match with experiments,as discovered through trial and error calculations.Then,a pressure-time curve was applied to the outermost layer of the specimen,and a half-sine stress curve was applied to the end face of the incident bar.

Fig.12.Schematic of 3D static-dynamic loading.
3.2.2.Validation
Based on the actual strain gauge position used in the experiment,appropriate units were selected to obtain the strain signals.Fig.13 compares the stress-strain curves and failure patterns obtained from numerical simulations and laboratory experiments in a depth of 600 m stress environment.Under the confining pressure,rocks exhibit crack propagation from the outer to inner regions,and as the strain rate increases,the pattern of failure evolves into multidimensional fracture surfaces.Morphology of the stressstrain curves has high similarity among four different strain rates,with peak stress deviations of 0.41%,1.50%,0.39% and 2.42%,respectively.Specifically,the finite element method simulation can satisfactorily reproduce the stress-strain behavior of marble prior to failure.However,some differences are noticeable after the peak strength although they still have a similar trend.Two reasons for these differences are as follows: (1) rocks are anisotropic and heterogeneous materials but assumed to be homogeneous and isotropic in numerical simulations;and (2) erosion failure criteria are employed to eliminate units that reach the limit value,but voids cannot be filled during subsequent calculations leading to a steeper post-peak stress-strain curve.
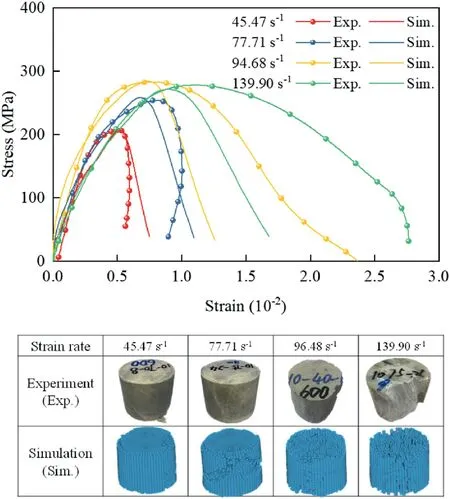
Fig.13.Comparison of stress-strain curves and failure patterns (600 m).Exp.is the laboratory experiments,and Sim.is the numerical simulations.
3.3.Dynamic mechanical properties of Jinping marble at a specific strain rate
Strain rate affects significantly rock mechanical properties,and inertial force is commonly ignored when the loading rate is lower than the quasi-static level.However,with an increasing strain rate(>10-2s-1),the dynamic increase factor (DIF) increases exponentially,so inertial force must be considered (Cai et al.,2005).Loading at a constant strain rate can be produced through a hydraulic cylinder system,but it is still not possible to obtain test results at a high constant strain rate due to the rate dependency of rock materials(Zhou et al.,2010),so most of them use the average strain rate.Different air pressures and bullet positions generate different strain rate levels.Measuring the dynamic characteristics of rocks at a relatively unified strain rate helps to reveal the dynamic characteristics of rocks at different depths.Nevertheless,this requires a large number of specimens and huge costs.
3.3.1.The constitutive relationship at a specific strain rate
Fig.14a and b presents the constitutive relationships of(σ,ε,)at depths of 600 m and 1200 m.Since the tests are mainly conducted at an intermediate strain rate,their strain rates cross the intervals(0,250)s-1and concentrate on the range(60,140)s-1.The transient release of deep in situ stress can induce an average strain rate reaching 102s-1or greater(Lu et al.,2012).Therefore,to extract the effective stress-strain scatter from 105 s-1to 115 s-1,planar slices(Zhou et al.,2010) are made along 110 s-1,and the results are illustrated in Fig.14c and d.These scatter-grams are achieved from different impact pressures but are evidently concentrated along the fitting curve.Numerical simulations achieve stress-strain curves at 110 s-1by changing the input semi-sinusoidal curve,which is consistent with the data obtained by the slice-cutting method,especially in the prepeak stage that reflects the stress-strain behavior of Jinping marble before failure.Furthermore,the stressstrain curves under static-dynamic loading at different stresses at depth (300-2400) m are fitted when the strain rate is approximately 110 s-1,as shown in Fig.15.

Fig.14.The slice-cutting method for the 3D constitutive scatter-gram of marble:(a)3D constitutive scatter-gram under 600 m,(b)3D constitutive scatter-gram under 1200 m,(c)stress-strain curve under 600 m (strain rate of 110 s-1),and (d) stress-strain curve under 1200 m (strain rate of 110 s-1).

Fig.15.Stress-strain curves under different depths at strain rate of 110 s-1.
3.3.2.Dynamic mechanical properties of Jinping marble at different depths
With increasing depth and the same strain rate,the dynamic strength increases slightly after initial decrease,but then decreases sharply,which can be fitted by a quartic polynomial form,as shown in Fig.16.The maximum dynamic strength value appears at depth 1200 m,which is approximately 1.05 times that at 600 m depth and 1.47 times that at 2400 m depth.At shallow depths,a large number of microcracks and voids in the rock are closed under static loading,and lateral deformation is also limited to some extent.However,rock deformation enters the damage stage under the action of deep stress,and secondary cracks emerge inside the rock and gradually expand,resulting in pronounced strength weakening with larger depths.This trend is consistent with the variation trend after the axial compression ratio exceeds 0.7 under one-dimensional staticdynamic loads (Li et al.,2017).
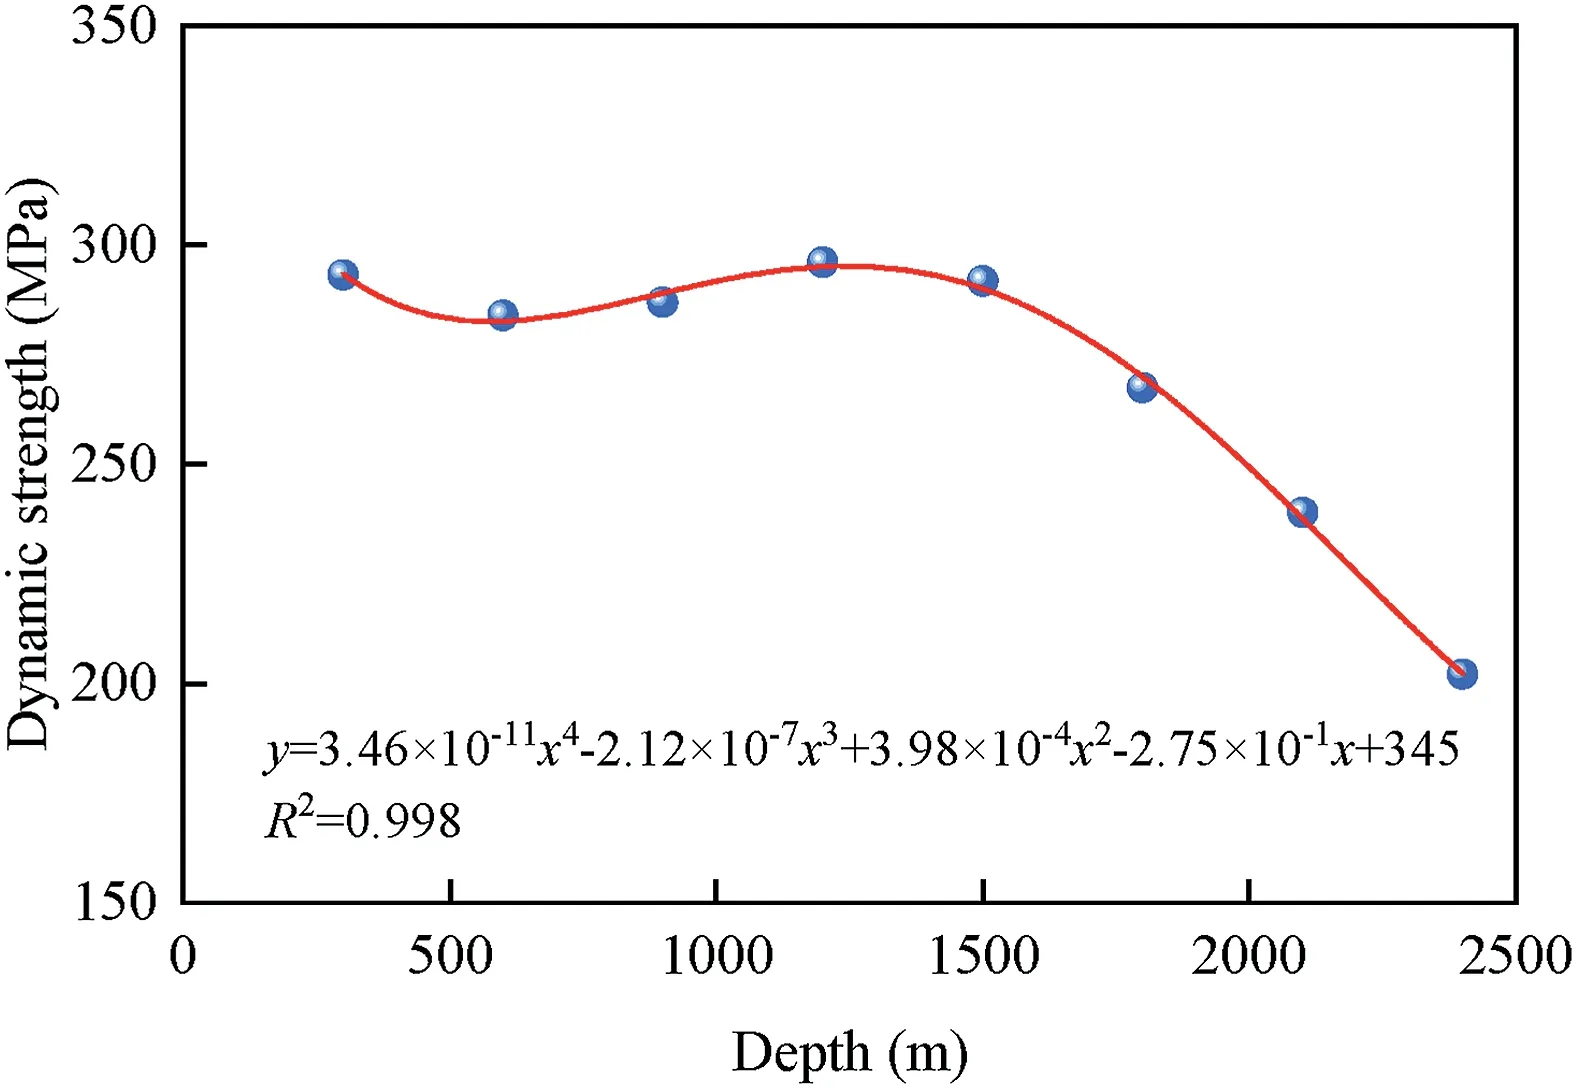
Fig.16.Variation in dynamic strength with depths (strain rate of 110 s-1).
Combined with Eqs.(13) and (15),the reflectivity,transmissivity,absorptivity and dissipation energy density of the specimen during stress wave propagation at different depths with strain rate of 110 s-1are shown in Fig.17.The reflectivity initially decreases slightly and then increases with depth,while the transmissivity,absorptivity and dissipation energy density of the specimen show exactly an opposite trend.

Fig.17.Variation in energy conversion with various depths (strain rate of 110 s-1).
From shallow to deep,the in situ stress increases nearly linearly.Initially,only primary crack closure occurs within the rock interior,but beyond a certain depth,the rock interior transforms into the growth of secondary cracks.This change in the crack pattern also causes an enhancement and subsequent weakening of the wave impedance and bearing capacity of the rock,resulting in reflectivity of stress waves that initially decrease and then increase during propagation,while transmissivity shows an opposite trend.After exceeding 1500 m,a large number of cracks initiate,and strainenergy is stored in the rock under high stress.In this scenario,the rock is destroyed,and the previously stored strain-energy is released with only minimal external disturbances.Consequently,the sum of reflectivity and transmissivity exceeds 1.0,and the rock dissipation energy density even becomes negative,indicating that the release of stored energy accompanies the rock failure process.
4.Discussion
Many geological disasters in the operation and maintenance stages of deep engineering,for example rockburst,slabbing and spalling failures,are frequently reported (Du et al.,2020).The occurrence of the disasters is related to the stress environments of deep surrounding rocks,as well as the lithology formation (Du et al.,2022a).
Before excavation of underground engineering,deep surrounding rocks maintain an equilibrium state of high in situ stress.However,once excavation commences,the surrounding rocks of the working face undergo continuous unloading disturbance.Surrounding rock undergoes a dynamic disturbance process due to an increase in original rock stress and axial stress but a decrease(unloading) in hoop stress until it reaches an equilibrium state(Zhang et al.,2016b).Additionally,the deep surrounding rocks near excavation area are also affected by stress adjustment for a long time period after the chamber is formed.Rockburst is usually induced by high in situ stress and dynamic disturbance (Zhang et al.,2012).For example,the probability of rockburst tunnel section in depth 2000-2375 m exceeds 30%,which is four times that of depth 0-1000 m (Wang et al.,2012),as shown in Fig.18.
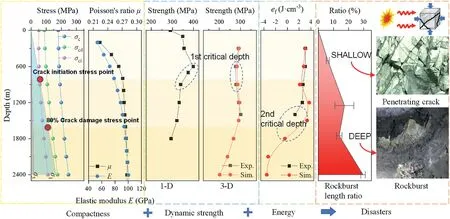
Fig.18.Evolution of dynamic disasters from shallow to deep (Wang et al.,2012;Zhang et al.,2021).
Ultrasonic tests on Jinping marble under different hydrostatic pressures show that both the dynamic elastic modulus and dynamic Poisson’s ratio increase logarithmically with increasing depth and finally are stabilized at approximately 100 GPa and 0.28,respectively,as shown in Fig.18.The Poisson’s ratio exhibits a nonlinear rapid growth trend at shallow depths,indicating that the ratio of lateral deformation to longitudinal deformation of rock increases.It is likely that hydrostatic pressure influence on lateral deformation is more significant than that on longitudinal deformation.As depth increases,the Poisson’s ratio and compactness of marble tend to be gentle.Then,both the lateral and longitudinal deformations of rock tend to be stable.
From the strength perspective,the first critical depth is 600-900 m.Beyond this depth,the dynamic strength of marble in a uniaxial stress environment decreases (Zhang et al.,2021),while the opposite result is observed in a 3D stress environment.This suggests that rock under uniaxial stress,such as in a cavern wall,is more prone to dynamic failure if the engineering occurrence depth exceeds this critical depth;while rock flake spalling occurs more frequently in cavern walls(Du et al.,2016).This critical depth aligns well with the deep mining depth proposed in many countries,such as 600 m in Japan,750 m in Britain and Poland,and 800-1200 m in Germany (He,2005).
Furthermore,there is a second critical depth between 1500 and 1800 m.The wave impedance and dynamic strength variations of deep surrounding rocks can be discriminated by this depth.The compactness of the rock gradually tends to smooth out.Taking this critical depth as the boundary,the energy conversion of specimen failure transitions from absorbing disturbance energy to releasing stored elastic energy.This phenomenon can better reflect the interaction mechanism between high static stress and dynamic disturbance in rockburst and confirms that rockbursts also occur in deep rocks (He et al.,2023).Notably,there is a specific energy storage limit in deep surrounding rocks,and the energy absorption and dissipation of rock dynamic failure are determined not only by dynamic loads but also by static loads.Hence,the dynamic failure forms of deep surrounding rocks at shallow and deep depths can be divided into the dynamic load dominant type and dynamic load induced type based on this critical depth.For the dynamic loadinduced type,the ground stress level plays a dominant role in the whole process and determines its strength and energy release level.In contrast,dynamic disturbance plays a role in inducing failure,which can be used to effectively prevent and control the occurrence of deep dynamic disasters,as summarized in Fig.18.
The above results and analysis demonstrate that the dynamic behaviors of deep marble are significantly influenced by the static loading associated with depth and strain rate.Actually,the inherent physical properties of rocks,such as their structure,density,and mineral composition,influence significantly their mechanical characteristics,which is a result of complex diagenetic processes experienced by rocks at different depths (Xie et al.,2021).
Representing deep surrounding rocks at different depths under long-term operation and maintenance of deep engineering,this work focuses on the potential for induced dynamic disasters in stress environments.The first and second critical depths,as defined previously,have been determined through extensive experimentation and simulation.Regarding the first critical depth,the preaxial compression generated by in situ stress at this depth corresponds to its crack initiation stress (approximately 30% of its static strength).The rock transitioned from initial elastic deformation stage to nonlinear deformation stage under static load.For the second one,the preaxial compression exceeds 80% of the crack damage stress (approximately 50% of its static strength).Beyond this depth,volume deformation changes from compression to expansion and unstable crack propagation initiates,leading to part of the irreversible damage during the static load application.
Although the work attempts to reveal critical depths with high dynamically induced hazard possibilities for deep engineering,some other factors are still critical.The stress condition stands as the only major variable that distinguishes depths,while the variations in rock physical properties and other external factors at different depths necessitate further supplementation.In addition,this work mainly addresses the geological environment within Jinping Mountain,and the theoretical and practical data related to a broader range of deep geological engineering are still needed.
5.Conclusion
In this paper,a series of impact compression tests and simulations were conducted to analyze the effects of various strain rates and stress environments on bearing capacity,deformation process,and energy evolution,considering a long-term stress state at different depths for deep engineering.The main conclusions can be drawn as follows:
(1) The dynamic mechanical characteristics of deep surrounding rocks are significantly affected by the strain rate and stress environment.Specifically,the dynamic strength shows an initial decrease with increasing depth at the same strain rate range.This trend contrasts with that observed under axial preload,where it drops sharply at shallow depth.Additionally,the deformation modulus is inversely proportional to depth,and the rock specimens remain relatively intact after failure,due to the constraint of prestress.
(2) Energy conversion during stress wave propagation is related to the internal structure and dynamic strength of rocks.A more integral rock compactness leads to a higher wave impedance,enhancing transmissivity capacity but impairing reflectivity.In contrast,higher rock strength requires more energy upon failure,leading to more significant energy absorption.The transmissivity variation shows the same trend as that of dynamic strength,while reflectivity shows the opposite trend at a critical depth of 1500 m.
(3) Two critical depths are suggested based on the CJPL for deep engineering.The first one demarcates the environmental constraint at approximately 600-900 m,beyond which the sensitivity of rock dynamic characteristics to the strain rate and the restraint of the circumferential stress decreases.The second demarcates energy conversion at 1500-1800 m,where the deep surrounding rock wave impedance and dynamic strength decrease significantly.At that depth,the dynamic instability of deep surrounding rocks can be categorized into two types: dynamic load dominant type and dynamic load induced type.
Declaration of competing interest
The authors declare that they have no known competing financial interests or personal relationships that could have appeared to influence the work reported in this paper.
Acknowledgments
Our deepest gratitude goes to the reviewers for their careful work and thoughtful suggestions that have helped to substantially improve this manuscript.This work was supported by the National Natural Science Foundation of China (No.U1965203).
 Journal of Rock Mechanics and Geotechnical Engineering2024年2期
- Journal of Rock Mechanics and Geotechnical Engineering的其它文章
- Determination of uncertainties of geomechanical parameters of metamorphic rocks using petrographic analyses
- Evaluation of excavation damaged zones (EDZs) in Horonobe Underground Research Laboratory (URL)
- On the calibration of a shear stress criterion for rock joints to represent the full stress-strain profile
- Effect of dynamic loading orientation on fracture properties of surrounding rocks in twin tunnels
- Experimental study on the influences of cutter geometry and material on scraper wear during shield TBM tunnelling in abrasive sandy ground
- Effect of fracture fluid flowback on shale microfractures using CT scanning