
Effect of CO2 exposure on the mechanical strength of geopolymerstabilized sandy soils
2024-02-29 14:50HmidRezRzeghiArminGernghdrFtemehSfeePooriGhdirAkrJvdi
Hmid Rez Rzeghi ,Armin Gernghdr ,Ftemeh Sfee ,Poori Ghdir, ,Akr A.Jvdi
a School of Civil Engineering,Iran University of Science and Technology,Tehran,1684613114,Iran
b Department of Engineering,University of Exeter,Exeter,EX4 4QF,UK
Keywords:Soil stabilization CO2 effect Geopolymer
ABSTRACT In recent years,there has been growing interest in developing methods for mitigating greenhouse effect,as greenhouse gas emissions continue to contribute to global temperature rise.On the other hand,investigating geopolymers as environmentally friendly binders to mitigate the greenhouse effect using soil stabilization has been widely conducted.However,the effect of CO2 exposure on the mechanical properties of geopolymer-stabilized soils is rarely reported.In this context,the effect of CO2 exposure on the mechanical and microstructural features of sandy soil stabilized with volcanic ash-based geopolymer was investigated.Several factors were concerned,for example the binder content,relative density,CO2 pressure,curing condition,curing time,and carbonate content.The results showed that the compressive strength of the stabilized sandy soil specimens with 20%volcanic ash increased from 3 MPa to 11 MPa.It was also observed that 100 kPa CO2 pressure was the optimal pressure for strength development among the other pressures.The mechanical strength showed a direct relationship with binder content and carbonate content.Additionally,in the ambient curing (AC) condition,the mechanical strength and carbonate content increased with the curing time.However,the required water for carbonation evaporated after 7 d of oven curing (OC) condition and as a result,the 14-d cured samples showed lower mechanical strength and carbonate content in comparison with 7-d cured samples.Moreover,the rate of strength development was higher in OC cured samples than AC cured samples until 7 d due to higher geopolymerization and carbonation rate.
1.Introduction
In recent years,world energy consumption(coal,oil,and natural gas,etc.) has been increasing and industrialization has led to high amounts of CO2emissions.Moreover,the construction industry has caused excessive CO2emissions because of using nonenvironmentally friendly materials like Portland cement.As a result,the researchers’attention has been drawn to the methods of reducing CO2and mitigating the greenhouse effect.One of the main methods of mitigating CO2effectis carbonation which involves the chemical reaction of carbon dioxide to give carbonates,bicarbonates,and carbonic acid (Pavithra et al.,2016;Ruan and Unluer,2016;Wang et al.,2019;Mohammed et al.,2021).Natural carbonation,which can be referred to as weathering,involves the removal of atmospheric CO2through the reaction of CO2and natural alkali silicates to form carbonates(Lim et al.,2010;Santos et al.,2021).
Lu et al.(2011) conducted test on natural basalt samples to determine the amount of CO2trapped by natural carbonation reactions.Based on a semi-quantitative estimate,94.15 kg of CO2per 1 m3of basalt was trapped.However,due to the very low concentration of atmospheric CO2(0.03%-0.06%),the carbonate kinetics naturalization was very slow and did not have much effect on reducing the concentration of CO2in the atmosphere (He et al.,2011;Lu et al.,2011).
Another research used accelerated carbonation as a method of CO2removal,in which high-purity CO2was artificially injected into alkaline materials to enhance the carbonation reaction to produce stable carbonates on a time scale of a few hours (Lim et al.,2010).Accelerated carbonation is divided into two main types including mineral carbonation and alkaline solid waste carbonation (Lim et al.,2010).The process of mineral carbonation contains the removal of CO2,including the reaction of basic minerals (which includes a high concentration of calcium or magnesium oxide) or natural minerals (olivine,wollastonite,and serpentine) with highpurity of CO2.This turns into stable carbonate in the presence of high temperature and pressure(Huijgen et al.,2006).This method has the potential to remove high concentrations of CO2.However,it is very costly due to the high amount of energy required to crush raw materials to compress the CO2feed into the raw slurry,as well as the energy required to reach high temperatures (Huijgen et al.,2006;Lu et al.,2011).Alkaline waste carbonation is a CO2removal method that involves a one-step reaction (also called direct carbonation)of high-purity CO2with solid alkaline waste to produce carbonates (Washbourne et al.,2012).Alkaline waste carbonation does not require the extraction of active cations because cation-containing oxides,hydroxides,and silicates are the main reactive phases involved in this process (Washbourne et al.,2012;Papa et al.,2019).Blast furnace slag,cement kiln dust(CKD),construction and demolition waste,steel slag(SS),and ash of incinerated municipal solid waste are some of the alkaline wastes that have been successfully used in this carbonation process(Washbourne et al.,2012).
In another study,the effects of temperature,CO2pressure and carbonation time on the compressive strength,CO2sequestration,mineralogy and microstructure of steel slag block were investigated.It was concluded that higher temperatures than 70°C led to less formation of CaCO3and lower compressive strength because of water evaporation and reduced CO2solubility (Zhong et al.,2021).
In recent years,geopolymers have been widely used instead of cement,due to their environmentally friendly features and low production cost (Mola-Abasi and Shooshpasha,2016;Ghadir and Ranjbar,2018;Ghadir et al.,2021).Geopolymers are integrated from the chemical reaction between an amorphous predecessor,which possesses sufficient alumina(Al2O3)and silicate(SiO2),with a sodium-or potassium-based activator (Xu and Van Deventer,2000;Miraki et al.,2022;Razeghi et al.,2022).In summary,geopolymer or inorganic polymer formation employs reusable industrial waste materials (e.g.ground granulated blast-furnace slag)or mineral materials (e.g.volcanic ash) as a supply of silicon (Si) and aluminum (Al).The Si and Al break up in an alkaline activating solution,and after that,the molecules of silicon,aluminum,and oxygen make a chain of silicates and alumina tetrahedra that sporadically unite together by sharing oxygen atoms,which are transformed into three-dimensional polymeric Si-O-Al-O at nanoscale (Shariatmadari et al.,2021a;Samadi et al.,2023).At the beginning,some geopolymer precursors such as volcanic ash were used as an additive to cement.In recent years,the use of geopolymer instead of Portland cement has been noticed in soil stabilization because in addition to CO2capturing potential and mitigating greenhouse effect,it can stabilize problematic soil to an acceptable level depending on the duration and location conditions of the project.A lot of studies have been conducted on the stabilization of problematic soils with geopolymers.It shows that according to the limitations and conditions of the project,it is possible to choose the appropriate precursor and activator and stabilize the problematic soil (Miraki et al.,2022;Razeghi et al.,2022).In recent years,different precursors have been studied as geopolymer precursors for soil stabilization,including fly ash,blast furnace slag,metakaolin,and volcanic ash.For instance,a study was conducted on the feasibility of using metakaolin instead of Portland cement for soil stabilization and it was proved that the mechanical properties of metakaolin geopolymer stabilized soil can even surpass the mechanical properties of Portland cement stabilized soil.Also,it has been shown that the metakaolin stabilized soil has less brittleness than the unimproved sample,so it can be a suitable option for paving roads(Zhang et al.,2013).
Another research describes an innovative approach to stabilize soil surfaces against wind erosion using volcanic ash-based geopolymer.The authors experimentally investigated the effectiveness of the geopolymer in stabilizing wind-susceptible soil surfaces.The results showed that the geopolymer significantly improved the soil’s resistance to wind erosion,reducing the soil’s erosion rate by up to 99.7%.The geopolymer also improved the soil’s water retention capacity and reduced its susceptibility to crusting.The study found that the geopolymer’s effectiveness in stabilizing soil surfaces was dependent on factors such as the geopolymer’s composition,application rate,and curing time.The authors concluded that volcanic ash-based geopolymer has the potential to be an effective and sustainable solution for soil stabilization against wind erosion,particularly in arid and semi-arid regions(Shariatmadari et al.,2021b).
Mohebbi et al.(2022) investigated the use of a volcanic ashbased geopolymer as a surface stabilizer by studying the rheological behavior of different geopolymer mix designs.A shear-thinning behavior was identified in all samples,and a linear correlation was found between the final apparent viscosity and the binder-toactivator ratio.The chemical features of mix design and infiltration depth were found to have a major influence on the final resistance of geopolymer-treated soils,regardless of the effect of binder content on soil structure.
Another promising characteristic of the geopolymer is CO2capturing potential in order to produce carbonate and bicarbonate compounds desirable for soil stabilization addition to mitigation of greenhouse effect (Fasihnikoutalab et al.,2016,2017b).Ground granulated blast furnaces slag(GGBS),volcanic ash,and olivine,etc.have been widely suggested for direct carbonation(Fasihnikoutalab et al.,2016).
Fasihnikoutalab et al.(2016) conducted a laboratory-scale model for soil stabilization using carbon dioxide (CO2) deposition.The authors investigated the effectiveness of CO2deposition in stabilizing soil samples under different conditions,such as different CO2flow rates,durations,and soil types.The results showed that CO2deposition significantly improved the soil’s compressive strength and reduced its permeability.The study also found that the effectiveness of CO2deposition was dependent on factors such as soil type,CO2flow rate,and deposition duration.Fasihnikoutalab et al.(2017b)investigated the use of alkali-activated olivine as a soil stabilizer and the effect of carbonation on its strength and microstructure.The results showed that alkali-activated olivine significantly improved the soil’s mechanical properties and reduced its permeability.The study also found that carbonation had a positive effect on the strength of alkali-activated olivine-stabilized soil,with the strength increasing over time due to the formation of carbonate minerals.The authors concluded that alkali-activated olivine can be a promising and sustainable solution for soil stabilization,and carbonation process can further enhance its effectiveness.
Although various researches were conducted on the effect of the carbonation process on Portland cement stabilized soils,the effect of CO2exposure on the mechanical strength of geopolymer stabilized soils has not yet been fully understood.The present study attempts to fill the gaps in the available literature and develops an in-depth understanding of the effect of CO2exposure on mechanical and microstructural features of a sandy soil stabilized with volcanic ash-based geopolymer.The carbonate content was assessed by calcimeter and the intensity of its crystalline phases was elaborated using the analysis of X-ray diffraction (XRD) patterns in both ambient curing(AC)and oven curing(OC)conditions.The chemical bond structures and the variation of the amorphous bonds were further analysed using FTIR spectroscopy.Also,scanning electron microscope (SEM),energy-dispersive spectroscopy(EDS),and mapping analysis were used to evaluate specimens’matrices.
2.Materials and methods
2.1.Soil characterization
The soil employed in this context was Firouzkouh sand(No.161)sampled from the Firouzkouh mine,northeast of Tehran,Iran.Fig.1 illustrates the grain size distribution of the sand based on the ASTM D422-63 (2002).Based on the Unified Soil Classification System(USCS),the soil is categorized as poorly graded sand(SP).Standard Proctor compaction tests were carried out on the soil to obtain the maximum dry density(γmax)based on ASTM D698-21(2021).The minimum and maximum densities were 1.397 g/cm3and 1.635 g/cm3,respectively.Tables 1 and 2 show the physical characteristic and the results of the X-ray fluorescence (XRF) test for the sand,respectively.
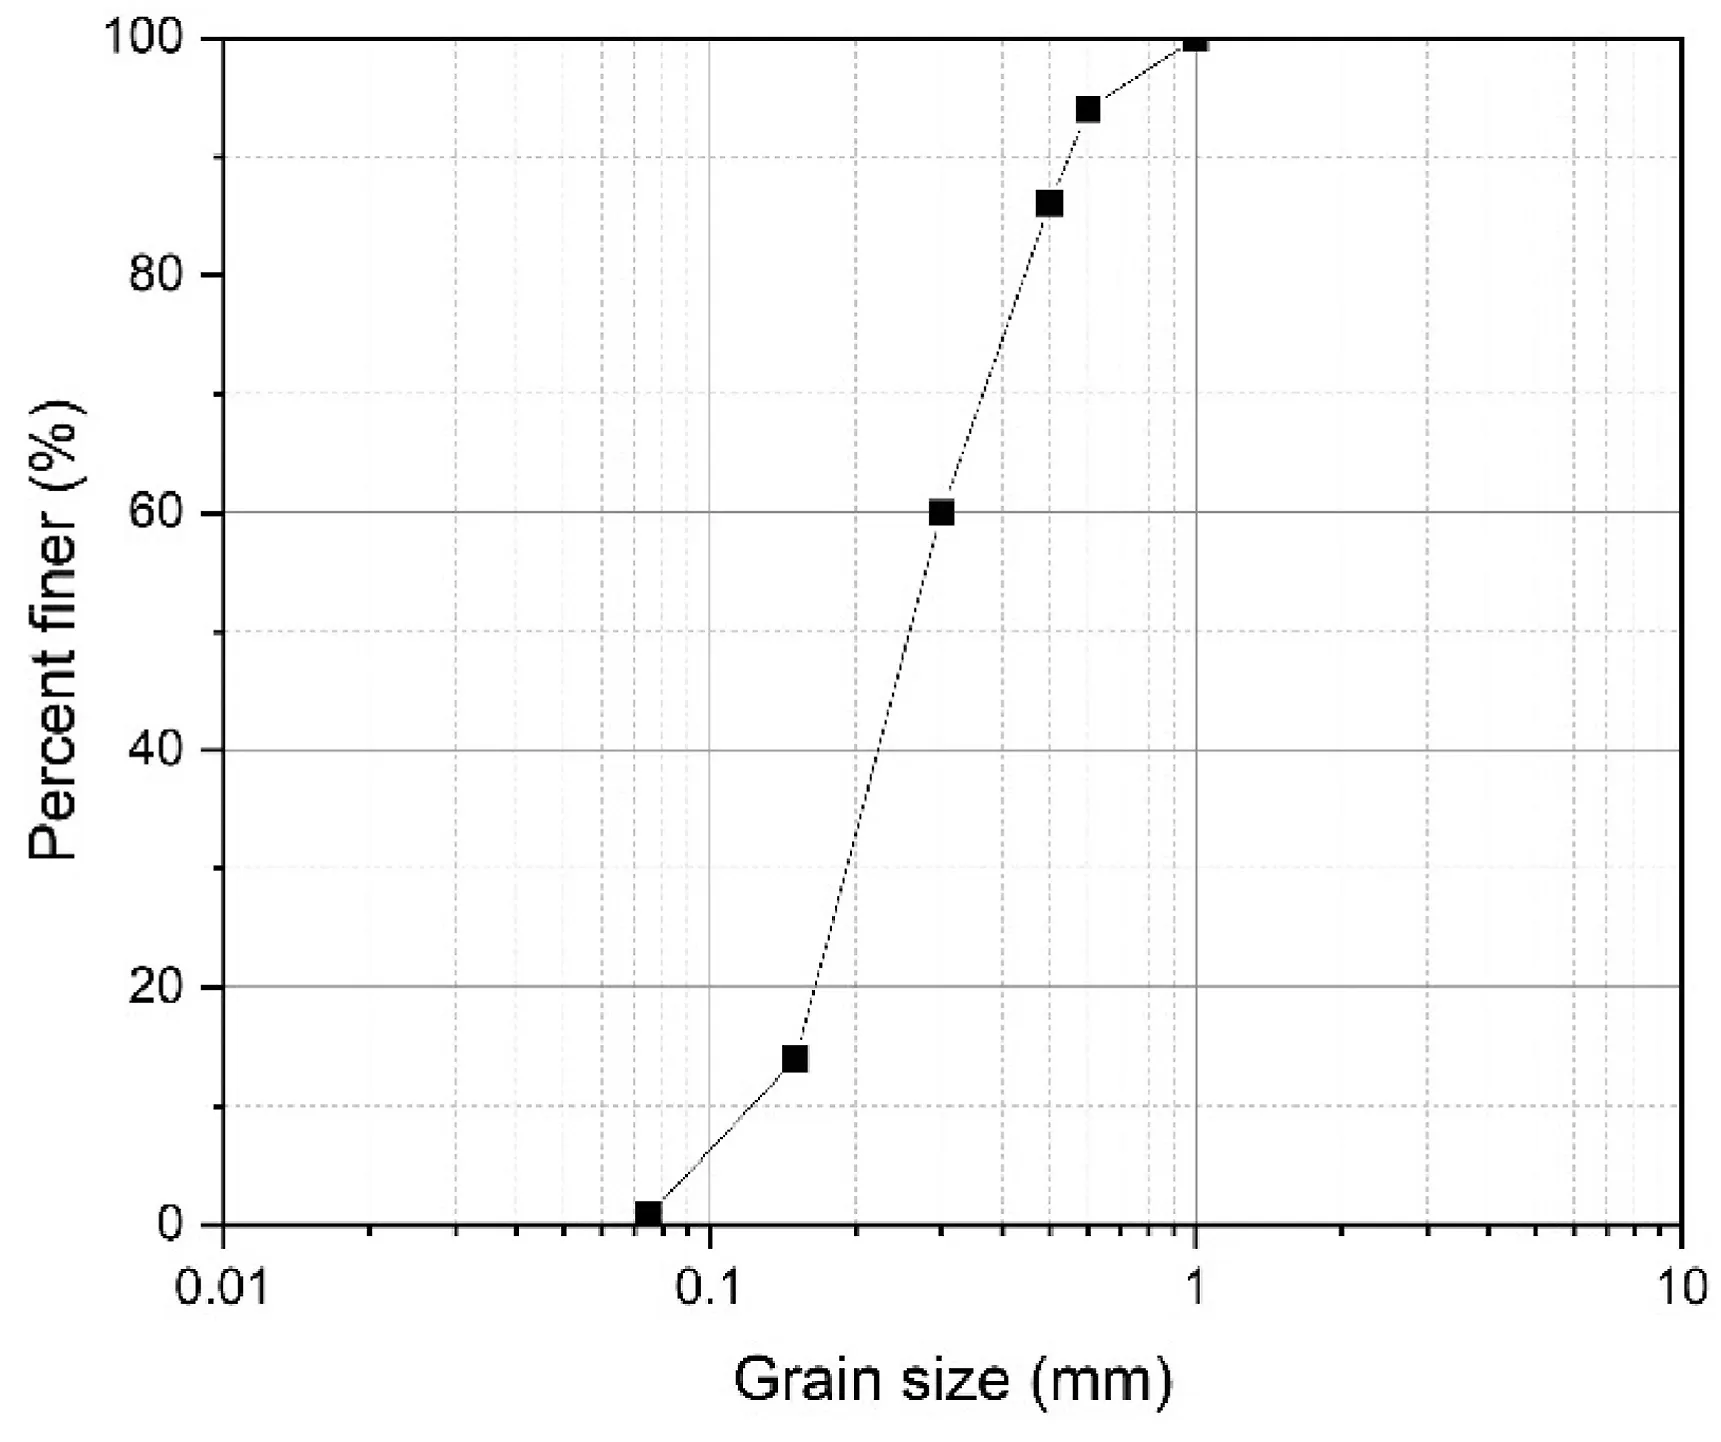
Fig.1.Grain size distribution curve of Firouzkouh sand.
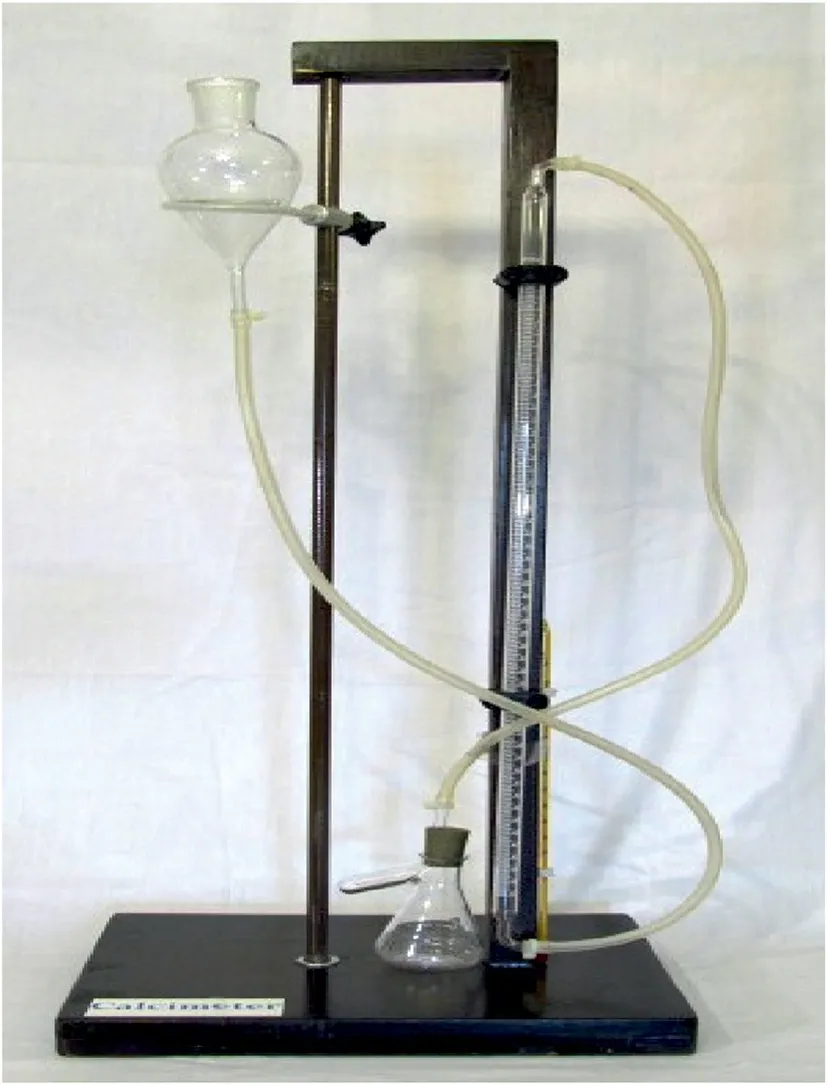
Fig.2.Calcimeter instrument used to determine carbonate content.
2.2.Binders characterization
Volcanic ash is a characteristic pozzolanic material.In recent years,there has been an increasing interest in the utilization of volcanic ash (Tchakoute Kouamo et al.,2013b;Cai et al.,2016;Cheng-Yong et al.,2017).This natural material is found broadly through the world and has numerous normal highlights like being a rich source of aluminosilicate (Djobo et al.,2017;Ghadir et al.,2021).The volcanic ash utilized in this study was obtained from Taftan Mountain in Sistan and Baluchestan area in southeastern Iran.XRF tests were performed on the volcanic ash,according to ASTM C618-19a (2019),to determine its chemical compounds and the results are shown in Table 3.

Table 1Physical properties of Firouzkouh sand.
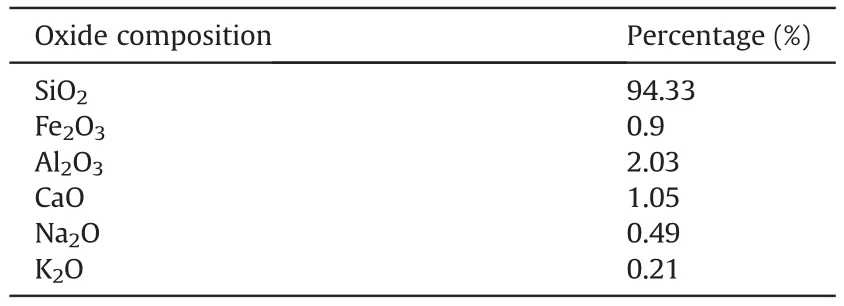
Table 2Chemical properties of Firouzkouh sand.
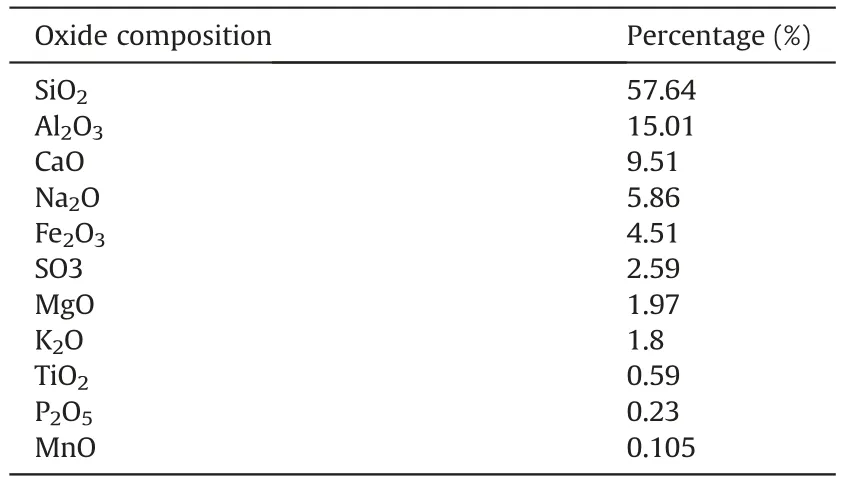
Table 3Chemical properties of the volcanic ash.
3.Soil stabilization and characterization tests
3.1.Equilibrium time
One of the first challenges was to determine the optimum time for carbonation.To this,three types of samples with three different binder contents of 10 wt%,15 wt%,and 20 wt% (related to the dry soil),and the same relative density of 80%were prepared and cured in oven at 50°C for 7 d.Then the samples were put in the carbonation cell at the CO2gas pressure of 100 kPa.The differential mass of each sample was recorded every 15 min.As the differential mass of the samples is related to the carbonation products when the mass of the sample becomes constant,the optimum carbonation time can be obtained.The efficient time depicted in Fig.3 for carbonation is 1 h and after that,the mass of the samples does not change significantly.
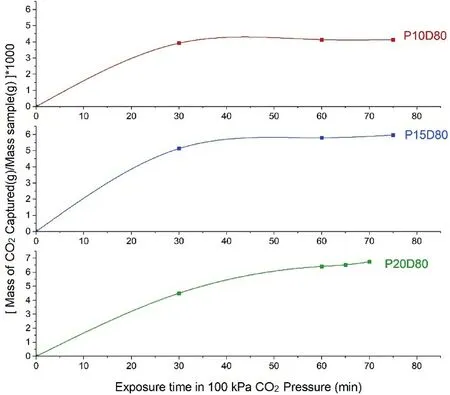
Fig.3.Equilibrium carbonation time for samples with the same relative density and various binder contents(the number written after P indicates the percentage of binder and the number written after D indicates the relative density of the sample).
3.2.Specimen preparation and mechanical characterization
For preparation of the samples for unconfined compressive strength tests,moulds with an internal diameter of 38 mm and a height/diameter ratio of 2 were utilized.The required soil mass was assumed based on relative density calculation,and relative humidity was assumed 13.5%of soil mass for all the samples.The soil was mixed with volcanic ash for 10 min to obtain a homogeneous blend.In the next step,water,sodium hydroxide,and sodium silicate were mixed according to the geopolymer calculations,and then were added to the mixture of soil and volcanic ash.The whole mixture was stirred for another 10 min to obtain a homogeneous mixture.After blending the materials,the uniform blend was put into the aforementioned mould and compacted in three layers.Three samples were made for each combination of materials.All the samples were cured under two different conditions: AC where the samples were cured at room temperature(20°C±2°C)and relative humidity 60-80%and OC(OC)in which the samples were placed and cured in an oven at 50°C.The curing times of specimens were 3 d,7 d,and 14 d for both curing conditions.After the curing time,the samples were divided into two groups;the first group was placed in the atmospheric condition and the second group was put in the carbonation cell at different CO2pressures of 100 kPa,200 kPa,and 300 kPa for 1 h.Table 4 details all the variations in the samples.After the carbonation time,the unconfined compressive strength tests were conducted on all samples according to the ASTM D1633-17 standard using the strain-controlled method at a pace of 1 mm/min (ASTM D1633-17,2017).Mechanical tests were performed using a universal testing machine (ELE Digital Tritest 50,ELE Company,Ripley,UK).All the tests were repeated three times,and the average UCS value was reported as the final result.

Table 4The list of the variations in the samples.
3.3.Calcimeter test
Calcimeter test was conducted on the carbonated and noncarbonated samples to investigate the amount of carbonation product in the samples according to ISO 10693 (1995).Calcimeter test is performed by means of an instrument,as shown in Fig.2.The carbonation amount was represented as the equivalent concentration of CaCO3.A specified amount of hydrochloric acid(HCl)first was put in a separate plastic cup and then put in the same reaction vessel with the sample.After the isolation,the hydrochloric acid was poured into the specified amount of sample powder by shaking the reaction vessel.Then some CO2gas was released from the sample and the equivalent concentration of CaCO3was calculated based on the differential pressure produced by the released CO2gas.The reaction in simplified form reads as follows (Me means metal):
3.4.Microstructural characterization
The carbonated and non-carbonated stabilized soil samples were examined by XRD using X’Pert Pro device of Panalytical Company with anode substance of Cu,a step size of 0.026 and a 2θ range of 2°-80°operated at 40 kV and 40 mA to detect the distinct phases formed by carbonation.Moreover,the powdered samples were squeezed into KBr pellets to be arranged for FTIR examination utilizing an FTIR spectrometer of PerkinElmer Company to distinguish chemical bond structures.SEM-EDS-Mapping via a ZEISS spectroscopy device was used to study the microstructural features of the carbonated and non-carbonated stabilized soil samples.
4.Results
4.1.Compressive strength
Fig.4 indicates the unconfined compressive strength of 7-d cured samples at different binder contents,relative densities and curing conditions.It can be observed that binder content has a direct relation with UCS in all conditions,but there is large difference in the UCS when the samples were exposed to the CO2pressure,especially in 100 kPa.In other words,when the binder content increases,the UCS of the samples increases due to more geopolymeric gel in the atmosphere condition.However,under the influence of CO2pressure,the UCS of the samples increases due to both a higher geopolymeric gel content and the presence of additional carbonation products.Additionally,when the samples with low relatively density(30%)are placed in the carbonation cell,they reach the same strength or higher as the samples with a high relative density (80%) in atmospheric condition.

Fig.4.Unconfined compressive strength of 7-d cured samples at different binder contents,relative densities and curing conditions.
Fig.5 shows that the samples stabilized with volcanic ash and cured in oven had higher UCS value because of better performance of natural pozzolan-based geopolymer at high temperatures due to its mineral composition.As can be seen in Fig.5,there is a considerable difference between the atmosphere condition and the 100 kPa CO2pressure condition.However,when the CO2pressure increases to 200 kPa and 300 kPa,there is no significant increase in the UCS(1.98 MPa,1.9 MPa,2.23 MPa at 100 kPa,200 kPa,300 kPa of CO2pressure,respectively).In other words,100 kPa CO2pressure is the optimum pressure among the other pressures for gaining strength and 100 kPa of CO2pressure is enough for processing all carbonation reactions.

Fig.5.Unconfined compressive strength of 7-d cured samples at different binder contents,relative densities (Dr) and curing conditions.Dr represents the relative density.
Fig.6 presents the effect of curing time on mechanical strength of samples with relative density of 80%and binder content of 20 wt%.It is observed that the geopolymerization rate is higher in the first 7 d than other times.In other words,there is a considerable difference in the UCS between 3 d and 7 d but there is a slight difference between 7 d and 14 d in both curing conditions.The other point is that under the atmospheric condition,the UCS increased with curing time in both OC and AC.However,in the OC condition when the samples are exposed to the CO2pressure,the increased UCS in the 14-d samples is lower than the 7-d samples.In other words,when the 7-d samples were exposed to the CO2pressure,more carbonation product was formed than the 14-d samples.This can be attributed to the lack of water required for the carbonation process in the 14-d samples.However,in the AC condition for the carbonated samples,the expected trend occurred and the UCS increased with increasing the curing time.
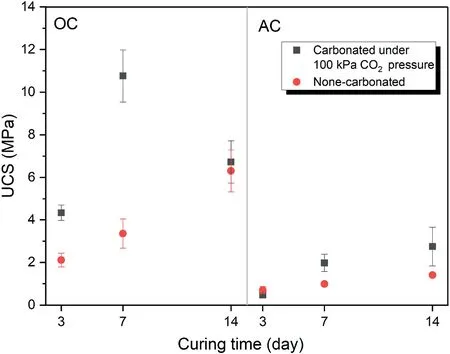
Fig.6.The effect of curing time on unconfined compressive strength of samples with relative density of 80% and binder content of 20 wt% at different curing conditions.
4.2.Calcimeter test
Fig.7 reflects the effect of CO2pressure on carbonate content and UCS of the samples cured for 7 d with relative density of 80%and binder content of 20 wt%.Although there is a notable difference among the samples cured under atmospheric condition and those under 100 kPa CO2pressure,there is no significant difference between the samples under 100 kPa CO2pressure and the samples under 300 kPa CO2pressure (17.03 g/kg at atmospheric pressure and 31.21 g/kg and 35.67 g/kg at 100 kPa and 300 kPa CO2pressure,respectively).Also,the carbonation content results in Fig.7 confirm this because the carbonate contents of the samples under 100 kPa CO2pressure and those under 300 kPa CO2pressure are nearly the same but are more than the carbonate content of the atmospheric samples.Moreover,like UCS,the carbonate content has a significant increase in the OC condition because the high temperatures at an early age help to accelerate the geopolymeric reactions and the formation of carbonation product.However,in AC this increase is lower than in OC.

Fig.7.The effect of CO2 pressure on carbonate content and UCS of samples cured for 7 d with relative density of 80% and binder content of 20 wt% at different curing conditions.
Fig.8 indicates the effect of relative density on carbonate content and UCS of 7-d cured samples with binder content of 20 wt%under 100 kPa CO2pressure.It is demonstrated that in the OC condition,the samples with a low relative density (like 30%) have lower carbonate content than the samples with a high relative density(like 80%)due to the presence of more geopolymeric gel in the latter groups.Also,the UCS results follow the carbonate content results,and the samples with higher relative density have higher UCS value due to the high geopolymerization rate at high temperatures and high density of the samples.However,in the AC condition,the low relative density samples have higher carbonate content than the high relative density samples.The UCS results follow this trend,and the samples with lower relative density have higher UCS value than those with higher relative density.This can be attributed to the presence of more pores in the lower relative density samples and enough water for the carbonation process,which leads to more carbonate content and higher UCS value.

Fig.8.The effect of relative density on carbonate content and UCS of samples cured for 7 d with binder content of 20 wt% under 100 kPa CO2 pressure at different curing conditions.
Fig.9 illustrates the impact of curing time on carbonate content and UCS of samples with relative density of 80%and binder content of 20 wt% under 100 kPa CO2pressure.In the OC condition,the water required for the carbonation process is gradually decreased after 7 d of curing time in the oven.This leads to the formation of lower carbonate content in the samples cured for 14 d compared with those cured for 7 d.This in turn results in lower UCS value in the samples cured for 14 d.However,in the AC condition,the geopolymeric and carbonate products continue to form even after 7 d but at lower rate than the first 7 d.As a result,the samples cured for 14 d in AC condition have higher carbonate content and higher UCS value than the samples cured for 7 d.

Fig.9.The effect of curing time on carbonate content and UCS of samples with relative density of 80% and binder content of 20 wt% under 100 kPa CO2 pressure at different curing conditions.
The effect of binder content on the carbonate content and UCS of samples can be observed in Fig.10.As expected,the binder content has a close relationship with carbonate content and UCS.In other words,at a constant CO2pressure,when the binder content increases,more geopolymeric gel and more carbonate content are formed and as a result,the UCS increases.Another point is that in the first 7 d of curing,the effect of curing condition on the rates of geopolymer formation and carbonate formation is considerably high in OC condition due to better performance of volcanic ash in contrast to AC condition.
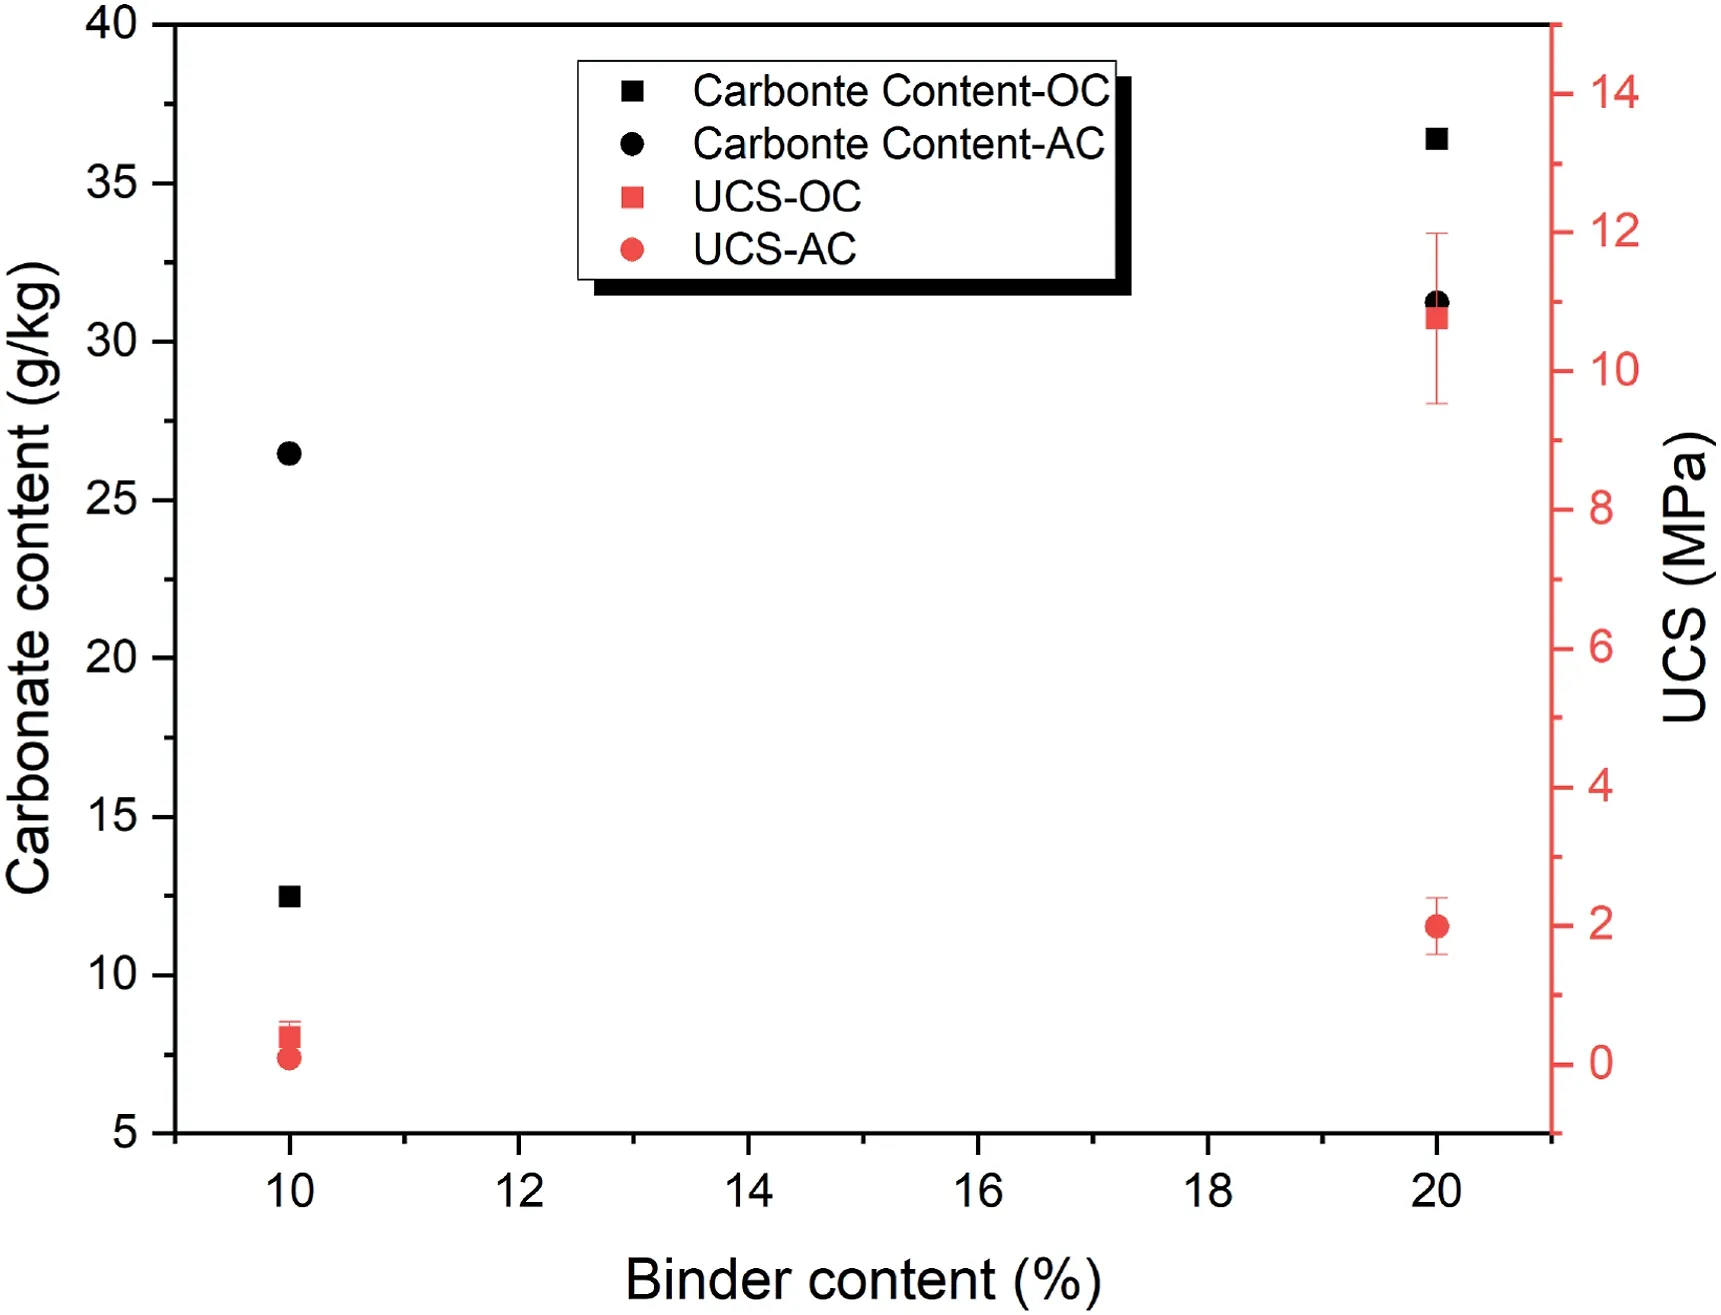
Fig.10.The effect of binder content on carbonate content and UCS of samples cured for 7 d with relative density of 80% under 100 kPa CO2 pressure at different curing conditions.
4.3.FTIR analysis
The FTIR spectra of the selected samples is displayed in Fig.11.As can be seen,the broad spectrum of 3200-3300 cm-1and the peak at the wavelength of 1600 cm-1belong to the stretching vibration(-OH) and the bending vibration (H-O-H),which are presented in the water molecule (Tchakoute Kouamo et al.,2012).This water may be related to the water on the surface of the sample or the water in the pores of the sample.Also,it can be seen that in the specimens cured in OC conditions (indicated by letter O in the name of the sample in Fig.11),the peak intensity is lower than that cured in AC conditions (indicated by letter A in the name of the sample in the Fig.11).This reduction in the peak can be due to the reduction of the vibration related to the bond in the water molecules or due to the reduction of the water molecules in the ovencured samples (Tchakoute Kouamo et al.,2012;Tchakoute Kouamo et al.,2013a).
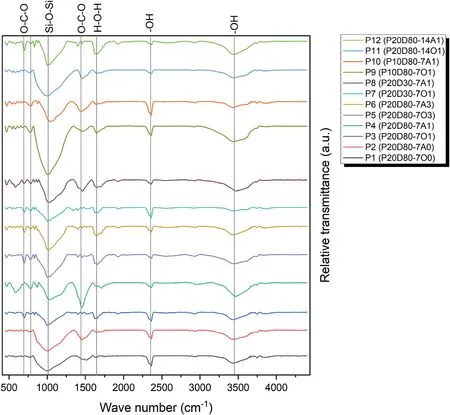
Fig.11.FTIR spectra of the selected samples(the first number written after the dash indicates curing time and last number shows the CO2 pressure;and the letter A and O indicates AC and OC conditions,respectively).
In the same way,the peak observed at the wavelength of about 2300 cm-1can be related to-OH bond and the stretching vibration between H and O in the water molecules.The peak at the wavelength of about 2300 cm-1is attributed only to the water absorbed by the geopolymer,but not to the water molecules on the surface;that is why the intensity of this peak is almost the same in all samples (Tchakoute Kouamo et al.,2013a).
There is another peak at a wavelength of about 1000 cm-1related to the formation and activation of the geopolymer gel,especially the O-Si-O bond,which may be considered as a proof of the formation and activation of the geopolymer gel in all selected specimens (Tchakoute Kouamo et al.,2012;Tchakoute Kouamo et al.,2013a;Santos et al.,2021).It can also be observed that the intensity of this peak in the P11 sample that was cured for 14 d is higher than that cured in 7 d because the structure and network of the geopolymer is more complete in 14 d compared to that in 7 d.
The peak related to the wavelength of about 1400 cm-1is attributed to the O-C-O bond,which is related to sodium bicarbonate products(Skocek et al.,2020).The reason for its formation is the absorption of CO2gas in the atmosphere by the sample(Santos et al.,2021).The peak at the wavelength of about 700 cm-1is also related to O-C-O bond and the difference with the peak at 1400 cm-1is in the type of vibration of their bonds.In other words,the bond corresponding to the 700 cm-1peak is a kind of in-plane vibration,and the vibration in the 1400 cm-1peak is a kind of outof-plane vibration.It should also be noted that the intensity of 1400 cm-1and 700 cm-1peaks is reduced in samples P1 and P2.In other words,these samples have a smaller amount of carbonation products.Also,the intensity of the peaks at the pressure of 100 kPa of CO2confirms the mechanical and calcimeter parts that this pressure is the optimal pressure for absorption(Tchakoute Kouamo et al.,2012;Skocek et al.,2020;Santos et al.,2021).
4.4.XRD analysis
The XRD pattern of carbonated and non-carbonated samples in both oven and AC conditions is presented in Fig.12.Many crystalline peaks can be seen,indicating the presence of N-A-S-H,Albite high (heated),quartz and chabazite can be formed in all samples due to the syntheses of geopolymer materials from natural aluminosilicate (Sindhunata et al.,2006;Chen et al.,2018;Zhang et al.,2019).Calcite is one of the main products after carbonation,and it is observed in P3(P20D80-7O1)and P4(P20D80-7A1)due to the carbonation time (Cai et al.,2016;Shariatmadari et al.,2021a;Zhong et al.,2021).Another main product of the carbonation process with different crystalline structure is aragonite tracked in P3 and P4 samples.Although it is expected that vaterite would be the first crystalline peak of CaCO3during the carbonation,vaterite has been converted to calcite and aragonite phases due to its instability(Mo and Panesar,2012;Zhang et al.,2019).Also,hydrated minerals such as portlandite are observed which is prone to reacting during carbonation.However,the portlandite peaks are weak due to slow hydration rate of volcanic ash.Portlandite peaks gradually disappear because of the conversion of Ca(OH)2into calcite and aragonite after carbonation in carbonated samples (Huijgen et al.,2006;Özbay et al.,2016;Wang et al.,2019;Zhong et al.,2021).Generally,it can be seen that the intensity of peaks has been weakened in P9(P10D80-7O1)and P10(P10D80-7A1)with respect to P3(P20D80-7O1) and P4 (P20D80-7A1),due to less binder content of volcanic ash which leads to less geopolymeric gel and carbonate content(Wang et al.,2019).It is also observed that crystalline structures of P5 (P20D80-7O3) and P6 (P20D80-7A3) are not much different from P3 (P20D80-7O1) and P4 (P20D80-7A1),although they are placed in different CO2pressures.Therefore,it can be concluded that the CO2pressure of 100-300 kPa has no significant difference in the results and the pressure of 100 kPa can be considered as the optimal pressure for gaining strength and precipitating carbonation products (Fasihnikoutalab et al.,2016,2017a).

Fig.12.XRD pattern of selected samples.
4.5.SEM-EDS characterization
The SEM micrographs of the samples cured in AC conditions is shown in Fig.13.As observed in the XRD results,geopolymer gels(including quartz and albite phases)are formed in P2 specimen(see Fig.13a).In P4 specimen,a carbonated sample under 100 kPa CO2pressure,the phases resulting from the CO2exposure such as calcite and aragonite can be seen with rhombohedral,cubical,and needlelike structures,respectively (Wong et al.,2020;Mohammed et al.,2021).Aragonite is usually formed in relative high temperatures in comparison with calcite (Mohammed et al.,2021).The microstructure and morphology of P6 and P4 samples are similar,although they experience different CO2pressures (Fig.13b-c).Blocky calcite structure is the dominant structure in both samples(Song et al.,2017;Hu et al.,2018).The less amount of binder content resulted in less compact microstructure of P10 specimen with 10 wt%binder content in comparison with P4 specimen with 20 wt% binder content (Fig.13d).In other words,the phases resulting from carbonation are not fully developed in P10 compared to P4(Wang et al.,2019;Liu and Meng,2021).
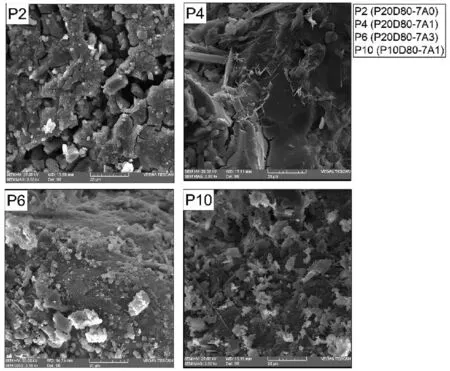
Fig.13.SEM micrographs of selected samples cured in AC conditions.
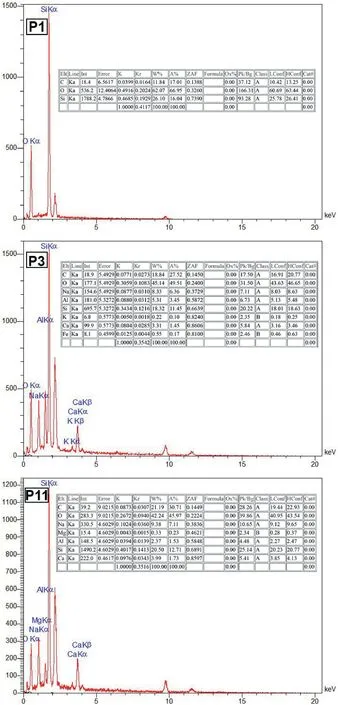
Fig.14.EDS analysis of selected samples cured in OC conditions.
EDS and elemental mapping analyses of three samples P1,P3 and P11,cured in OC conditions are shown in Figs.14 and 15,respectively.It can be observed that in sample P1,which is a noncarbonated sample,only geopolymeric gels are formed and silicon and oxygen and carbon elements in this sample have a high content.However,for sample P3,it is similar to sample P1 in its constituent materials,but carbonated under 100 kPa of CO2gas pressure.It can be seen that the percentage of elements forming carbonate compounds(such as calcium)has increased and the N-AS-H gel has been formed in a larger amount in the sample P3 than the sample P1 because of broad distribution of alkaline metals like Na according to Fig.15 (Minelli et al.,2016;Ghadir and Razeghi,2022).Although sample P11 is similar to sample P3 in all cases except for the curing time(sample P3 cured for 7 d and sample P11 for 14 d),it should be noted that in sample P11,the water needed for carbonation and forming carbonated products has disappeared.For this,the percentage of carbonated compound elements has decreased compared to sample P3 (Vandeperre and Al-Tabbaa,2007;Minelli et al.,2016;Özbay et al.,2016).

Fig.15.Elemental mapping analysis of selected samples cured in OC conditions.
5.Discussion
In order to elaborate on the CO2exposure effect,Fig.16 proposes a hypothetical project as a landfill where a considerable amount of CO2is released.Therefore,the carbonation process can be implemented to stabilize the cover layer of the landfill.Fig.16 illustrates the carbonation in four general stages.Fig.16a shows the soil particles exposed to CO2gas.In the second stage,the volcanic ash and an alkali activator (including water) are added to the soil,as shown in Fig.16b.The alkali activator like water activates the geopolymer based on volcanic ash by breaking the bond Si-O and Al-O,resulting in forming N-A-S-H gel as shown in Fig.16c(Ghadir et al.,2021;Miraki et al.,2022).Note that the CO2cannot react with free ions like Ca2+directly,so the CO2dissolved in a thin layer of moisture called diffusion length surrounding the volcanic ash particle which leads to the formation of H2CO3as shown in Fig.16c(2) (Kim and Kwon,2019).In the fourth and final stage,the carbonation products like CaCO3are formed and bind the soil particles in combination with N-A-S-H gel in geopolymer base volcanic ash.

Fig.16.Schematic diagram of carbonation using volcanic ash in hypothetical project.
6.Conclusions
This study evaluated the effect of CO2exposure on the mechanical features of sandy soil stabilized with volcanic ash-based geopolymer.It was demonstrated that CO2exposure has a promising positive effect on the mechanical properties of sandy soils stabilized with volcanic ash based geopolymer.The following conclusions can be obtained from the results presented in this study:
(1) The amount of carbonate and bicarbonate products directly depend on the binder content of the samples and it increases with increasing volcanic ash content up to about 30 wt%.
(2) From the quantitative perspective of carbonation products,the findings suggest that there is no significant difference between the pressure of 100-300 kPa of CO2.As a result,it can be inferred that the saturation point of CO2is reached at a certain pressure level,indicating no further increase in soil strength.In essence,the sample attains a state of CO2saturation,characterized by no further capacity for additional strength.
(3) Volcanic ash based geopolymer has an optimum performance and higher mechanical strength in OC than that in AC condition.In other words,the carbonation process is more efficient and produces more carbonate and bicarbonate compounds in OC conditions.However,in the OC condition,after 7 d curing,the required water for carbonation gradually decreases and the carbonation process is not as efficient as in the first 7-d curing age.
(4) In a low relative density,the pores of the sample are larger and allow more CO2molecules to penetrate the sample in order to form carbonate and bicarbonate compounds.
(5) No considerable difference is observed among various CO2pressures in the strength development of carbonated samples.As a result,100 kPa of CO2pressure can be considered the optimum pressure for carbonation among the others because of lower cost and lower energy requirement.
Declaration of competing interest
The authors declare that they have no known competing financial interests or personal relationships that could have appeared to influence the work reported in this paper.
Acknowledgment
The authors would like to appreciate the efforts of Eng.Salar Khoramdel and Professor Nader Shariatmadari (RIP).This study was supported by MatSoil Company (Grant No.04G/2022).This research was funded by the European Union’s Horizon 2020 research and innovation program under the Marie Sklodowska-Curie (Grant No.778120).
 Journal of Rock Mechanics and Geotechnical Engineering2024年2期
- Journal of Rock Mechanics and Geotechnical Engineering的其它文章
- Determination of uncertainties of geomechanical parameters of metamorphic rocks using petrographic analyses
- Evaluation of excavation damaged zones (EDZs) in Horonobe Underground Research Laboratory (URL)
- On the calibration of a shear stress criterion for rock joints to represent the full stress-strain profile
- Effect of dynamic loading orientation on fracture properties of surrounding rocks in twin tunnels
- Experimental study on the influences of cutter geometry and material on scraper wear during shield TBM tunnelling in abrasive sandy ground
- Effect of fracture fluid flowback on shale microfractures using CT scanning