葡萄悬浮细胞长期培养过程中不同继代条件下花青素生产的不稳定性
2011-02-26 13:20曲均革张卫虞星炬
生物工程学报 2011年11期
曲均革,张卫,虞星炬
1 中国科学院大连化学物理研究所,大连 116023
2 浙江医药高等专科学校,宁波 315100
3 澳大利亚弗林德斯大学医学院,阿德雷德 SA5042
Introduction
Higher plants are a valuable source of numerous secondary metabolites which are used as pharmaceuticals, agrochemicals, flavors, fragrances, colors, pesticides and food additives[1-3]. As a promising technology for the production of these bioactive chemicals, plant cell culture has many prominent advantages over extraction from whole plants and chemical synthesis[4-7]. However, the commercialization of plant cell culture has rarely been realized[4,8]. One of the impediments to the scale-up is the metabolic variability in plant cell culture, resulting in highly unstable production of secondary metabolites of interest[5]. The instability of plant cell cultures is a ubiquitous problem that has been widely observed during long-term successive subcultures[9-16]. But the understanding of the mechanisms is very limited. A number of mechanisms have been proposed, including inherent heterogeneity of the source explant material, genetic and epigenetic instability, environmental stress, lack of tissue differentiation, involvement of chemical signal[13,15-18]. However, lack of experimental validation prevents a unified understanding of mechanisms causing instability.
Anthocyanins are a group of water-soluble pigments visible to the human eye that belong to the widespread class of phenolic compounds collectively named flavonoids[19]. They are widely applied to food, cosmetics, nutriceutical and potential pharmaceutical components for treatment of cancer and heart disease[5]. They are glycosides of polyhydroxy and polymethoxy derivatives of 2-phenylbenzopyrylium or flavylium salts. The differences among individual anthocyanins relate to the quantity of hydroxyl groups, the nature and quantity of sugars attached to the molecule, the position of this attachment, and the nature and quantity of aliphatic or aromatic acids attached to sugars in the molecule[5,19-20]. Because of anthocyanins are visible to the human eye, it makes the screening of cell lines with different anthocyanin-producing capabilities simple. At the same time, the extraction and analysis of anthocyanins are easy. So a systematic investigation of anthocyanins accumulation in suspension cultures of Vitis vinifera, as a model system, has been initiated in our laboratory to understand the production instability of secondary metabolites in plant cell culture. Here we used the model system to examine the instability of anthocyanins accumulation and to test whether the instability was driven by the fluctuations and variations in culture conditions such as subculture cycle and inoculum size. The investigation was launched with the purpose of understanding the causes of the metabolic instability and researching the optimal culture conditions to keep the stable anthocyanins biosynthesis in suspension cultures of Vitis vinifera.
1 Materials and methods
1.1 Suspension cell line and subculture conditions
The cell line used in this study was developed by Cormier et al[21], originating from callus established in 1978 from Vitis vinifera L. cv. Gamay Fréaux var. teinturier berry pulp. This cell line, capable of anthocyanins accumulation in the dark, was a gift from Dr. Francois Cormier’s group (Quebec, Canada). It has been subcultured in our laboratory for nine years[16]. In this experiment, the suspension cultures were cultured in 100-mL Erlenmeyer flasks containing 20 mL B5 medium[22], supplemented with 30 g/L sucrose, 250 mg/L casein hydrolysate, 0.1 mg/L α-naphthaleneacetic acid (NAA) and 0.2 mg/L kinetin (K), the pH adjusted to 5.7−5.8 before autoclaving. Here two factors, subculture cycles and inoculum sizes were respectively studied during 10 successive subcultures. In the sub-experiment of subculture cycles, suspension cells were subcultured at the intervals of 6.5 d, 7 d, 7.5 d, respectively, and with the same inoculation size of 2.00 g wet cells prepared by filtering with a 50-µm mesh. In another sub-experiment of inoculum sizes study, the inoculum size was respectively 1.60 g, 2.00 g and 2.40 g wet cells prepared as above and subcultured every 7 days. Every time when subcultured, 6 flasks suspension cells were inoculated, among these 3 flasks were used for subcultured next time and another 3 flasks were used for analysis after this subculture cycle. All the subcultures were maintained in dark on a reciprocating shaker at 100 r/min and (25±1) °C.
1.2 Biomass analysis
At the end of every subculture cycle, 3 flasks were sampled for biomass and anthocyanins accumulation analysis. Firstly, the cultures were harvested by vacuum filtration through filter paper, washed with MilliQ water and weighed to obtain the fresh cell weight (FCW). Then some cell aggregate was kept for anthocyanins analysis and the other cells were put into the 80 °C-oven overnight to gain the dry cell weight (DCW).
1.3 Mixed anthocyanins content by spectrophotometer
To analyze the total anthocyanins content, 0.2 g fresh cells were sampled after vacuum filtration and extracted with 50% acetic acid solution, with a volume equivalent to 20 times the fresh cell weight, for 1-h period at room temperature[16]. After filtering through a 0.22-µm filter, 3 mL of the filtrate was mixed with 9 mL of McIIvaine’s buffer (14.7 g/L Na2HPO4·12H2O and 16.7 g/L anhydrous citric acid) and the pH adjusted to 3.0. The absorbance of the resulting solution was measured at 535 nm with 50% acetic acid: McIIvaine’s buffer (1∶3) was used as the blank control. The color value (CV) of the pigment extract, a commercial indicator of anthocyanins, was calculated by the following formula:
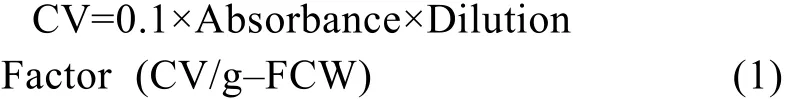
In the above-described procedure, the dilution factor was 80. The CV allows for the accurate and comparative quantification of anthocyanins produced from a mixture of different pigments, as is the case for many cell cultures.
1.4 Anthocyanins composition analysis by HPLC
High Performance Liquid Chromatography was undertaken to examine anthocyanins composition, using the Agilent 1 100 series system and HPCore Chemstation. 10 μL of 50% acetic acid extracts that have been syringe-filtered through 0.22 μm membranes was injected onto a Hypersil ODS column (4.6 mm×250 mm, dp=5 μm). Anthocyanins were eluted according to the method of Yoshinaga[23], utilizing Buffer A (1.5% H3PO4in H2O) and Solvent B (1.5% H3PO4, 20% acetic acid, 25% acetonitrile in H2O). A linear gradient of 25 to 85% Solvent B in Buffer A was run for 40 minutes at 1.0 mL/min, followed by an equilibration period of 10 minutes at 25% Solvent B in Buffer A. Detection was at 520 nm using a photo-diode array detector.
1.5 Data processing
Microsoft Excel 2000 and SPSS 13.0 were used for data processing.
2 Results and discussion
2.1 Anthocyanins measured by spectrophotometer and HPLC
The majority of researches about Anthocyanins are quantified by spectrophotometer[24-30]and High Performance Liquid Chromatography[12,31-34]. Fig. 1 shows the HPLC profiles of anthocyanins in our suspension cultures of Vitis vinifera. Fourteen kinds of anthocyanins were separate and quantified from the extract.
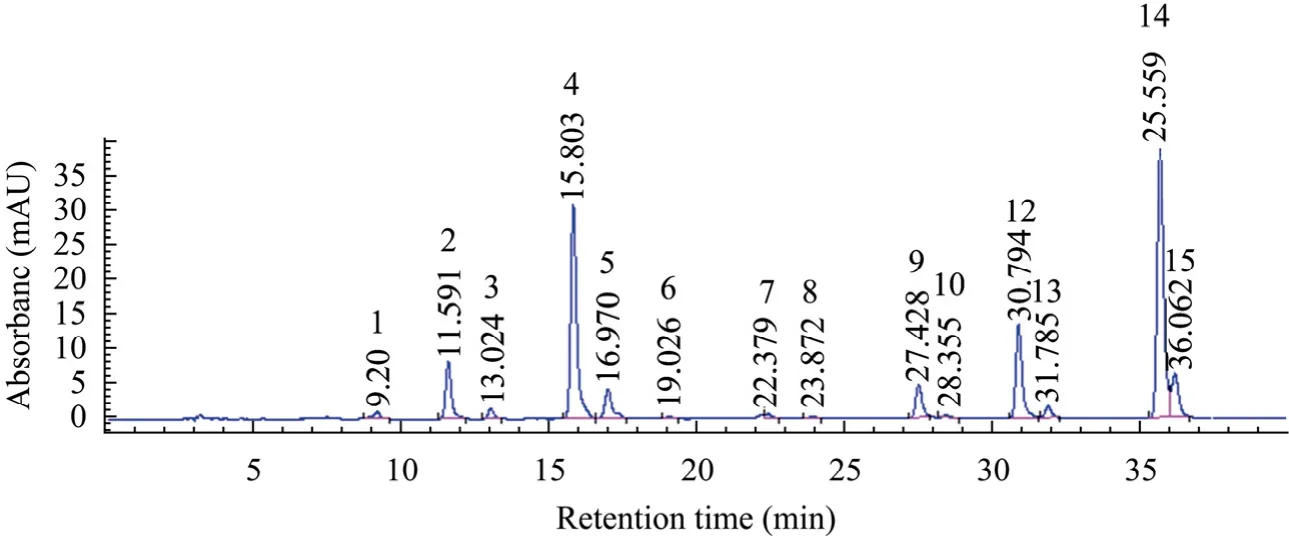
Fig. 1 HPLC profiles of anthocyanins in suspension cultures of Vitis vinifera at wavelength of 520 nm. Peaks with labels represent P1: Delphinidin 3-glucoside (D3G); P2: Cyanidin 3-glucoside (C3G); P3: Petunidin 3-glucoside (Pet3G); P4: Peonidin 3-glucoside (Peo3G); P5: Malvidin 3-glucoside (M3G); P6: Delphinidin 3-acetylglucosid (D3AcG); P7: Cyanidin 3-acetylglucosid (C3AcG); P8: Petunidin 3-acetylglucosid (Pet3AcG); P9: Peonidin 3-acetylglucosid (Peo3AcG); P10: Delphinidin 3-coumaroylglucoside (D3CoumG); P11: Cyanidin 3-coumaroylglucoside (C3CoumG); P12: Petunidin 3-coumaroylglucoside (Pet3CoumG); P13: Peonidin 3-coumaroylglucoside (Peo3CoumG); P14: Malvidin 3-coumaroylglucoside (M3CoumG).
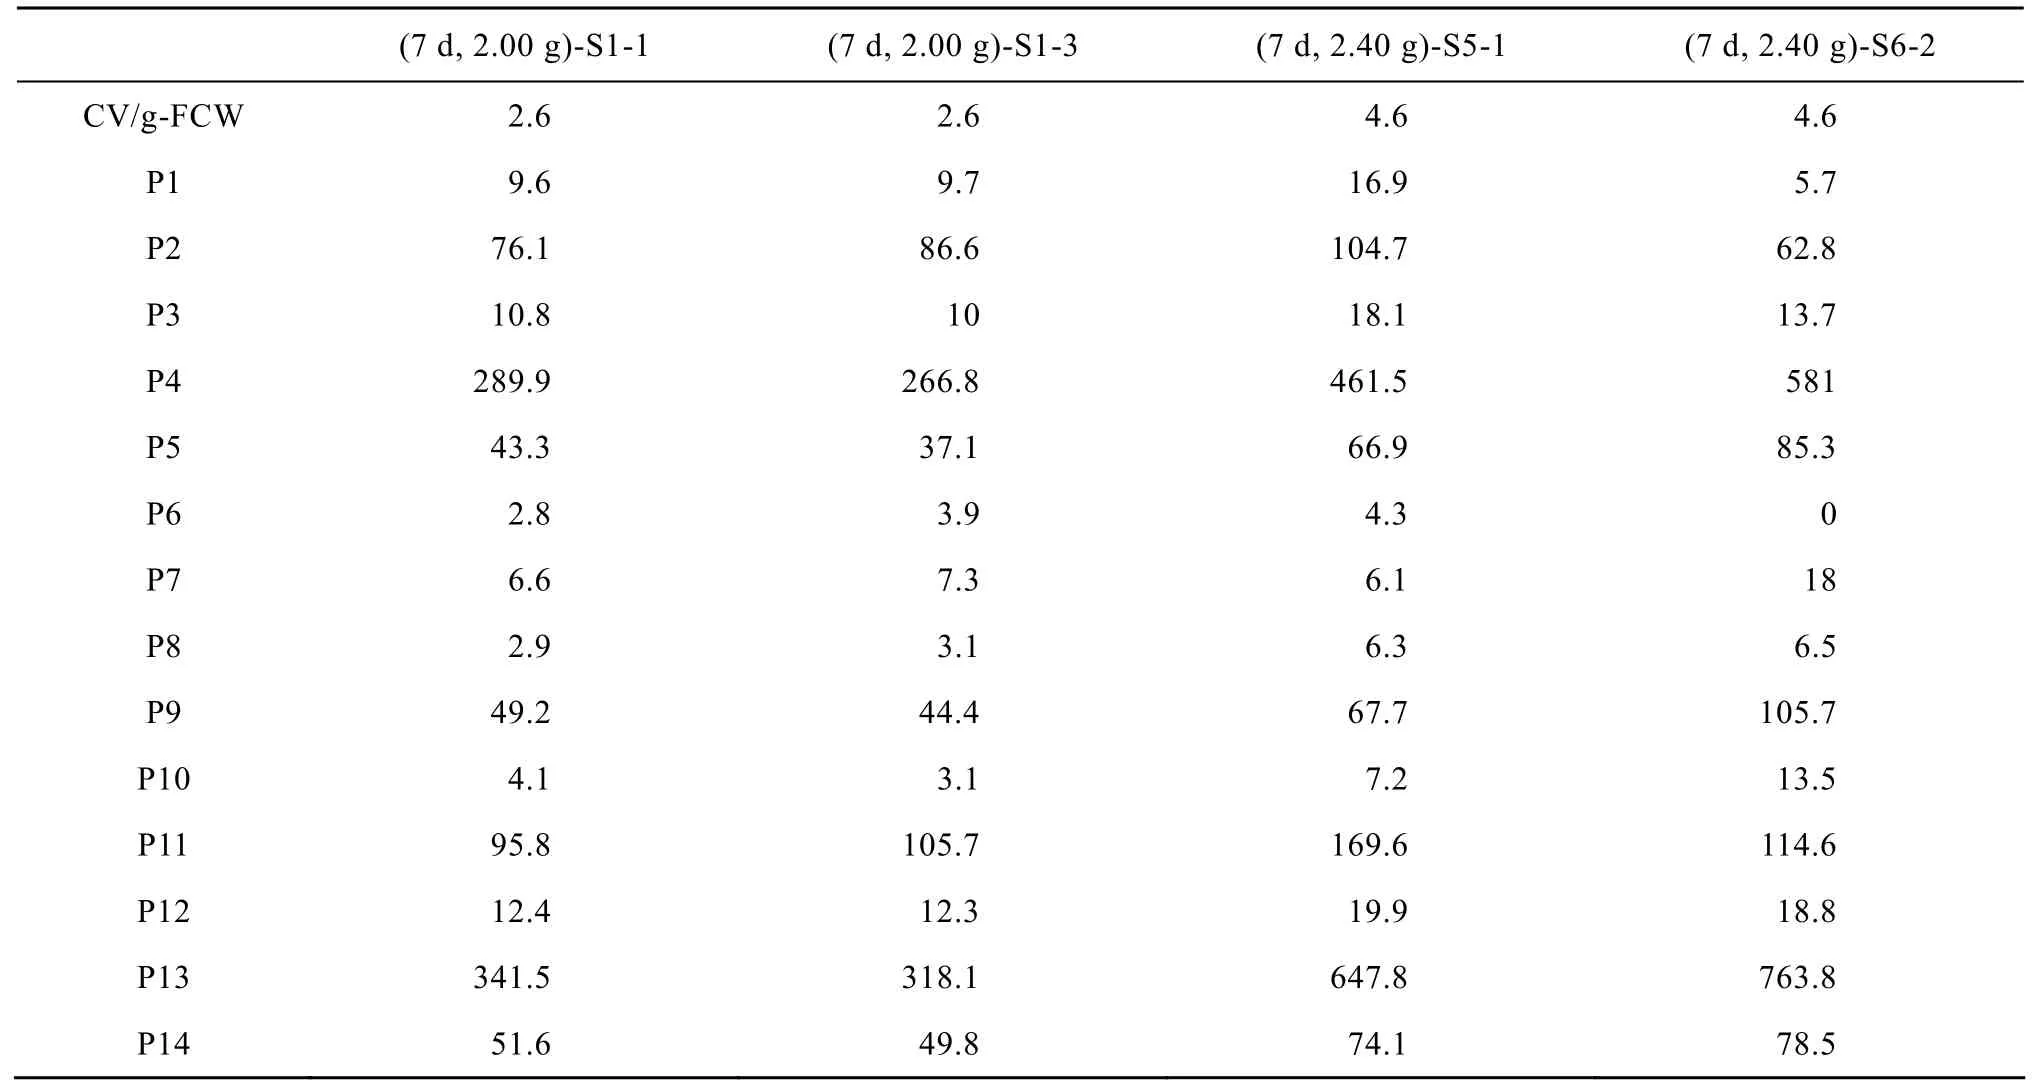
Table 1 Differences of anthocyanins contents measured by spectrophotometer (CV/g-FCW) with by HPLC (Area) in suspension cultures of Vitis vinifera
Table 1 shows some extract that presented the same anthocyanins content measured by spectrophotometer but different contents for each anthocyanin composition measured by HPLC. For example, (7 d, 2.00 g)-S1-1 and (7 d, 2.00 g)-S1-3 were two of the three repeated samples which have the same anthocyanins content of 2.6 CV/g-FCW in terms of spectrophotometer. But when examined by HPLC, none of the corresponding contents of the fourteen anthocyanins composition were equal to each other. (7 d, 2.00 g)-S1-1 had lower contents for delphinidin 3-glucoside (P1), cyanidin 3-glucoside (P2), delphinidin 3-acetylglucosid (P6), cyanidin 3-acetylglucosid (P7), petunidin 3-acetylglucosid (P8), cyanidin 3-coumaroylglucoside (P11) and higher contents for the other anthocyanins composition than (7 d, 2.00 g)-S1-3. As for the example of (7 d, 2.40 g)-S5-1 and (7 d, 2.40 g)-S6-2 which had the same anthocyanins content of 4.6 CV/g-FCW by means of spectrophotometer, there were obvious differences among the contents of anthocyanins composition measured by HPLC. Firstly, HPLC profiles were absent from delphinidin 3-acetylglucosid (P6) in (7 d, 2.40 g)-S6-2, whereas present in (7 d, 2.40 g)-S5-1. Secondly, (7 d, 2.40 g)-S5-1 had lower contents for peonidin 3-glucoside (P4), malvidin 3-glucoside (P5), cyanidin 3-acetylglucosid (P7), petunidin 3-acetylglucosid (P8), peonidin 3-acetylglucosid (P9), delphinidin 3-coumaroylglucoside (P10), peonidin 3-coumaroylglucoside (P13), malvidin 3-coumaroylglucoside (P14) and higher contents for the other anthocyanins composition than (7 d, 2.40 g)-S6-2. In addition, the differences of HPLC profiles between the two samples are remarkable. For instance, the peak area of delphinidin 3-glucoside (P1) was 16.9 in (7 d, 2.40 g)-S5-1 and 5.7 in (7 d, 2.40 g)-S6-2 and the former was 3-fold of the latter. However, the HPLC area of cyanidin 3-acetylglucosid (P7) was 6.1 in (7 d, 2.40 g)-S5-1 and 18 in (7 d, 2.40 g)-S6-2 and the former was one third of the latter. Since the absorbance by spectrophotometer represents the mixture of all anthocyanins and HPLC separate each of the anthocyanins before quantification, the HPLC profiles can give a more accurate and more comprehensive characterization about anthocyanins.
2.2 Instability of anthocyanins accumulation in successive subcultures of Vitis vinifera
Instability of secondary metabolite production is a common phenomenon in plant cell culture. In order to understand the production instability of secondary metabolites in plant cell culture, a systematic investigation of anthocyanins accumulation in suspension cultures of Vitis vinifera, as a model system, had been initiated in our laboratory. In our previous study, the unstable accumulation of anthocyanins had been observed[16]. There the anthocyanins content was measured by spectrophotometer and expressed by Color Value. Here High Performance Liquid Chromatography was applied to separate and quantify the anthocyanins. To illustrate the anthocyanins composition in ten successive subcultures in suspension cultures of Vitis vinifera, the HPLC profiles of suspension cultures under condition of (7.5 d, 2.00 g), that meant 7.5 d-subculture cycle together with 2.00 g-inoculum size was given as an example (Table 2). On the one hand, the instability of a specific anthocyanin biosynthesis during long-term subcultuers could be seen. For example, the HPLC areas of delphinidin 3-glucoside (P1) in the successive subcultures changed from 13.5 to 6.5, 3.5, 5.0, and so on. Besides this, the accumulation of other anthocyanin component fluctuated obviously during long-term subcultures. On the other hand, variability of anthocyanins composition between subcultures could be seen in Table 2. For example, in the 1st subculture, the contents of malvidin 3-glucoside (P5), cyanidin 3-acetylglucosid (P7), petunidin 3-acetylglucosid (P8), peonidin 3-acetylglucosid (P9) and delphinidin 3-coumaroylglucoside (P10) were lower and the other anthocyanins contents were higher than those in the 2nd subculture. The HPLC profiles of successive subcultures showed that the anthocyanin contents fluctuated both within and between subcultures.
2.3 Effects of different subculture cycles and different inoculum sizes on instability of anthocyanins accumulation in suspension cultures of Vitis vinifera
The instability of secondary metabolites production in plant cell culture is a bottleneck to the scale-up. For the complexity of the causations that result in the instability of secondary metabolites, studying the mechanisms of the instability is difficult in plant cell culture. The instability problem has been widely acknowledged, but the understanding of its mechanisms or causes is still poor. Here we investigated the factors that could bring the instability of anthocyanins production and then finding the best culture conditions for the stable production in suspension cultures of Vitis vinifera.
Fig. 2 showed the instability of anthocyanins accumulation in suspension cultures of Vitis vinifera in different subculture conditions measured by spectrophotometer. The results were consistent with our previous researches and this had been proved to be due to plant cell cultures are heterogeneous with various cell subpopulations that have differentialgrowth potential and biosynthetic capacity[16]. In order to compare the effects of different subculture conditions on anthocyanins biosynthesis, we introduce instability coefficient which is defined as:
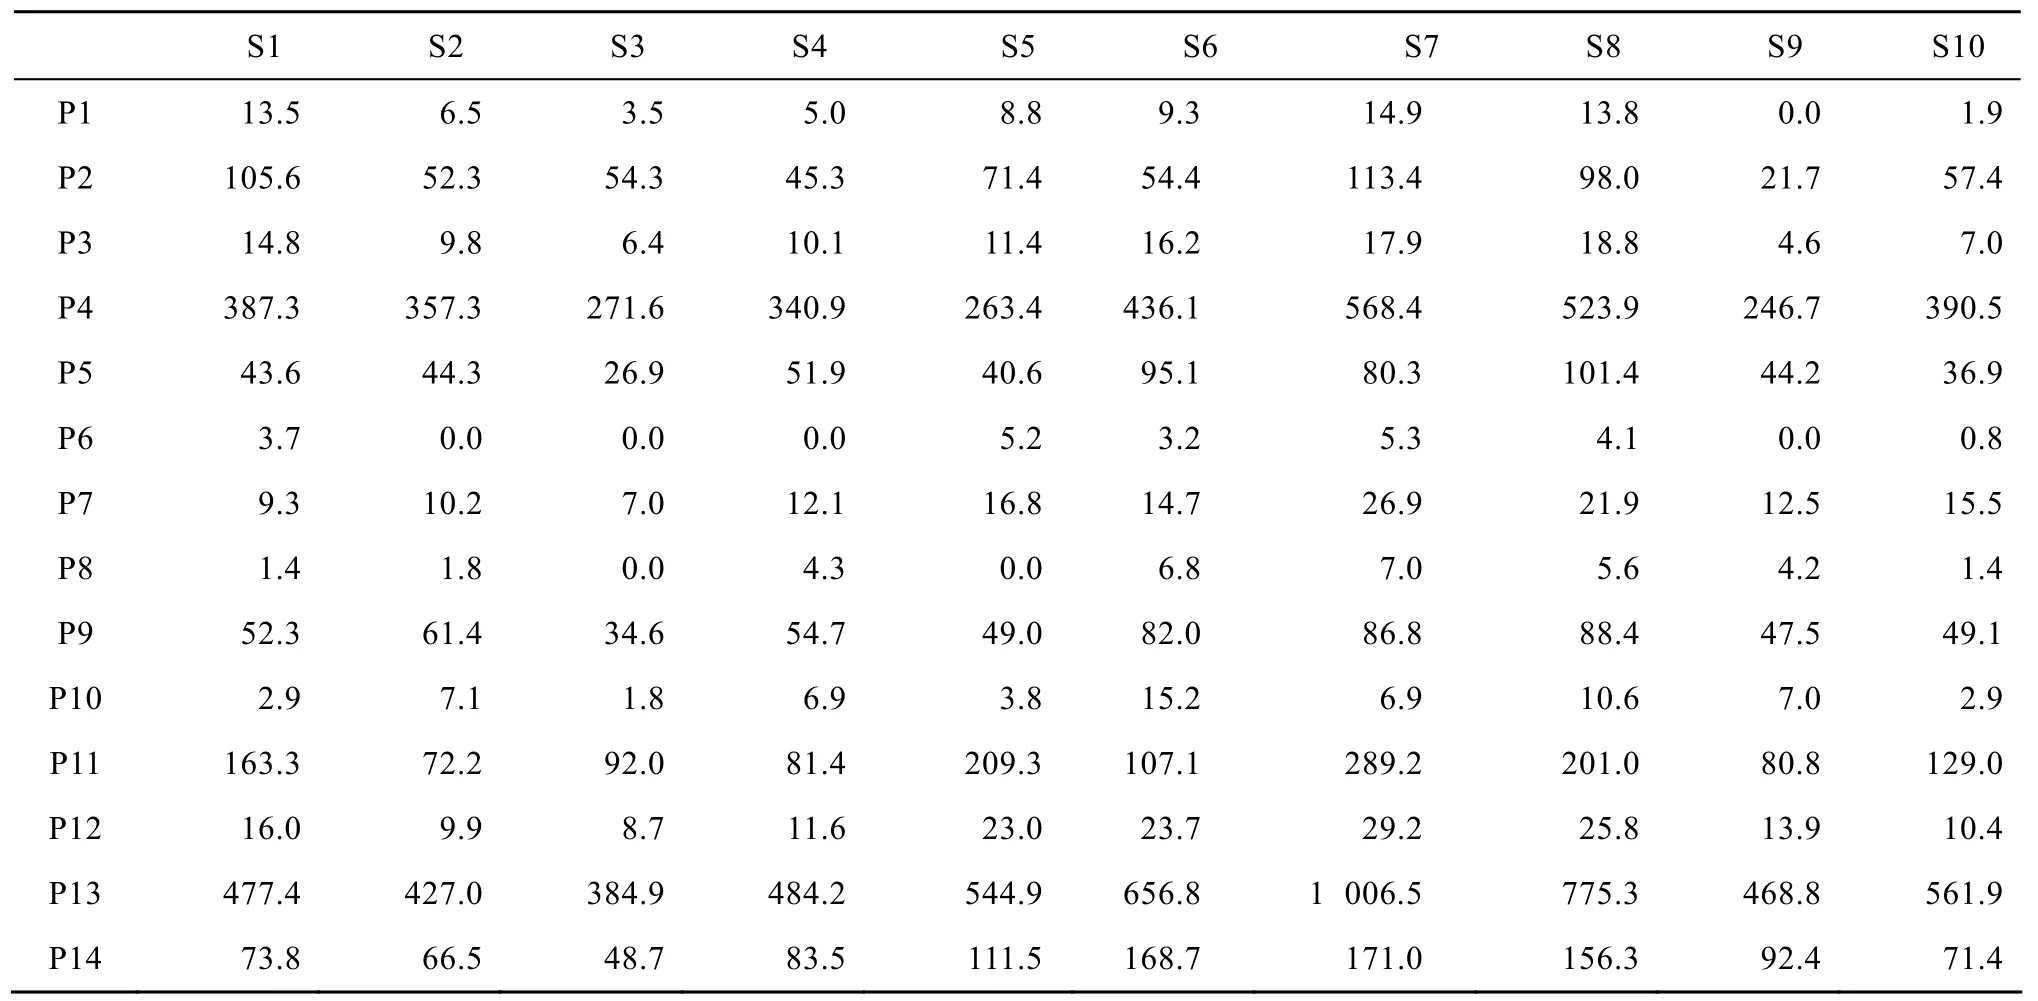
Table 2 Anthocyanins composition in ten successive subcultures in the condition of 7.5 d-subculture cycle together with 2.00 g-inoculum size in suspension cultures of Vitis vinifera
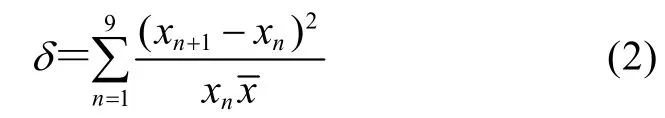
Here δ means instability coefficient; xnand xn+1mean anthocyanins accumulation in subculture n and subculture (n+1), respectively.means the average of anthocyanins contents in ten successive subcultures of Vitis vinifera.
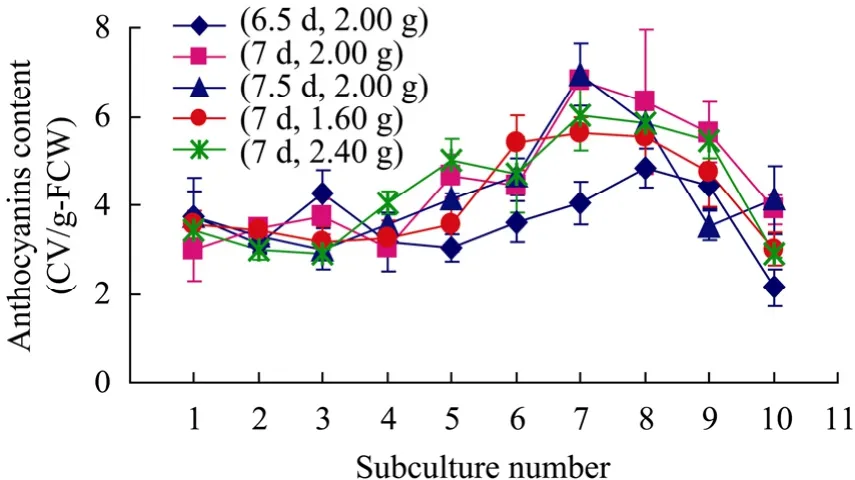
Fig. 2 Instability of anthocyanins accumulation in suspension cultures of Vitis vinifera in different subculture conditions measured by spectrophotometer. Data presented as deviation of three replicate samples.
In our previous research, variation coefficient was used as a quantitative indicator of the instability of anthocyanin accumulation between subcultures which is defined as standard deviation divided by the mean of anthocyanins content[16]. We can conclude from both definitions that instability coefficient is a much more reasonable indicator in describing the instability of secondary metabolite production in plant cultures than variation coefficient for it not only reflects the whole information of the samples but also takes the sample order into consideration. The bigger instability coefficient is, the more instable the anthocyanins accumulation is. The instability coefficients of anthocyanins accumulation under conditions of different subculture cycles and different inoculum sizes could be seen in Table 3. When inoculum size was fixed to 2.00 g, the instability coefficients of 10 successive subcultures for different subculture cycles were almost unchangeable. It was 0.65, 0.68 and 0.62 for subculture cycle of 6.5 d, 7 d and 7.5 d respectively. However, when subculture cycle was fixed to 7 d, the instability coefficients of 10 successive subcultures for different inoculum sizes changed a lot. Whether the inoculum size was lower or higher than 2.00 g, the instability coefficients of anthocyanins accumulation both depressed. It was 0.68 for inoculum size of 2.00 g, while 0.44 and 0.54 for inoculum size of 1.60 g and 2.40 g, respectively. This showed that inoculum size had a more remarkable effect on instability of anthocyanins biosynthesis than subculture cycle. Among all the subculture conditions examined, 7 d-subculture cycle together with 1.60 g-inoculum size was the best one to keep the stable anthocyanins accumulation in suspension cultures of Vitis vinifera.
As mentioned above, HPLC method can provide more accurate and more comprehensive information about anthocyanins. But the abundance of the variables makes the data analysis more complicated. As shown in Fig. 3, it is obvious that the instability of anthocyanins composition in 10 successive subcultures of Vitis vinifera. When take the 4th subculture as an example, we can see production of peonidin 3-coumaroylglucoside (P13) was the highest in all ten subcultures, while the other anthocyanins composition were much lower or even the lowest. So it is difficult to make a summary or find the inherent laws of the anthocyanins biosynthesis from the excessive data.Factor analysis is an effective statistic method for dealing with multi-variables. It is used to find latent variables or factors among observed variables by grouping variables with similar characteristics together. With factor analysis a small number of factors can be produced from a large number of variables. The factors extracted are not the actually measured variables, but they represent most information of the original data and can be used for further analysis to explain the nature of the studies much more effectively.

Table 3 Instability coefficients of anthocyanins contents (CV/g-FCW) in ten successive subcultures of Vitis vinifera under different subculture conditions measured by spectrophotometer

Fig. 3 Instability of anthocyanins composition in 10 successive subcultures of Vitis vinifera under condition of 7d-subculture cycle together with 2.00 g-inoculum size measured by HPLC. Series number represents 1: Delphinidin 3-glucoside (D3G); 2: Cyanidin 3-glucoside (C3G); 3: Petunidin 3-glucoside (Pet3G); 4: Peonidin 3-glucoside (Peo3G); 5: Malvidin 3-glucoside (M3G); 6: Delphinidin 3-acetylglucosid (D3AcG); 7: Cyanidin 3-acetylglucosid (C3AcG); 8: Petunidin 3-acetylglucosid (Pet3AcG); 9: Peonidin 3-acetylglucosid (Peo3AcG); 10: Delphinidin 3-coumaroylglucoside (D3CoumG); 11: Cyanidin 3-coumaroylglucoside (C3CoumG); 12: Petunidin 3-coumaroylglucoside (Pet3CoumG); 13: Peonidin 3-coumaroylglucoside (Peo3CoumG); 14: Malvidin 3-coumaroylglucoside (M3CoumG).
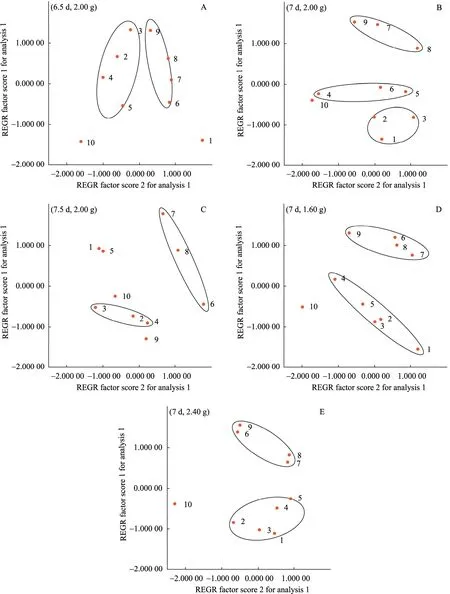
Fig. 4 Factor scores of anthocyanins accumulation in suspension cultures of Vitis vinifera in different subculture conditions of (6.5 d, 2.00 g) (A), (7 d, 2.00 g) (B), (7.5 d, 2.00 g) (C), (7 d, 1.60 g) (D) and (7 d, 2.40 g) (E) by factor analysis of SPSS 13.0. The dot represented the anthocyanins composition by high-performance liquid chromatographic analysis in each subculture.
Fig. 4 shows the factor scores of anthocyanins biosynthesis in ten successive subcultures for each subculture cycle and inoculum size condition. Every dot in the plot can represent all the anthocyanins composition measured by HPLC in corresponding subculture. So the distribution of factor scores in the successive subcultures can indicate the instability of anthocyanins accumulation. The more scattered the distribution is, the more instable the anthocyanins biosynthesis is. Here we express the distribution of the factor scores by sum of distances between the dots representing the adjacent subcultures in the plot of factor scores. By measuring and summing up all the distances between the data points of the adjacent subcultures, the instability of anthocyanins accumulation in ten successive subcultures for each condition can be indicated. By this means, the distances relative to each other for each subculture condition of (6.5 d, 2.00 g), (7 d, 2.00 g), (7.5 d, 2.00 g), (7 d, 1.60 g) and (7 d, 2.40 g) were 19.9, 21.7, 25.7, 16.3 and 17.2, respectively. So among all the subculture conditions that had been investigated, (7 d, 1.60 g) is the best one to keep the stability of anthocyanins biosynthesis in suspension cultures of Vitis vinifera.
In conclusion, HPLC is a better means to quantification of anthocyanins when compared with spectrophotometer for its profiles can give a more accurate and more comprehensive characterization about anthocyanins composition. Not only the anthocyanins contents but also its composition exhibited instability along with the continuous subculture. Subculture cycle and inoculum size are both environmental cues driving the instability. Among all the conditions investigated in our study, the condition of 7 d-subculture cycle together with 1.60 g-inoculum size was the best one to keep the stable production of anthocyanins. Compared with subculture cycle, inoculum size was more effective in working on the instability of anthocyanins accumulation in suspension cultures of Vitis vinifera. For a given suspension cultures, systemic investigation of the culture conditions such as temperature, light, shear stress, inoculum size and age, gaseous composition, medium components and culture practice will help to find the optimal condition to keep the stable production of secondary metabolites and this is a prerequisite for commercialization of plant cell cultures.
[1] Verpoorte R, van der Heijden R, Memelink J. Engineering the plant cell factory for secondary metabolite production. Transgen Res, 2000, 9(4/5): 323−343.
[2] Dai J, Patel JD, Mumper RJ. Characterization of blackberry extract and its antiproliferative and anti-inflammatory properties. J Med Food, 2007, 10(2): 258−265.
[3] Yue CJ, Zhong JJ. Purification and characterization of UDPG: ginsenoside Rd glucosyltransferase from suspended cells of Panax notoginseng. Process Biochem, 2005, 40(12): 3742−3748.
[4] Verpoorte R, van der Heijden R, ten Hoopen HJG, et al. Metabolic engineering of plant secondary metabolite pathways for the production of fine chemicals. Biotechnol Lett, 1999, 21(6): 467−479.
[5] Zhang W, Furusaki S. Production of anthocyanins by plant cell cultures. Biotechnol Bioprocess Eng, 1999, 4(4): 231−252.
[6] Rao SR, Ravishankar GA. Plant cell cultures: Chemical factories of secondary metabolites. Biotechnol Adv, 2002, 20(2): 101−153.
[7] Zhong JJ. Plant cell culture for production of paclitaxel and other taxanes. J Biosci Bioeng, 2002, 94(6): 591−599.
[8] Roberts SC, Shuler ML. Large-scale plant cell culture. Curr Opin Biotechnol, 1997, 8(2): 154−159.
[9] Deus-Neumann B, Zenk MH. Instability of indole alkaloid production in Catharanthus roseus cell suspension cultures. Planta Medica, 1984, 50(5): 427−431.
[10] Vogelien DL, Hrazdina G, Reevers S, et al. Phenotypic differences in anthocyanin accumulation among clonally related cultured cells of carrot. Plant Cell Tiss Org Cult, 1990, 22(3): 213−222.
[11] Qu JG, Zhang W, Hu QL, et al. Impact of subculture cycles and inoculum sizes on suspension cultures of Vitis vinifera. Chin J Biotech, 2006, 22(6): 984−989.曲均革, 张卫, 胡全利, 等. 继代周期和接种量对葡萄细胞培养的影响. 生物工程学报, 2006, 22(6): 984−989.
[12] Callebaut A, Terahara N, de Haan M, et al. Stability of anthocyanin composition in Ajuga reptans callus and cell suspension cultures. Plant Cell Tiss Org Cult, 1997, 50(3): 195−201.
[13] Qu JG, Zhang W, Jin MF, et al. Effect of Homogeneity on Cell Growth and Anthocyanin Biosynthesis in Suspension Cultures of Vitis vinifera. Chin J Biotech, 2006, 22(5): 805−810.曲均革, 张卫, 金美芳, 等. 细胞均一性对葡萄细胞生长和花青素合成的影响. 生物工程学报, 2006, 22(5): 805−810.
[14] Ketchum REB, Gibson DM, Croteau RB, et al. The kinetics of taxoid accumulation in cell suspension cultures of Taxus following elicitation with methyl jasmonate. Biotechnol Bioeng, 1999, 62(1): 97−105.
[15] Kim BJ, Gibson DM, Shuler ML. Effect of subculture and elicitation on instability of taxol production in Taxus sp. suspension cultures. Biotechnol Prog, 2004, 20(6): 1666−1673.
[16] Qu JG, Zhang W, Yu XJ, et al. Instability of anthocyanin accumulation in Vitis vinifera L. var. Gamay Fréaux suspension cultures. Biotechnol Bioprocess Eng, 2005, 10(2): 155−161.
[17] Dörnenburg H, Knorr D. Strategies for the improvement of secondary metabolite production in plant cell cultures. Enzyme Microb Technol, 1995, 17(8): 674−684.
[18] Naill MC, Roberts SC. Flow cytometric analysis of protein content in Taxus protoplasts and single cells as compared to aggregated suspension cultures. Plant Cell Rep, 2005, 23(8): 528−533.
[19] Kong JM, Chia LS, Goh NK, et al. Analysis and biological activities of anthocyanins. Phytochem, 2003, 64(5): 923−933.
[20] Nyman NA, Kumpulainen JT. Determination of anthocyanidins in berries and red wine by High-Performance Liquid Chromatography. J Agric Food Chem, 2001, 49(9): 4183−4187.
[21] Cormier F, Do CB, Nicolas Y. Anthocyanin production in selected cell lines of grape (Vitis vinifera L.). In Vitro Cell Dev Biol Plant, 1994, 30(3): 171−173.
[22] Gamborg OL, Miller RA, Ojima K. Nutrient requirements of suspension cultures of soybean root cells. Exp Cell Res, 1968, 50(1): 151−156.
[23] Yoshinaga M, Yamakawa O, Nakatani M. Genotypic diversity of anthocyanin content and composition in purple-fleshed sweet potato (Ipomoea batatas (L.) Lam). Breed Sci, 1999, 49(1): 43−47.
[24] Sato K, Nakayama M, Shigeta JI. Culturing conditions affecting the production of anthocyanin in suspended cell cultures of strawberry. Plant Sci, 1996, 113(1): 91−98.
[25] Makunga NP, van Staden J, Cress WA. The effect of light and 2, 4-D on anthocyanin production in Oxalis reclinata callus. Plant Growth Regul, 1997, 23(3):153−158.
[26] Sakurai M, Ozeki Y, Mori T. Induction of anthocyanin accumulation in rose suspension-cultured cells by conditioned medium of strawberry suspension cultures. Plant Cell Tiss Org Cult, 1997, 50(3): 211−214.
[27] Zhang W, Seki M, Furusaki S. Effect of temperature and its shift on growth and anthocyanin production in suspension cultures of strawberry cells. Plant Sci, 1997, 127(2): 207−214.
[28] Dédaldéchamp F, Uhel C. Induction of anthocyanin synthesis in nonpigmented grape cell suspensions by acting on DFR substrate availability or precursors level. Enzyme Microb Technol, 1999, 25(3/5): 316−321.
[29] Kumar V, Sharma SS. Nutrient deficiency-dependent anthocyanin development in Spirodela polyrhiza L. Schleid. Biol Plant, 1999, 42(4): 621−624.
[30] Honda H, Hiraoka K, Nagamori E, et al. Enhanced anthocyanin production from grape callus in an air-lift type bioreactor using a viscous additive-supplemented medium. J Biosci Bioeng, 2002, 94(2): 135−139.
[31] Boss PK, Davies C, Robinson SP. Analysis of the expression of anthocyanin pathway genes in developing Vitis vinifera L. cv Shiraz grape berries and the implications for pathway regulation. Plant Physiol, 1996, 111(4): 1059−1066.
[32] Revilla E, García-Beneytez E, Cabello F, et al. Value of high-performance liquid chromatographic analysis of anthocyanins in the differentiation of red grape cultivars and red wines made from them. J Chromatogr A, 2001, 915(1/2): 53−60.
[33] Tedesco I, Russo GL, Nazzaro F, et al. Antioxidant effect of red wine anthocyanins in normal and catalase-inactive human erythrocytes. J Nutr Biochem, 2001, 12(9): 505−511.
[34] Ali A, Strommer J. A simple extraction and chromatographic system for the simultaneous analysis of anthocyanins and stilbenes of Vitis species. J Agric Food Chem, 2003, 51(25): 7246−7251.
猜你喜欢
水利水运工程学报(2022年3期)2022-07-07
生物医学工程学进展(2021年1期)2021-04-15
女报(2020年10期)2020-11-23
照明工程学报(2019年3期)2019-07-09
天然产物研究与开发(2018年11期)2018-11-30
中成药(2017年5期)2017-06-13
中国生物医学工程学报(2017年6期)2017-02-10
中成药(2016年8期)2016-05-17
中国康复理论与实践(2015年10期)2015-12-24