
Lesson Sixty-three The V2transition ratio
——a new electrocardiographic criterion for distinguishing left from right ventricular outflow tract tachycardia origin
2015-06-01 12:26童鸿
心电与循环 2015年1期
●心电学英语
Lesson Sixty-three The V2transition ratio
——a new electrocardiographic criterion for distinguishing left from right ventricular outflow tract tachycardia origin
Outflow tract ventricular tachycardia(OTVT)represents the most common subgroup of idiopathic ventricular tachycardia(VT).The clinical presentation of OTVT is heterogeneous,ranging from isolated premature ventricular contractions(PVCs)to repetitive nonsustained VT to sustained VT.
Detailedintracardiac electrical mapping has demonstrated that the vast majority of OTVTs originate from the anterior and superior septal aspect of the right ventricular outflow tract(RVOT),just inferior to the pulmonic valve.Less commonly,the site of origin can be localized to the right ventricular(RV)infundibulum,RV free wall,and posterior aspect of the interventricular septum.In approximately 10%to 15%of cases,the arrhythmia originates from the left ventricular outflow tract (LVOT)and can be mapped to the region of the aortic cusps.Rarely,OTVTs can be ablated from within the anterior interventricular vein,aorto-mitral continuity,or the root of the pulmonary artery.
Because OTVT has a focal origin and occurs in patients with structurally normal hearts,it is an arrhythmia that is particularly conducive to localization with the 12-lead electrocardiography(ECG).Typically,OTVT originating in the RV manifests an inferior axis in the frontal plane and left bundle branch block(LBBB)configuration with precordial R/S transition at or after lead V3.By contrast,LVOT VT usually manifests either a right bundle branch block(RBBB)/inferior axis or a LBBB/inferior axis with a precordial R/S-wave transition at or before lead V3.
Criteria to distinguish RVOT from LVOT origin for patients with precordial transition occurring at lead V3have been lacking.The aim of this study was to develop an ECG algorithm for reliably predicting the site of origin of OTVTs with lead V3precordial R/S transition.We hypothesized that comparison of the PVC/VT with the sinus rhythm(SR)QRS morphology would be an effective means of distinguishing LVOT from RVOT VT.
Methods
This study was designed in 2 parts:1)a retrospective review of OTVT ablation cases in order to develop the ECG algorithm;and 2)a prospective assessment of the algorithm on a second group of patients.
Patients with PVCs/VT manifesting a LBBB/inferior axis and a precordial transition(from R/S<1 to R/S>1)at lead V3were included.The majority of patients had normal left ventricular function by echocardiography.Patients with ECG evidence of prior myocardial infarction,RBBB during SR,or whose clinical arrhythmia could not be abolished with catheter ablation were excluded.
Mapping and ablation protocol
A standard quadripolar catheter was positioned in the RV apical position,and a 4mm nonirrigated catheter was initially positioned in the RVOT for mapping.In patients with sufficient ectopy,activation mapping wasperformed,recording the earliest local bipolar activation time compared with surface QRS of the clinical PVC. Pace-mapping at a threshold just above local capture was performed in all cases with careful comparison of the paced surface QRS morphology with that of the clinical PVC.All idiopathic PVCs/VT in this series originated from the septal side of the RVOT just beneath the pulmonic valve.
The decision to extend mapping to a LVOT site was made if no adequate RVOT sites were identified or ablation in the RVOT was unsuccessful in abolishing the arrhythmia.The LVOT sites were mapped via a retrograde aortic approach.All mapping was performed after heparin bolus,maintaining an activated clotting time>250 s.In addition to standard fluoroscopy,a 3-dimensional electroanatomic mapping system and intracardiac echocardiography were used to localize the anatomic position of the ablation catheter within the outflow tract. ECG measurement protocol
Sinus rhythm and VT ECG morphology were measured on the same 12-lead ECG.During the clinical arrhythmia,the following measurements were obtained during both SR and the PVC/VT:1)R-and S-wave amplitudes in leadⅠ,Ⅱ,Ⅲ,aVF,and V1to V3;2) R-wave duration in leads V1to V3;3)QRS duration;and 4)QRS frontal axis(Figure 1).The T-P segment was considered the isoelectric baseline for measurement of R-and S-wave amplitudes.The QRS duration was measured from the site of earliest initial deflection from the isoelectric line in any lead to the time of latest activation in any lead.The R-wave duration was measured from the site of earliest initial deflection from the isoelectric line to the time at which the R-wave intersected the isoelectric line.For all cases,QRS measurements were performed on isolated PVCs representative of the clinical VT before the induction of sustained VT and compared with the SR QRS complex.As a means of accounting for1respiratory variation,we standardized our SR measurements by measuring the largest R-and S-wave over a 10s window at 25mm/s sweep speed.The transition ratio was calculated in leads V2and V3by computing the percentage R-wave during VT(R/R+S) VT divided by the percentage R-wave in SR(R/R+S) SR.
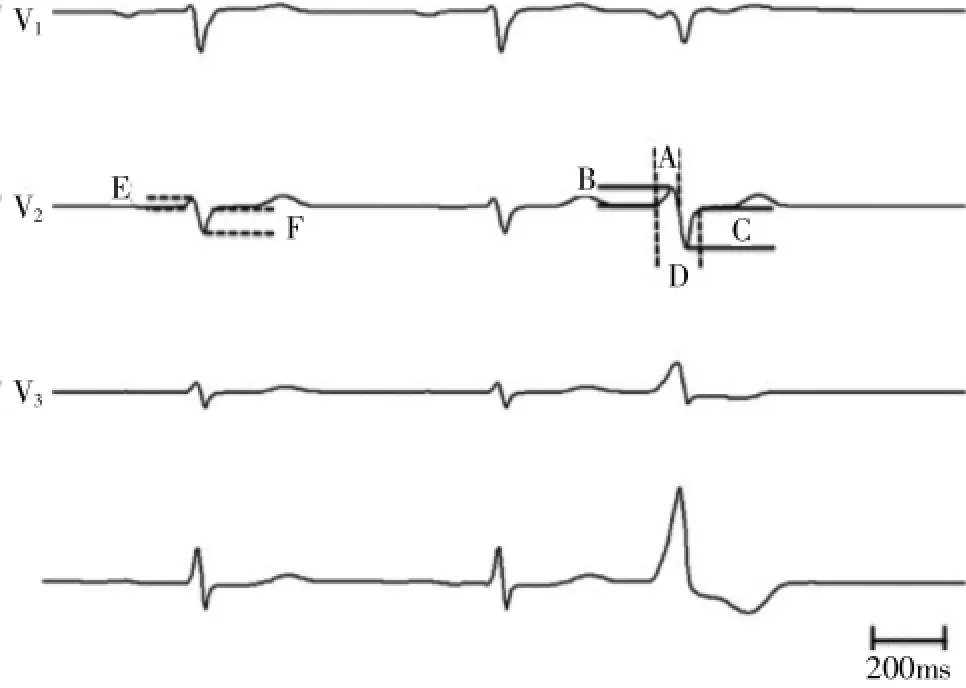
Figure 1Electrocardiographic Measurements.Leads V2and V3of normal sinus beat followed by a premature ventricular contraction (PVC)representative of the clinical outflow tract ventricular tachycardia.Measurements are as follows:A=PVC R-wave duration(ms);B=PVC R-wave amplitude(mV);C=PVC S-wave amplitude(mV);D=PVC QRS duration(ms);E= sinus rhythm R-wave amplitude(mV);and F=sinus rhythm S-wave amplitude(mV).The transition ratio was calculated in each leadwiththefollowingformula:[B/(B+C)VT÷E/(E+F)SR].
We hypothesized that a PVC/VT precordial transition to R>S at an interspace equal to or earlier than the location of the SR transition would suggest an LVOT origin,whereas a transition at an interspace later than the SR transition would suggest an RVOT origin.The sensitivity and specificity for this measure was assessed.
Results
Retrospective analysis
We identified 40 cases of successful OTVT ablation with lead-V3transition that met our inclusion criteria.The RVOT cohort consisted of 80%anteroseptal sites and 20%posteroseptal sites.The LVOT cohort consisted of 35%LCC,15%RCC,40%left-right coronary cusp junction,and 10%great cardiac vein near the anterior interventricular vein.
The R-wave amplitude was greater for LVOT compared with RVOT PVCs in leads V2(P<0.001)and V3(P<0.001).The R-wave duration ratio of the PVC to SR in lead V2(P=0.002)and lead V3(P=0.026)was also significantly greater for LVOT compared with RVOT PVCs.The V2transition ratio was significantly greater for LVOT(range 0.42 to 2.89)compared with RVOT origin(range 0.02 to 0.57)(P<0.001);however, the V3transition ratio was not significantly different be-tween PVCs of LVOT versus RVOT origin(P=0.093). The overall QRS duration was longer for LVOT compared with RVOT PVCs(P=0.048).
In a multivariate logistic regression,including R-wave duration in leads V1and V2,R-wave amplitude in leads V2and V3,and the R-wave transition ratio in lead V2,the V2R-wave transition ratio was the only independent predictor of PVC origin(P<0.001,95%CI: 0.01~0.41).
A V2transition ratio≥0.6 predicted an LVOT origin with a sensitivity of 95%and specificity of 100%. This cutoff yielded a positive predictive value of 100% and a negative predictive value of 95%.A more practical cutoff of≥0.5 yields a sensitivity of 95%and specificity of 95%.
The simple qualitative measure of PVC precordial transition(R>S)occurring at or before the SR transition (R>S)had a sensitivity of 47%and specificity of 64% for identifying an LVOT origin.However,a PVC precordial transition occurring later than the SR transition had a 19%sensitivity and 100%specificity for RVOT origin. Therefore,a PVC that transitions later than SR effectively rules out an LVOT origin.The surface ECGs of representative PVCs with lead V3R/S transition are illustrated adjacent to2their corresponding sinus beats in Figure 2.
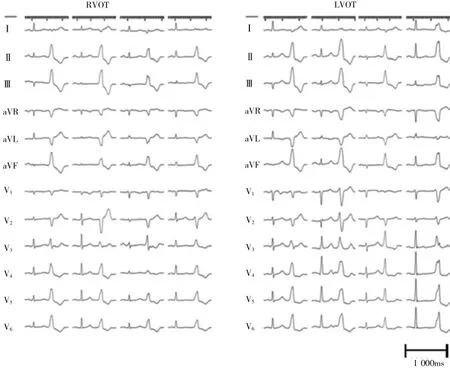
Figure 2Representative Outflow Tract PVC Surface ECG Recordings.The SR QRS and PVC morphologies from the retrospective cohort demonstrating the relatively earlier SR precordial transition in RVOT(left)compared with patients with LVOT PVC origin(right).The ECG speed:25 mm/s.Lead gain standardized to 1/16.
Prospective analysis
The ECG measurements of the ensuing 21 cases of OTVT who underwent successful RF ablation at our institution were performed.The algorithm was able to correctly predict the site of successful ablation(LVOT vs. RVOT)in 91%(19 of 21)of cases.With the simple qualitative measure alone,where LVOT origin is suggested by a PVC transition at or earlier than the SR transition,there was 71%accuracy in diagnosing the PVC origin.On the other hand,when the PVC transition occurred later than the sinus rhythm transition,anLVOT origin could be excluded with 100%accuracy.A proposed algorithm combining the qualitative and quantitative measures is shown in Figure 3.
Conclusions
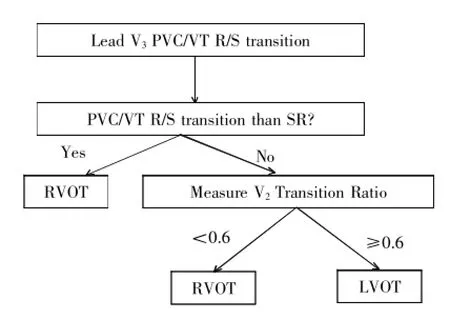
Figure 3Diagnostic Algorithm for Outflow Tract VT With Lead V3PVC/VT R/S Transition.If the PVC/ventricular tachycardia (VT)transition to an R>S occurs later than the SR transition (i.e.,SR transition lead V1or V2),then the PVC origin is the RVOT(100%specificity).If the PVC transition occurs at or earlier than the SR transition(i.e.,SR transition lead V3or later),then the V2transition ratio is measured.If the transition ratio is<0.6,then RVOT origin is likely.If the transition ratio is≥0.6,then LVOT origin is likely(sensitivity 95%, specificity 100%).
We present a novel electrocardiographic measure of the ratio of the VT and SR precordial transition,"the V2transition ratio,"which can reliably distinguish left from right outflow tract PVC/VT origin in patients with OTVT and lead V3precordial R/S transition.A V2transition ratio 0.6 predicts an LVOT origin with high sensitivity and specificity.A precordial transition later than the SR transition excludes an LVOT VT origin.
词汇
transition n.过渡,临时转调,转折语
heterogeneous adj.各种各样的
infundibulum n.漏斗
cusps n.尖,尖点,牙尖
conducive adj.有助的
configuration n.配置,构形,轮廓
precordial adj.心前的
algorithm n.算法
abolished v.彻底废除,取消,完全破坏
quadripolar n.四极
ensuing n.接着发生的,随后的
注释
1.accounting for在医学文献上常表达“校正”,“应对”之意,如Without accounting for stenosis interaction,the value of FFR for each stenosis would have been significantly overestimated.不校正狭窄之间的相互影响,每一狭窄的FFR值将被明显高估。
2.adjacent to表示“接近”,“近…处”,“与…邻近”,“毗连…”,当修饰名词时,常放在被修饰名词的后面,本文中放在句子后面,是因为PVC后有介词短语修饰;也常放在动词后面构成地点状语,如Ventricular pacing was performed adjacent to the His bundle and proximal right bundle branch.于希氏束附近和右束支近端实施心室起搏。
参考译文
第63课V2移行比率——鉴别左右心室流出道心动过速起源的新心电学标准
流出道室性心动过速(OTVT)是最常见的特发性室性心动过速(VT)。OTVT临床表现各异,从单一的室性期前收缩(PVC)到反复短暂VT及持续性VT。
精细的心内电标测证实大多数OTVT起源于右室流出道(RVOT)前上间隔,位于肺动脉瓣下方。不常见的起源部位有右心室流出道漏斗部、右心室游离壁和后间隔部位。约10%~15%患者,心律失常起源于左心室流出道(LVOT),并可标测到主动脉窦部位。罕见的有经前间隔静脉、主动脉-二尖瓣连接处或肺动脉根部消融的OTVT。
因为OTVT为局灶起源且发生于心脏结构正常患者,因此,这种心律失常特别有利于从12导联心电图定位。起源于右心室的OTVT典型的表现为额面电轴向下、呈左束支传导阻滞(LBBB)图形,且心前导联R/S移行位于V3或V3以后。相反,LVOT VT通常表现为右束支传导阻滞(RBBB)/电轴向下或LBBB/电轴向下而R/S移行位于V3或V3以前。
对于心前导联移行位于V3的RVOT与LVOT,尚无鉴别标准。本研究目的是建立一种心电图法则,以便可靠地鉴别移行位于心前导联V3的OTVT起源部位。我们假设比较室性期前收缩/室性心动过速与窦性心律QRS形态是鉴别LVOT和RVOT VT的有效方法。
方法
本研究分2部分:1)回顾性分析OTVT消融病例,建立心电图法则;2)应用该法则前瞻性分析第2组患者。
纳入所有表现为LBBB/电轴向下而心前导联移行位于V3的PVC/VT患者。多数患者超声心动图显示左心室功能正常。心电图提示有既往心肌梗死、窦性心律RBBB或不能进行射频导管消融的心律失常者排除在外。
标测和消融方案
标准四极导管置于右心室心尖部,4mm非灌注导管先在RVOT标测。异位搏动足够多者行激动标测,记录最早的局部双极激动时间与临床PVC体表QRS波群作比较。所有患者以略高于局部夺获的阈值起搏标测,仔细比较起搏时体表QRS波群图形与临床PVC图形。本系列特发性PVC/VT均起源于肺动脉瓣下ROVT间隔侧。
如果无法确定确切的RVOT部位或RVOT部位不能成功消融心律失常,那么扩大标测到LVOT部位。通过经主动脉逆行方法标测LVOT。所有标测于弹丸注射肝素后进行,维持ACT>250s。除标准透视外,用三维解剖标测和心腔内超声心动图确定消融导管在流出道的解剖位置。
心电图测定方案
在同一12导联心电图上测定窦性心律和VT心电图图形。在临床心律失常期间,获取窦性心律和PVC/VT时的下列数值:1)导联Ⅰ、Ⅱ、Ⅲ、aVF和V1到V3上的R和S波振幅; 2)V1到V3上R波间期;3)QRS间期;和4)QRS额面电轴(图1)。TP段用作R和S波振幅测量的等电位线。QRS间期测定从任一导联的最早转折点到任一导联的最迟激动点。R波间期从等电位线的最早转折点到R波与等电位线的相交点。对于所有患者,在诱发持续性VT前,测定代表临床VT的单一PVC QRS波群,并与窦性心律QRS波群比较。为应对呼吸变化,我们标化SR测定方法,即在25mm/s扫描速度的10s窗口中,测定最大的R和S波。计算VT的(R/R+S)VT QRS波的百分比与SR的(R/R+S)SR QRS波的百分比比值。
我们假设PVC/VT心前导联移行到R>S的间隙等于或早于SR移行将提示LVOT起源,而迟于SR移行的将提示RVOT起源。分析这一测值的敏感度和特异度。
结果
回顾性分析
我们确定40例OTVT伴V3移行、并符合纳入标准的患者。RVOT组由80%的前间隔和20%的后间隔部位组成。LVOT组包括35%的左冠状窦,15%的右冠状窦,40%的左-右冠状窦连接处,和10%接近前间隔静脉的心大静脉。
V2和V3PVC R波振幅LVOT大于RVOT(均P<0.001)。V2和V3R波间期PVC与SR比率LVOT也显著大于RVOT(P=0.002,0.026)。V2移行比率LVOT(0.42~2.89)显著大于RVOT(0.02~0.57)(P<0.001);然而,LVOT与RVOT起源的PVC V3的移行比率无显著差异(P=0.093)。总的QRS间期LVOT较RVOT长(P=0.048)。
多变量logistic回归分析表明,在包括V1和V2的R波间期、V2和V3的R波振幅、及V2R波移行比率众多因素中,只有V2R波移行比率是独立预测PVC起源的因素(P<0.001,95%CI:0.01~0.41)。
V2移行比率≥0.6预测LVOT起源的敏感度95%、特异度100%。此值的阳性预测值为100%、阴性预测值为95%。临床取此值≥0.5,敏感度和特异度均为95%。
单一定量测定PVC心前导联移行(R>S)等于或早于SR移行(R>S)鉴别LVOT的敏感度47%、特异度64%。然而,PVC心前导联移行迟于SR移行诊断RVOT的敏感度和特异度分别为19%和100%。因此,PVC移行迟于SR的明确排除LVOT起源。图2阐述了与相应窦性搏动毗连的典型PVC V3R/S移行体表心电图。
前瞻性分析
对随后在本院成功消融的21例OTVT患者行心电图测定。这一法则能正确预测91%患者的成功消融部位(19/21)。采用简单的定性测定方法,即PVC移行等于或早于SR移行提示LVOT,诊断PVC起源的准确性为71%。另一方面,PVC移行迟于窦性心律移行时,排除LVOT的准确性达100%。结合定性和定量测值构建的法则见图3。
结论
我们提出VT和SR心前导联移行的心电图测值比率,即V2移行比率,能可靠鉴别V3R/S移行OTVT患者左室或右室流出道PVC/VT起源。V2移行比率≥0.6预测LVOT起源敏感度和特异度高。心前导联移行迟于SR移行排除LOVT VT起源。
图1心电图测量。V2和V3正常窦性搏动后为代表临床流出道室性心动过速的室性期前收缩(PVC)。测量如下:A=PVC R波间期(ms);B=PVC R波振幅(mV);C=PVC S波振幅(mV);D=PVC QRS间期(ms);E=窦性心律R波振幅(mV);F=窦性心律S波振幅(mV)。根据以下公式计算每一导联的移行比率:[B/(B+C)VT÷E/(E+F)SR]。
图2典型流出道PVC体表心电图记录。来自回顾性病例的SR QRS和PVC图形证实,SR心前导联移行RVOT(左)早于LVOT(右)PVC起源者。心电图记录速度25 mm/s。导联增益标化至1/16。
图3V3PVC/VT R/S移行的流出道VT诊断法则。如果PVC/VT移行至R>S迟于RS移行(例如,SR移行导联V1或V2),那么PVC起源在RVOT(特异度100%)。如果PVC移行早于SR移行(例如,SR移行导联V3或V4),那么测量V2移行比率。如果移行比率<0.6,可能为RVOT起源。如果移行比率≥0.6,可能为LVOT起源(敏感度95%,特异度100%)。
[1]Betensky B P,Park R E,Marchlinski F E,et al.The V2Transition Ratio:A New Electrocardiographic Criterion for Distinguishing Left From Right Ventricular Outflow Tract Tachycardia Origin[J].J Am Coll Cardiol,2011,57∶2255-2262.
(童鸿)
猜你喜欢
保健与生活(2020年24期)2020-12-23
中国医疗器械信息(2020年18期)2020-10-19
新教育时代·学生版(2020年10期)2020-07-31
福建基础教育研究(2020年1期)2020-05-28
中国心血管杂志(2019年3期)2019-07-15
中国介入心脏病学杂志(2019年5期)2019-06-06
中国心脏起搏与心电生理杂志(2019年1期)2019-03-02
中兴通讯技术(2017年1期)2017-03-11
中国当代医药(2015年22期)2015-03-01
中国中医药现代远程教育(2014年23期)2014-03-01
