
Characteristics and Mechanisms of the Sudden Warming Events in the Nocturnal Atmospheric Boundary Layer:A Case Study Using WRF
2015-11-21 11:23MAYuanyuan马媛媛YANGYi杨毅HUXiaoMing3胡小明andGANRuhui甘茹蕙
MA Yuanyuan(马媛媛),YANG Yi∗(杨毅),HU Xiao-Ming3(胡小明),and GAN Ruhui(甘茹蕙)
1 Key Laboratory of Arid Climate Change and Disaster Reduction of Gansu Province,Key Laboratory for Semi-Arid Climate Change of the Ministry of Education,College of Atmospheric Sciences,Lanzhou University,Lanzhou 730000,China
2 Key Laboratory of Meteorological Disaster of Ministry of Education,Nanjing University of Information Science&Technology,Nanjing 210044,China
3 Center for Analysis and Prediction of Storms/School of Meteorology,University of Oklahoma,Norman,OK 73072,USA
Characteristics and Mechanisms of the Sudden Warming Events in the Nocturnal Atmospheric Boundary Layer:A Case Study Using WRF
MA Yuanyuan1(马媛媛),YANG Yi1∗(杨毅),HU Xiao-Ming2,3(胡小明),and GAN Ruhui1(甘茹蕙)
1 Key Laboratory of Arid Climate Change and Disaster Reduction of Gansu Province,Key Laboratory for Semi-Arid Climate Change of the Ministry of Education,College of Atmospheric Sciences,Lanzhou University,Lanzhou 730000,China
2 Key Laboratory of Meteorological Disaster of Ministry of Education,Nanjing University of Information Science&Technology,Nanjing 210044,China
3 Center for Analysis and Prediction of Storms/School of Meteorology,University of Oklahoma,Norman,OK 73072,USA
Although sudden nocturnal warming events near the earth's surface in Australia and the United States have been examined in previous studies,similar events observed occasionally over the Loess Plateau of Northwest China have not yet been investigated.The factors that lead to these warming events in such areas with their unique topography and climate remain not clear.To understand the formation mechanisms and associated thermal and dynamical features,a nocturnal warming event recorded in Gansu Province(northwest of the Loess Plateau)in June 2007 was investigated by using observations and model simulations with the Weather Research and Forecasting(WRF)model.Observations showed that this near-surface warming event lasted for 4 h and the temperature increased by 2.5℃.During this event,a decrease in humidity occurred simultaneously with the increase of temperature.The model simulation showed that the nocturnal warming was caused mainly by the transport of warmer and drier air aloft downward to the surface through enhanced vertical mixing.Wind shear played an important role in inducing the elevated vertical mixing,and it was enhanced by the continuous development of the atmospheric baroclinicity,which converted more potential energy to kinetic energy.
Semi-Arid Climate and Environment Observatory of Lanzhou University(SACOL),nocturnal warming events,Weather Research and Forecasting(WRF),enhanced vertical mixing,wind shear
1.Introduction
Generally,under nocturnal clear sky conditions,surface radiative cooling causes a near-surface temperature inversion that tends to inhibit turbulent motions(Poulos et al.,2002).This can cause a decoupling between the surface layer and the free atmosphere(Derbyshire,1999;Steeneveld et al.,2006;Banta et al.,2007),and the air temperature and wind speed in the decoupled surface layer decreases quickly,while the near-surface water vapor accumulates concurrently(White,2009).
In contrast to the general view of the nighttime planetary boundary layer(PBL),some previous studies have observed nocturnal warming events during which the nighttime near-surface temperature exhibited a sudden rise(Smith et al.,1995;Qian and Li,1996;Reeder et al.,1999;Sanders and Kessler,1999;Acevedo and Fitzjarrald,2001;Fiebrich and Crawford,2001;Soler et al.,2002;Ha and Mahrt,2003;Doswell III and Haugland,2007;White,2009;Nallapareddy et al.,2011;Hu et al.,2013a).These nocturnal warming events in the PBL have been reported in Australia and the United States(Smith et al.,1995;White,2009;Nallapareddy et al.,2011).During these events,the magnitudes of the changes in temperature,humidity,wind direction,and wind speed showed significant variability(White,2009).For example,the largest increase in temperature was recorded to be as high as 10℃ during an event in Oklahoma(Nallapareddy et al.,2011).
Supported by the National Natural Science Foundation of China(41375109),National(Key)Basic Research and Development(973)Program of China(2014CB441406),and Key Laboratory of Meteorological Disaster of Ministry of Education,Nanjing University of Information Science&Technology(KLME1412).
∗Corresponding author:yangyi@lzu.edu.cn.
©The Chinese Meteorological Society and Springer-Verlag Berlin Heidelberg 2015
Previous studies have discussed several possible mechanisms(e.g.,fronts and waves)by which nocturnal warming events may occur.Cold fronts could mix the relatively warmer air aloft with colder air near the surface,increasing the near-surface temperature and causing a nocturnal warming event(Doswell III and Haugland,2007;Nallapareddy et al.,2011).Similarly,waves propagating along the inversion surface could also mix warm and cold air together,causing transitory warming events with different amplitudes(Clarke et al.,1981).Other researchers attributed nocturnal warming events to enhancement of vertical turbulent mixing(Acevedo and Fitzjarrald,2001;Van De Wiel et al.,2003;Doswell III and Haugland,2007;Nallapareddy et al.,2011;Hu et al.,2013a).However,most previous works have been based on observational data,and few relevant studies have been performed by using numerical simulations(Hu et al.,2013a).Furthermore,the understanding of the thermal and dynamical features of nocturnal warming events and their formation mechanisms remain inconclusive,especially over Northwest China.
Investigating both the physical and dynamical features of these events and exploring their formation mechanisms are important,regarding the improvement of our understanding of the nocturnal boundary layer(White,2009;Nallapareddy et al.,2011;Hu et al.,2013a).Such knowledge is also important for the parameterization of PBL processes in numerical models(Derbyshire,1999;Hu et al.,2010).Furthermore,accurate forecasting of these warming events is of importance to energy management,aviation,surface transportation,agriculture,and forecasting of air quality.For example,increases in nocturnal temperature could affect forecasts of the daily minimum temperature,which influences the formation of fog,dew,frost,and freezing,and thus visibility,road conditions,and crop growth(Fang et al.,2010;Zhang et al.,2014). In addition,the structure of the nocturnal PBL would be altered by such an event,which could affect the dispersion of pollutants near the surface(Weber and Kurzeja,1991).If,as Nappo(1991)stated,warming events occur frequently in the nocturnal PBL,they might change the CO2balance,which would influence the local climate and ecosystem.
Occurrences of nocturnal warming events over the Loess Plateau in Northwest China have been detected in long-term meteorological data.The Loess Plateau,a widespread wind-blown deposit,is the largest arid and semi-arid zone in northern China,and covers an area of about 500000 km2(An,2000).The Semi-Arid Climate and Environment Observatory of Lanzhou University(SACOL),established in this region in 2005,provides long-term and continuous observations over the semi-arid region of the Loess Plateau(Huang et al.,2008).It is one of the reference sites of the international Coordinated Energy and Water Cycle Observations Project(Wang et al.,2010).Nocturnal warming phenomena of differing magnitudes were detected in the meteorological measurements of the boundary layer during 2007-2008 at SACOL.The temperature normally decreased within a few hours after sunset,but then at times,it would suddenly rise.Moreover,other variables such as relative humidity,dew point,and wind direction and speed also changed significantly.The factors leading to these warming events in a place with such particular topography and climate are unclear.Thus,a study based on a high-resolution numerical model is necessary for a detailed analysis of these warming events(Nallapareddy et al.,2011).
The nocturnal warming event selected for this study was observed at 0200 BT(Beijing Time)25 June 2007 at SACOL and it lasted for 4 h.During the event,the near-surface temperature increased by 2.5℃.A numerical simulation using the Weather Research andForecasting(WRF)model was performed to investigate the thermal and dynamical features and formation mechanisms of the nocturnal warming event.
The remainder of the paper is organized as follows.Section 2 describes the observational data and the numerical model setup.Section 3 presents the analysis of the warming event based on observational data and the simulation results.Finally,conclusions and discussion are offered in Section 4.
2.Methods
2.1 Data
The boundary layer meteorological measurements at SACOL and conventional ground and sounding data were used in this study. The observatory station,SACOL(35°57′N,104°08′E;1965.8 m above sea level),is located approximately 48 km southeast of Lanzhou City on the southern bank of the Yellow River in Gansu Province,Northwest China(Fig.1).It comprises a large set of instruments that measure boundary layer meteorological variables,surface radiation,and surface fluxes(Huang et al.,2008;Wang et al.,2010;Liang et al.,2014).The boundary layer meteorological measurements include wind speed(014AL,Met One),air temperature,and relative humidity(HMP45C-L,Vaisala)at 1,2,4,8,12,16,and 32 m above ground level(AGL),and wind direction(034BL,Met One)at 8 m AGL.The surface radiation monitoring system consists of upward and downward pyranometers(CM21,Kipp&Zonen and CG4,Kipp&Zonen)for incoming and outgoing shortwave/longwave radiation fluxes,and the net radiation is computed from these radiation components.The friction velocity and sensible and latent heat fluxes(LHs)are measured at 3 m AGL by an eddy covariance(EC)system with signals logged into a data logger(CR5000,Campbell)at 10 Hz.The EC system consists of a three-axis sonic anemometer(CSAT3,Campbell)and an open-path infrared CO2and H2O analyzer(LI7500,LI-COR).The sensors are calibrated in May every year.All related variables are recorded at half-hourly intervals.
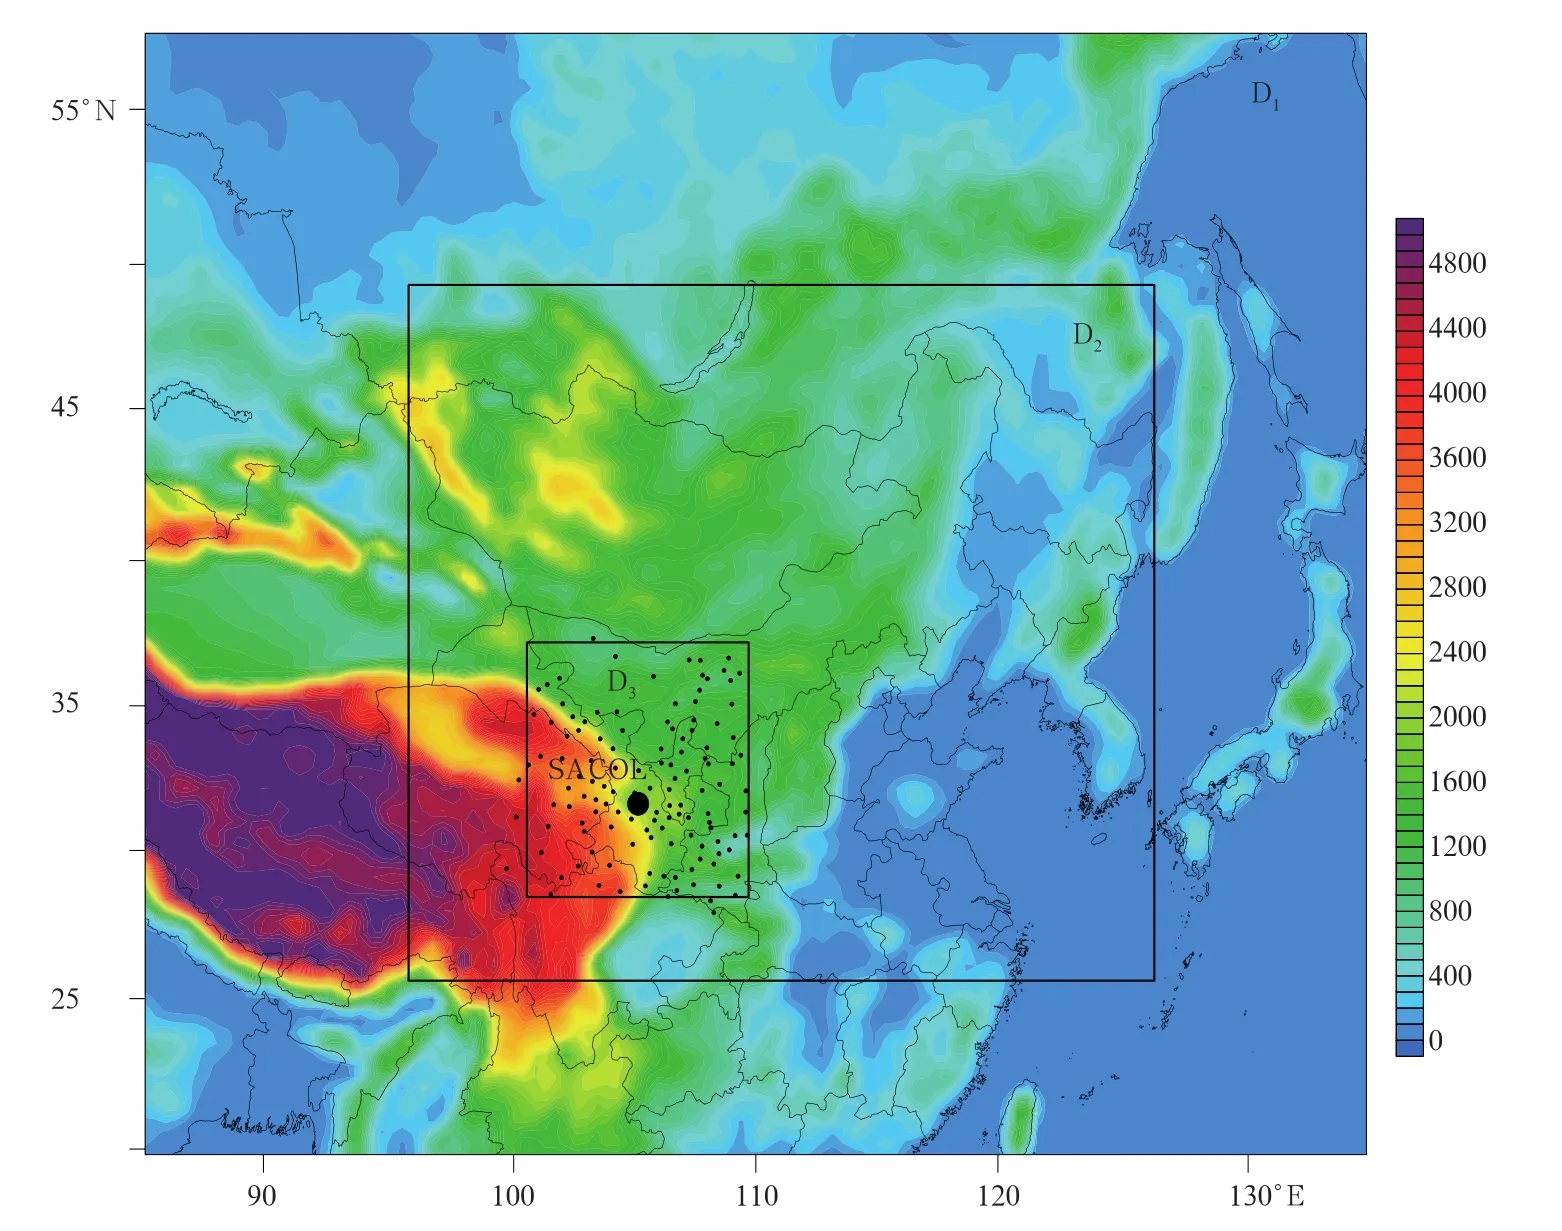
Fig.1.Map of model domains(D1,D2,and D3)and terrain height.Small black dots represent the observational sites of conventional ground and sounding data and the large black dot indicates the location of the SACOL site.
2.2Three-dimensional simulations
To investigate the formation mechanism of the nocturnal warming event and associated physical and dynamical features,a three-dimensional simulation was conducted by using WRF version 3.5.1.Three one-way nested domains,centered at 44°N,110°E(Fig.1),were employed with horizontal grid numbers of 121×103,220×190,and 326×346 and grid spacings of 45,15,and 3 km,respectively.Each domain had 37 vertical layers extending from the surface to 100 hPa.The integration time step of the outermost model layers was 120 s.All model domains used the WRF single-moment six-class microphysics scheme(Hong et al.,2004),Dudhia shortwave radiation algorithm(Dudhia,1989),rapid radiative transfer model for longwave radiation(Mlawer et al.,1997),and Noah land-surface scheme(Chen and Dudhia,2001).The Grell-Freitas cumulus parameterization scheme(Grell and Freitas,2014)was used in the two outer domains. After examining the advantages/disadvantages of different PBL parameterization schemes,the BouLac PBL parameterization scheme(Bougeault and Lacarrere,1989)was found to be keen and very capable to capture various boundary layer mixing processes(Shin and Hong,2011;Xie et al.,2012;Hu et al.,2013b;LeMone et al.,2013;ˇZabkar et al.,2013),and thus,chosen for this study.The 1°×1°NCEP Final Global Forecast System analysis was used for the initial and boundary conditions of all meteorological variables.A few sensitivity simulations with different spin-up times were conducted to study the warming event that occurred at 0200 BT 25 June 2007,following the approach of Hu et al.(2013a).The simulation from 0800 BT 24 to 2000 BT 25 June 2007 was chosen for analysis in this study because it showed good overall performance in comparison with the observations. To capture the features of the warming event in detail,the WRF simulation results were output every 10 min.
3.Results
3.1 Measurements at SACOL
SACOL meteorological data covering the 2-yr period from 2007 to 2008 were examined.In all,2391 nocturnal warming events at 2 m AGL were detected in Lanzhou,of which 72 were obvious nocturnal warming events(where the temperature at 2 m AGL rose by at least 1.0℃).Although most of the warming events(57.8%)were of short duration(shorter than 60 min),there were still many warming events that lasted as long as several hours.As some previous studies have reported cold front induced nocturnal warming events,the relationship between cold fronts and warming events was investigated.It was found that of the cold fronts observed during the 2-yr period,71.6% produced at least one nocturnal warming event.A prominent nocturnal warming event that occurred on 25 June 2007 was selected for detailed analysis in this study.
The time of sunset on 24 June 2007 in Lanzhou was 2025 BT and the time of sunrise on 25 June 2007 was 0549 BT.A prominent warming event occurred between 0200 and 0600 BT 25 June(shaded area in Fig.2).During 0200-0330 BT,the near-surface temperature at SACOL rose by 2.5℃,then decreased throughout the remainder of the night due to radiative cooling,and eventually returned to the pre-warming level at 0600 BT(Fig.2a).The entire process lasted for 4 h,and as the temperature rose,the atmospheric humidity decreased simultaneously(Fig.2b).
Four potential mechanisms were speculated in White(2009)for the development of nocturnal warming events:1)change in radiative balance;2)change in heat flux near the surface;3)heat burst driven by weather systems;and 4)turbulent overturning or vertical mixing due to increased wind speed.Each of these mechanisms was examined as follows.
1)Change in radiative balance
The downward and upward shortwave and upward longwave radiation observed at SACOL were nearly constant throughout the night of 24-25 June 2007(Fig.2c),indicating a clear night(Van De Wiel et al.,2003).Therefore,the warming event cannot be attributed to changes in the radiative balance caused by changes of cloud conditions in the sky.
2)Change in heat flux near the surface
Both the downward sensible and the upward LHs decreased as the temperature rose(Fig.2d).Thesechanges acted only to lessen the decrease of temperature,and they cannot be the major contributors to the development of the warming events.
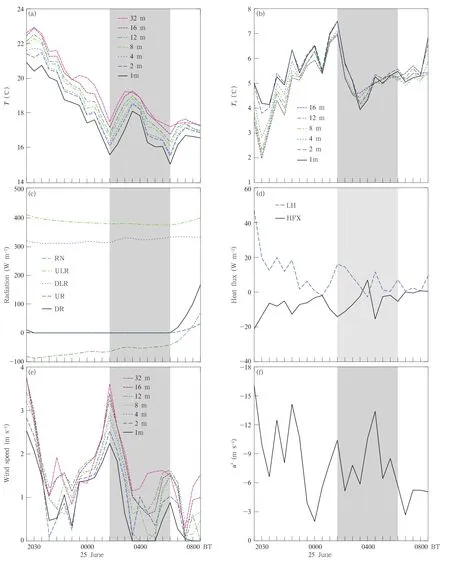
Fig.2.Time series of observational data during the night of 24-25 June 2007 at SACOL:(a)temperature(T);(b)dew point temperature(Td);(c)radiation,including downward shortwave radiation(DR),upward shortwave radiation(UR),downward longwave radiation(DLR),upward longwave radiation(ULR),and net radiation(RN);(d)heat flux,including latent flux(LH)and sensible heat flux(HFX);(e)wind speed;and(f)friction velocity(u∗).The shaded area represents the period of the warming event(similarly hereinafter).
3)Heat burst driven by weather systems(e.g.,warm fronts or degenerative convective storms)
Heat bursts are usually accompanied by strong winds that have the potential to cause damage(White,2009).The wind speed during the warm event was not strong enough to cause heat bursts(the maximum wind speed below 32 m AGL was less than 4 m s-1)(Fig.2e),although the near-surface wind speed did increase continuously prior to the onset of the warming event.In addition,no warm fronts or convective activities were detected near SACOL prior to the warming event on the weather map(figure omitted).
4)Turbulent overturning or vertical mixing due to increased wind speed
Prior to the warming event between 0200 and 0600 BT,the nocturnal temperature decreased with occasional slight increases(Fig.2a),while the dew point temperature increased with occasional slight decreases(Fig.2b).Changes in radiation(Fig.2c),heat fluxes(Fig.2d),and friction velocity(Fig.2f)indicate that turbulence occurred during the night(Van De Wiel et al.,2003).The friction velocity increased rapidly prior to the rise in temperature(Fig. 2f),which is indicative of enhanced turbulence.Wind speed began to increase continuously 2.5 h before the onset of the warming event(Fig.2e),contrary to typical characteristics of the near-surface nocturnal atmosphere under clear skies.The meteorological data suggested a relationship between the warming event and both the enhanced turbulence and the continuously increase in wind speed.Thus,numerical simulations were conducted to reveal the detailed mechanism behind the nocturnal warming event.
3.2 Evaluation of the model simulation
The WRF simulation captured almost all the important meteorological features of the warming event at the SACOL site,including the increase in temperature,decrease in air humidity,and changes in wind speed and direction(Fig.3).The entire warming process lasted for 3.5 h.The simulated wind speed increased abruptly 20 min prior to the warming event(Fig.3c).The wind direction changed from southeasterly to northerly at the beginning of the warming event(Fig.3d),and the wind speed decreased again at the onset of the temperature rise(Fig.3c).However,the simulated atmospheric was slightly drier and the range of variation of air humidity smaller in comparison with the observed relative humidity at 2 m AGL. Moreover,the simulated time of the temperature increase lagged behind the observed data by 1 h.
The model also captured the spatial distributions of meteorological variables(Fig.4).The temperature at 2 m AGL and the wind speed at 10 m AGL showed good agreement with the observations,while the dew point temperature at 2 m AGL was slightly underestimated.The discrepancies between the simulations and observations(in terms of onset time of the warming event,extent of the warming and atmospheric moisture)could have been caused by biases in the model initialization(Hu et al.,2013a)and parameterization(Hacker and Angevine,2013),or by the anamorphic description of the land surface(e.g.,terrain height,vegetation coverage,soil water content,and distribution of water)in Northwest China(Pan et al.,2012). In addition,the temporal resolution of the observations was 30 min and thus,the observations might have missed some high-frequency variations,whereas a simulation with a 10-min output interval would have shown much greater temporal detail.
3.3 Analysis of simulated results
The temperature profile shows that the warming process had impact up to a height of 1000 m(figure omitted).Figure 5a shows that the temperatures at various levels below 227 m AGL began to increase uniformly at 0310 BT and that the time of warming above 186 m AGL exhibited a gradual lag.Therefore,only the warming process that occurred below 186 m AGL was investigated here.At the same time,atmospheric humidity(Fig.5b)below 186 m AGL was reduced.
The time series of the simulated surface energy variables further support that the changes in sensible heat flux(HFX)and latent heat flux(LH)were not responsible for the nighttime warming in this case.The simulated HFX and LH were in agreement with the observations.The downward HFX decreased(Fig.5c)and the upward LH(Fig.5c)also decreased when the temperature rose.Therefore,the change in heat flux could not be the reason for the observed temperature rise.
The simulated temperature,relative humidity in different model layers,HFX,and LH also indicated that turbulence occurred during the night(Van De Wiel et al.,2003).The turbulence led to alterations of the surface temperature(figure omitted),which always immediately affected the HFX and net radiation(Van De Wiel et al.,2002).The upward soil heat flux(Fig.5c)became downward after the occurrence of the turbulence.

Fig.3.(a,c)Observed and(b,d)simulated time series of(a,b)2-m temperature(T2)(red solid lines)and 2-m relative humidity(RH)(black dashed lines),(c,d)wind speed(red lines)and wind direction(black dots)at SACOL during the night of 24-25 June 2007.Note that the wind speed and wind direction were observed at 8 m AGL,whereas the simulated values are at 10 m AGL.
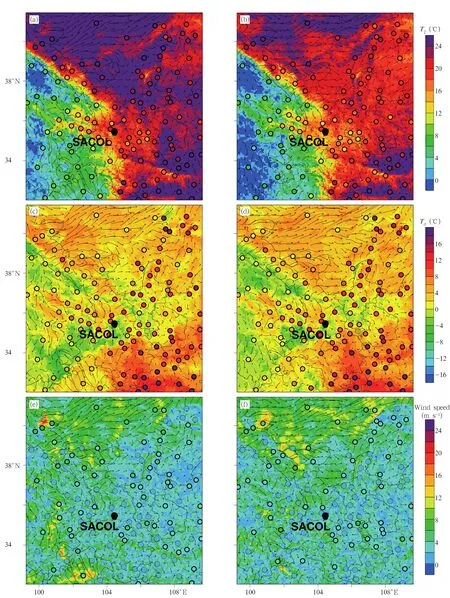
Fig.4.Simulated(a,b)2-m temperature(T2),(c,d)2-m dew point temperature(Td),and(e,f)10-m wind speed at(a,c,e)2300 BT 24 and(b,d,f)0200 BT 25 June 2007.Wind vectors show the simulated 10-m wind field.The observed values are overlaid in the form of colored circles.Black dots indicate the SACOL site.
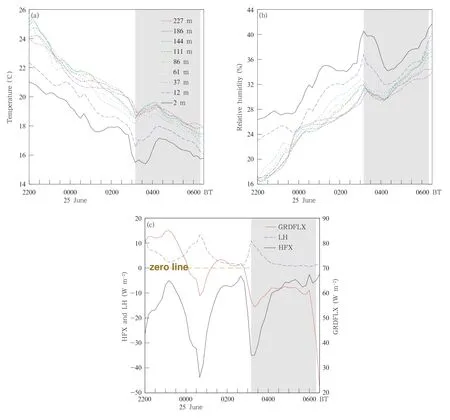
Fig.5.Time series of simulated(a)temperature,(b)relative humidity,and(c)sensible heat flux(HFX),latent heat flux(LH),and soil heat flux(GRDFLX)(the y-axis scale for the red line is on the right,and the yellow line along the x-axis marks the zero line)during the warming night.
The vertical profiles of simulated potential temperature(Fig.7a)and water vapor mixing ratio(Fig. 7b)further illustrate the impact of vertical mixing. Before the warming event(0230 and 0300 BT;black and gray lines in Fig.7a),there was a strong temperature inversion and its strength increased with timedue to surface radiative cooling,indicating a strong thermodynamically stableand quiescentshallow boundary layer.Additionally,there was a roughly neutral layer within 80-100 m AGL.Concurrently,the moisture content of the air at 0300 BT was higher than that at 0230 BT,indicating that water vapor accumulated in the PBL(black and gray lines in Fig. 7b).As the temperature at the different heights increased,the gradient of potential temperature above 100 m AGL decreased and the approximately neutral layer vanished because of vertical mixing(blue and red lines in Fig.7a).The vertical structure of potential temperature below 150 m AGL also changed in comparison with that before the warming event.It can be seen clearly that the potential temperature at 0330 and 0400 BT was higher than at 0300 BT.At the same time,the gradient of the water vapor mixing ratio changed more obviously and there was a water vapor inversion(blue and red lines in Fig.7b). Without the warming event,the vertical profiles of the water vapor mixing ratio should have been similar to that at 0300 BT and the moisture content of the air should have been higher.The fact that the PBL became drier,especially below 200 m AGL,suggests that vertical mixing played an important role.When the temperature decreased again because of further radiative cooling,the trend of change of the gradient of potential temperature(green lines in Fig.7a)became similar to that before the warming event,and the water vapor mixing ratio increased as well(green lines in Fig.7b).The changes in the vertical profiles of the potential temperature and water vapor mixing ratio illustrate that vertical mixing appeared within the PBL,by which the warmer and drier air aloft mixed with the air near the surface,causing the warming event.
The vertical movement of the air changed during the warming event.There was a weak upward movement of air(black and gray lines in Fig.7c)and a convergence of air below 300 m AGL(black and gray lines in Fig.7d)before the temperature increased. After the temperature increased,however,the weak upward movement of air had reversed to a downward movement(red and blue lines in Fig.7c)and the air below 140 m AGL changed from convergence to divergence(red and blue lines in Fig.7d),especially for the air near 100 m AGL and near the surface.Furthermore,the downward vertical movement at 12 m AGL,which existed throughout the warming night became strongest and the downward movement in the entire PBL was enhanced gradually when the temperature started to increase.
The appearance of the downward vertical movement was related to the enhanced turbulence.Theturbulent kinetic energy(TKE)and eddy diffusivity for temperature were used to evaluate whether the turbulence was enhanced during the warming event.The value of TKE is defined as TKE=1/2×(σ2u+σ2v+σ2w),where u,v,and w are zonal,meridional,and vertical wind components,respectively,and σ represents the standard deviation of each variable(Sun et al.,2012). The TKE and eddy diffusivity for temperature both increased quickly and reached peak values when the temperature increased rapidly.Subsequently,they decreased rapidly to return to their original levels at 0400 BT(Figs.7e and 7f).Furthermore,the values above 40 m AGL were much larger than those below 40 m AGL.They increased with height rapidly and the peak values occurred between 200 and 300 m AGL.These elevated values indicated that turbulence was enhanced. Moreover,the deeper PBL simulated by the model also suggested that there was enhanced turbulence during the warming event(figure omitted).In addition,friction velocity increased suddenly 30 min prior to the onset of the warming(figure omitted).This indicated that turbulence near the surface was enhanced during the warming event.The small magnitude of the increase,however,suggested that strong divergent movement near the surface might have suppressed the turbulence.In contrast,the impact of strongly enhanced turbulence was more prominent in the upper PBL and the vertical mixing near the surface showed a good relationship with the strong divergent movement. Therefore,vertical mixing throughout the entire PBL indeed played the critical role in the evolution of the nocturnal warming event,especially in the upper atmospheric boundary layer,in which the vertical mixing was triggered by the enhanced turbulence.

Fig.6.Time series of the near-surface heating rate due to(a)horizontal advection and(b)vertical advection during the night of 24-25 June 2007.

Fig.7.Vertical profiles of simulated(a)potential temperature,(b)water vapor mixing ratio,(c)vertical wind speed(w),(d)divergence,(e)TKE,and(f)eddy diffusivity for temperature during the warming night.The gray dashed lines in(a,b)indicate the height of 100 m AGL,and the yellow line indicates the zero line.
Typically,the Richardson number(Ri),which combines the effects of buoyancy and wind shear,is an indicator with which to evaluate the development
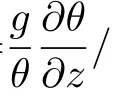
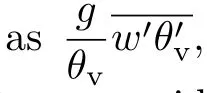
In fact,wind shear was the root cause of the turbulence.A simple and frequently used equation that adequately describes wind shear above a solid boundary is the power law,which is defined as s= ln[v(h)/v(hr)]/ln(h/hr),where v(h)and v(hr)are the wind speed at different heights(h and hr)(Farrugia,2003).The wind shear exponent between different heights increased continuously when the turbulence was enhanced,especially for wind shear in the upper atmosphere boundary layer(Fig.8c),where the turbulent kinetic energy and eddy diffusivity for temperature reached their maxima.This is the so-called lower-layer wind shear(Shu et al.,2013).An increase of the lower-layer wind shear is favorable for the development of mesoscale disturbances that in turn provide energy to strengthen the mesoscale system itself(Tao et al.,2013).
Actually,the increase in the wind shear exponent was related to a deep surface low-pressure system(Fig.9a)and a shear line(a very narrow zone with abrupt velocity change)on the weather map of 850 hPa(Fig.9b)during the warming night.The deep surface low-pressure system was located to the northwest of SACOL,southwest of which the wind direction changed from northwesterly to southeasterly.A shear line was located near SACOL,aligned in the northwest direction.The 850-hPa geopotential height in the area of this study was at about 140-150 m AGL,and the wind direction near the shear line changed from northwesterly to northeasterly.Besides,the wind shear orenhanced vertical mixing may also be influenced by the local terrain.
Fig.8.Time series of(a)Ri(the y-axis scale for the red lines is on the right),(b)buoyancy flux at 12 m AGL,(c)wind shear exponent,and(d)maximum Eady growth rate during the warming night.
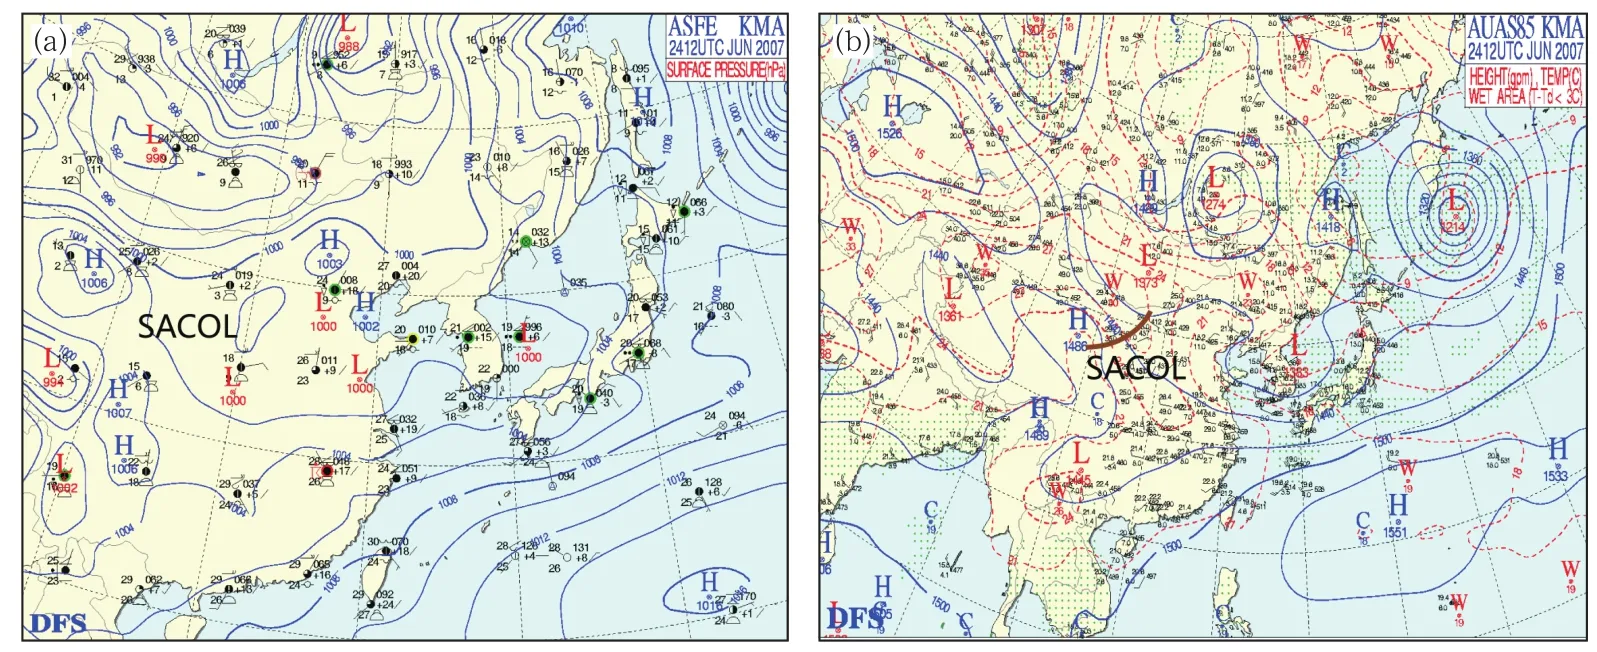
Fig.9.(a)Surface and(b)850-hPa synoptic weather maps at 2000 BT 24 June 2007,with a shear line(the brown line)located northwest of SACOL.The synoptic maps were archived by the Ocean University of China(http://222.195.136.24/ forecast.html).
When a cold front passes over mountainous terrain,the mixing is inhibited and the impact of the cold front on the warming is relatively gradual.However,over relatively level terrain,the temperature initially warms rapidly(Reeder et al.,1999;Sanders and Kessler,1999;Acevedo and Fitzjarrald,2001;Fiebrich and Crawford,2001;Salmond and McKendry,2002;Ha and Mahrt,2003;Doswell III and Haugland,2007;White,2009;Nallapareddy et al.,2011;Hu et al.,2013a). In general,the terrain of Lanzhou is gently sloping with heights increasing to the south and north,and with complex topography.In addition,the Qilian Mountains are located to the northwest of Lanzhou,and this geological feature deforms or slows fronts moving into the mountainous areas,which results in weaker cold fronts affecting Lanzhou.Recall that,of the 2391 nocturnal warming events identified in Lanzhou,only 72 obvious nocturnal warming events were detected.Hence,the topography might somewhat inhibit the development of strong warming events in Lanzhou.However,the possible impacts of the surrounding terrain on this case are a complex topic and we would need more observations at different stations to draw any definitive conclusions.
4.Conclusions and discussion
Nocturnal warming events were identified from the boundary layer meteorological measurements at the SACOL site during 2007-2008.Although previous studies have considered similar phenomena,most have been based on observational data,and detailed numerical studies of such events are rare.In addition,the physical and dynamical features of such nocturnal warming events and their formational mechanisms remain not clear.To address this,a nocturnal warming event that occurred during the night of 24-25 June 2007 at SACOL was simulated by using WRF model and analyzed in detail.
Observations revealed that the temperature increased by 2.5℃at around 0200 BT 25 June 2007 and the warming lasted for 4 h.Other essential features included that as the temperature increased suddenly,the atmospheric humidity decreased concurrently.After the warming event,the temperature decreased throughout the remainder of the night due to further radiative cooling,and it eventually returned to the pre-warming level.This warming event could not be explained by the radiative balance,change in heat flux near the surface,or a heat burst driven by particular weather systems.Thus,it was argued in this study that enhanced mechanical turbulent mixing was primarily responsible for the warming event.
The WRF simulation captured almost all of the important meteorological features of the warming event,including the temperature increase,air humid-ity decrease,changes in wind speed and direction,and their spatial distributions,although there were some discrepancies between the simulation and observations.In addition,the simulated results showed that the temperature and atmospheric humidity below 186 m AGL increased almost simultaneously.Vertical mixing played the dominant role in the warming event. Almost all related variables indicated that turbulence and vertical mixing were enhanced during the warming event.The enhanced turbulence was triggered by the wind shear.The occurrence of wind shear was caused by the evolution of the weather systems and the continuous development of the atmospheric baroclinicity,which converted more potential energy to kinetic energy.In fact,a shear line that existed on the weather map at 850 hPa was related to the wind shear.Enhanced wind shear changed the direction of movement of the air and it intensified the turbulence and vertical mixing.This resulted in the mixing of warmer and drier air aloft with the air near the surface,which ultimately caused the warming event.
Meteorology always influences the distribution of air pollutants(Hu et al.,2010;Zhang et al.,2015)and enhanced turbulence in the nocturnal boundary layer can also have implications for pollutant concentrations(Corsmeier et al.,1997;Reitebuch et al.,2000;Salmond and McKendry,2002;Hu et al.,2012,2013a). In terms of ozone,its surface concentration normally decreases during the night because of dry deposition and chemical reactions.However,the ozone concentration was found to increase during nocturnal warming events due to enhanced turbulent transport(Hu et al.,2013a).The concentrations of trace gases,such as carbon monoxide,ozone,sulfur dioxide,and oxides of nitrogen(NO/NO2/NOx)at SACOL were also examined for the event on the night of 24-25 June 2007.It was established that the warming event with enhanced vertical mixing and turbulence did affect the pollutant concentrations in the PBL(figure omitted),but the effect was less prominent and more complex than that found by Hu et al.(2013a),presumably because of the different chemical regimes and turbulence intensities.
Acknowledgments.We gratefully thank the Semi-Arid Climate and Environment Observatory of Lanzhou University for providing the observational data.
Acevedo,O.C.,and D.R.Fitzjarrald,2001:The early evening surface-layer transition:Temporal and spatial variability.J.Atmos.Sci.,58,2650-2667.
An,Z.S.,2000:The history and variability of the East Asian paleomonsoon climate.Quaternary Sci.Rev.,19,171-187.
Banta,R.M.,Y.L.Pichugina,and R.K.Newsom,2003:Relationship between low-level jet properties and turbulence kinetic energy in the nocturnal stable boundary layer.J.Atmos.Sci.,60,2549-2555.
Banta,R.M.,L.Mahrt,D.Vickers,et al.,2007:The very stable boundary layer on nights with weak lowlevel jets.J.Atmos.Sci.,64,3068-3090.
Bougeault,P.,and P.Lacarrere,1989:Parameterization of orography-induced turbulence in a mesobetascale model.Mon.Wea.Rev.,117,1872-1890.
Chen,F.,and J.Dudhia,2001:Coupling an advanced land surface-hydrology model with the Penn State-NCAR MM5 modeling system.Part I:Model implementation and sensitivity.Mon.Wea.Rev.,129,569-585.
Clarke,R.H.,R.K.Smith,and D.G.Reid,1981:The morning glory of the gulf of Carpentaria:An atmospheric undular bore.Mon.Wea.Rev.,109,1726-1750.
Corsmeier,U.,N.Kalthoff,O.Kolle,et al.,1997:Ozone concentration jump in the stable nocturnal boundary layer during an LLJ-event.Atmos.Environ.,31,1977-1989.
Derbyshire,S.H.,1999:Boundary-layer decoupling over cold surfaces as a physical boundary-instability. Bound.-Layer Meteor.,90,297-325.
Doswell III,C.A.,and M.J.Haugland,2007:A comparison of two cold fronts-effects of the planetary boundary layer on the mesoscale.Electronic J.Severe Storms Meteor.,2,1-12.
Dudhia,J.,1989:Numerical study of convection observed during the winter monsoon experiment using a mesoscale two-dimensional model.J.Atmos.Sci.,46,3077-3107.
Eady,E.T.,1949:Long waves and cyclone waves.Tellus,1,33-52.
FangShibo,TanYankai,andRenSanxue,2010:Winter wheat yields decline with spring highernight temperature by controlled experiments.Scientia Agricultura Sinica,43,3251-3258,doi:10.3864/j.issn.0578-1752.2010.15.025.(in Chinese)
Farrugia,R.N.,2003:The wind shear exponent in a Mediterranean Island climate.Renew.Energy,28,647-653.
Fiebrich,C.A.,and K.C.Crawford,2001:The impact of unique meteorological phenomena detected by the Oklahoma Mesonet and ARS Micronet on automated quality control.Bull.Amer.Meteor.Soc.,82,2173-2187.
Galperin,B.,S.Sukoriansky,and P.S.Anderson,2007:On the critical Richardson number in stably stratified turbulence.Atmos.Sci.Lett.,8,65-69.
Grell,G.A.,and S.R.Freitas,2014:A scale and aerosol aware stochastic convective parameterization for weather and air quality modeling.Atmos.Chem. Phys.,14,5233-5250,doi:10.5194/acp-14-5233-2014.
Ha,K.-J.,and L.Mahrt,2003:Radiative and turbulent fluxes in the nocturnal boundary layer.Tellus A,55,317-327.
Hacker,J.P.,and W.M.Angevine,2013:Ensemble data assimilation to characterize surface-layer errors in numerical weather prediction models.Mon.Wea. Rev.,141,1804-1821.
Hong,S.Y.,J.Dudhia,and S.H.Chen,2004:A revised approach to ice microphysical processes for the bulk parameterization of clouds and precipitation.Mon. Wea.Rev.,132,103-120.
Hoskins,B.J.,and P.J.Valdes,1990:On the existence of storm-tracks.J.Atmos.Sci.,47,1854-1864.
Hu,X.M.,J.W.Nielsen-Gammon,and F.Zhang,2010:Evaluation of three planetary boundary layer schemes in the WRF model.J.Appl.Meteor.Climatol.,49,1831-1844.
Hu,X.M.,D.C.Doughty,K.J.Sanchez,et al.,2012:Ozone variability in the atmospheric boundary layer in Maryland and its implications for vertical transport model.Atmos.Environ.,46,354-364.
Hu,X.M.,P.M.Klein,M.Xue,et al.,2013a:Enhanced vertical mixing associated with a nocturnal cold front passage and its impact on near-surface temperature and ozone concentration.J.Geophys. Res.,118,2714-2728.
Hu,X.M.,P.M.Klein,and M.Xue,2013b:Evaluation of the updated YSU planetary boundary layer scheme within WRF for wind resource and air quality assessments.J.Geophys.Res.,118,10490-10505,doi:10.1002/jgrd.50823.
Huang Jianping,Zhang Wu,Zuo Jinqing,et al.,2008:An overview of the semi-arid climate and environment research observatory over the Loess Plateau.Adv. Atmos.Sci.,25,906-921.
LeMone,M.A.,M.Tewari,F.Chen,et al.,2013:Objectively determined fair-weather CBL depths in the ARW-WRF model and their comparison to CASES-97 observations.Mon.Wea.Rev.,141,30-54,doi:10.1175/MWR-D-12-00106.1.
Liang,J.N.,L.Zhang,Y.Wang,et al.,2014:Turbulence regimes and the validity of similarity theory in the stable boundary layer over complex terrain of the Loess Plateau,China.J.Geophys.Res.,119,6009-6021.
Lindzen,R.S.,and B.Farrell,1980:A simple approximate result for the maximum growth rate of baroclinic instabilities.J.Atmos.Sci.,37,1648-1654.
Mlawer,E.J.,S.J.Taubman,P.D.Brown,et al.,1997:Radiative transfer for inhomogeneous atmospheres:RRTM,a validated correlated-k model for the longwave.J.Geophys.Res.,102,16663-16682.
Nallapareddy,A.,A.Shapiro,and J.J.Gourley,2011:A climatology of nocturnal warming events associated with cold-frontal passages in Oklahoma.J.Appl. Meteor.Climatol.,50,2042-2061.
Nappo,C.J.,1991:Sporadic breakdowns of stability in the PBL over simple and complex terrain.Bound.-Layer Meteor.,54,69-87.
Pan Xiaoduo,Li Xin,Ran Youhua,et al.,2012:Impact of underlying surface information on WRF modeling in Heihe River basin.Plateau Meteor.,31,657-667.(in Chinese)
Poulos,G.S.,W.Blumen,D.C.Fritts,et al.,2002:CASES-99:A comprehensive investigation of the stable nocturnal boundary layer.Bull.Amer.Meteor.Soc.,83,555-581.
Qian Minwei and Li Jun,1996:Intermittent turbulence and temperature burst in the nocturnal surface layer.Chinese J.Atmos.Sci.,20,250-254.(in Chinese)
Reeder,M.J.,R.K.Smith,R.Deslandes,et al.,1999:Subtropical fronts observed during the 1996 central Australian fronts experiment.Aust.Meteor.Mag.,49,181-200.
Reitebuch,O.,A.Strassburger,S.Emeis,et al.,2000:Nocturnal secondary ozone concentration maxima analyzed by sodar observations and surface measurements.Atmos.Environ.,34,4315-4329.
Salmond,J.A.,and I.G.McKendry,2002:Secondary ozone maxima in a very stable nocturnal boundary layer:Observations from the lower Fraser Valley,BC.Atmos.Environ.,36,5771-5782.
Sanders,F.,and E.Kessler,1999:Frontal analysis in the light of abrupt temperature changes in a shallow valley.Mon.Wea.Rev.,127,1125-1133.
Shin,H.H.,and S.Y.Hong,2011:Intercomparison of planetary boundary-layer parametrizations in the WRF model for a single day from CASES-99. Bound.-Layer Meteor.,139,261-281,doi:10.1007/s10546-010-9583-z.
Shu Shoujuan,Wang Yuan,and Bai Lina,2013:Insight into the role of the lower-layer vertical wind shear in tropical cyclone intensification over the western North Pacific.Acta Meteor.Sinica,27,356-363.
Simmonds,I.,and E.P.Lim,2009:Biases in the calculation of Southern Hemisphere mean baroclinic eddy growth rate.Geophys.Res.Lett.,36,doi:10.1029/2008GL036320.
Smith,R.K.,M.J.Redder,N.J.Tapper,et al.,1995:Central Australian cold fronts.Mon.Wea.Rev.,123,16-38.
Soler,M.R.,C.Infante,P.Buenestado,et al.,2002:Observations of nocturnal drainage flow in a shallow gully.Bound.-Layer Meteor.,105,253-273.
Steeneveld,G.J.,B.J.H.Van De Wiel,and A.A.M. Holtslag,2006:Modelling the Arctic stable boundary layer and its coupling to the surface.Bound. -Layer Meteor.,118,357-378.
Stull,R.B.,1988:An Introduction to Boundary Layer Meteorology.Kluwer,Netherlands,666 pp.
Sun,J.L.,L.Mahrt,R.M.Banta,et al.,2012:Turbulence regimes and turbulence intermittency in the stable boundary layer during CASES-99.J.Atmos. Sci.,69,338-351.
Tao Jianjun,Wang Fang,Li Chaokui,et al.,2013:Influence of vertical shear of basic tangential wind on the development and maintenance of typhoon.Acta Meteor.Sinica,27,273-281.
Vallis,G.K.,2006:Atmospheric and Oceanic Fluid Dynamics:Fundamentals and Large-Scale Circulation. Cambridge University Press,UK,745 pp.
Van De Wiel,B.J.H.,R.J.Ronda,A.F.Moene,et al.,2002:Intermittent turbulence and oscillations in the stable boundary layer over land.Part I:A bulk model.J.Atmos.Sci.,59,942-958.
Van De Wiel,B.J.H.,A.F.Moene,O.K.Hartogensis,et al.,2003:Intermittent turbulence in the stable boundary layer over land.Part III:A classification for observations during CASES-99.J.Atmos.Sci.,60,2509-2522.
Wang,G.Y.,J.P.Huang,W.D.Guo,et al.,2010:Observation analysis of land-atmosphere interactions over the Loess Plateau of Northwest China.J.Geophys.Res.,115,doi:10.1029/2009JD013372.
Weber,A.H.,and R.J.Kurzeja,1991:Nocturnal planetary boundary layer structure and turbulence episodes during the project STABLE field program. J.Appl.Meteor.,30,1117-1133.
White,L.D.,2009:Sudden nocturnal warming events in Mississippi.J.Appl.Meteor.Climatol.,48,758-775.
Xie,B.,J.C.H.Fung,A.Chan,et al.,2012:Evaluation of nonlocal and local planetary boundary layer schemes in the WRF model.J.Geophys.Res.,117,D12103,doi:10.1029/2011JD017080.
ˇZabkar,R.,D.Koracin,and J.Rakovec,2013:A WRF/Chem sensitivity study using ensemble modelling for a high ozone episode in Slovenia and the northern Adriatic area.Atmos.Environ.,77,990-1004,doi:10.1016/j.atmosenv.2013.05.065.
Zhang Hongliang,Wang Yungang,Hu Jianlin,et al.,2015:Relationships between meteorological parameters and criteria air pollutants in three megacities in China.Environ.Res.,140,242-254,doi:10.1016/j.envres.2015.04.004.
Zhang Suotie,Ma Shuqing,Pang Yi,et al.,2014:An inquiry on forecast model of maximum and minimum temperature in large sunlight greenhouse in Northeast China.Chinese Agricultural Science Bulletin,30,249-253.(in Chinese)
Ma Yuanyuan,Yang Yi,Hu Xiao-Ming,et al.,2015:Characteristics and mechanisms of the sudden warming events in the nocturnal atmospheric boundary layer:A case study using WRF. J.Meteor.Res.,29(5),747-763,
10.1007/s13351-015-4101-3.
(Received October 13,2014;in final form July 19,2015)
 Journal of Meteorological Research2015年5期
- Journal of Meteorological Research的其它文章
- Interannual Variability of the Wintertime Northern Branch High Ridge in the Subtropical Westerlies and Its Relationship with Winter Climate in China
- Analysis of Tibetan Plateau Vortex Activities Using ERA-Interim Data for the Period 1979-2013
- A Piecewise Modeling Approach for Climate Sensitivity Studies:Tests with a Shallow-Water Model
- A New Evaporation Duct Climatology over the South China Sea
- Cloud Radiative Forcing Induced by Layered Clouds and Associated Impact on the Atmospheric Heating Rate
- Dust Aerosol Effects on Cirrus and Altocumulus Clouds in Northwest China