
Two Paradoxes in Linear Regression Analysis
2016-12-09 08:30GeFENGJingPENGDongkeTUJuliaZHENGChangyongFENG
上海精神医学 2016年6期
Ge FENG, Jing PENG, Dongke TU, Julia Z. ZHENG, Changyong FENG,3*
•Biostatistics in psychiatry (36)•
Two Paradoxes in Linear Regression Analysis
Ge FENG1, Jing PENG2, Dongke TU4, Julia Z. ZHENG5, Changyong FENG2,3*
Forward selection, backward elimination, univariate regression; multiple regression
1. Introduction
Linear regression is the most widely used statistical model in data analysis.[1]Wide availability and ease of use of statistical software packages, such as SAS, SPSS and R make the linear regression accessible to people without any formal statistical training. Although wise use of statistical methods such as linear regression helps us, even novices, develop a better understand of data and guide our decisions, it also causes confusion in interpretation of results and paradoxical findings.For example, we are often asked by our biomedical collaborators questions like “When I run the univariate regression of Y on the predictor , the p-value is very small. However, if I add some other predictors in the model, is not signif i cant anymore. Why?” The same problem also occurs in logistic regression for binary outcome[2], log-linear regression for counting data[2],and Cox proportional hazards regression for survival data.[3]
A simple answer to this question is the different assumptions between the univariate and multiple regression models. However, this is not so meaningful for non-statisticians. This is discussed in Section 2.
In many medical studies, regression analysis involves a large of number of independent variables,or predictors. Model selection is required to find the predictors that are signif i cantly associated with an outcome, or dependent variable, of interest. Here is how the model selection was done in a recent paper published in JAMA Surgery[4]:
“The administrative database was then evaluated by means of univariate and multivariate logistic regression. First we identified variables that were associated (P < .20) with readmission, the dependent variable. These potential confounders were then entered in multivariate stepwise (backward elimination) logistic regression, with readmission as the dependent variable.A logistic regression model was constructed to identify patient factors associated with readmission.”
This forward selection procedure as the fi rst step to weed out “non-signif i cant” predictors has been become almost the gold standard for variable selection and has been used in many papers published in top medical journals.[5-24]The key idea of this method is fi rst to run a univariate regression on each predictor. If the p-value is less than some pre-specif i ed level, for example 0.1,then the predictor is used in the multiple regression.Otherwise, the predictor is assumed to have no signif i cant effect on the outcome. This method seems quite logical and intuitively meaningful. Indeed, it has been used and is still being used by the biomedical and other research communities. Is this a valid procedure?
In this paper we use linear regression analysis to show two paradoxes in regression analysis. In Section 2 we use some very basic theory to show how the univariate regression and multiple regression make different assumptions on the models. We use examples and simulation studies to show two paradoxes in regression analysis in Section 3. Section 4 brief l y discusses the transitivity of correlation. Our results clearly invalidate the model selection procedure widely used in biomedical research.
2. Basic theory
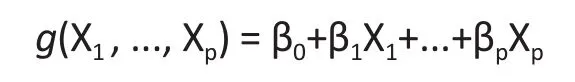
Let (Y, X1, ..., Xp) be a random vector, where X1, ..., Xpare called the covariates (independent variables),and Y is called the outcome (dependent variables).The regression of Y on (X1, ..., Xp) is the conditional expectation of Y given (X1, ..., Xp), denoted by E[Y|X1, ...,Xp] which is a measurable function of (X1, ..., Xp). Denote the function by g(X1, ..., Xp). Without knowing the joint distribution of (X1, ..., Xp, Y ), in general, the form of g(X1, ..., Xp) is unknown. In statistical analysis, we usually assume some mathematically tractable forms of g(X1, ..., Xp). For example, the linear regression analysis[1]assumes that
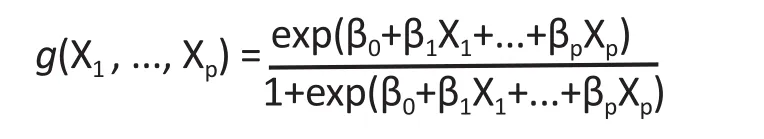
In the logistic regression analysis with 0-1 outcome[2],we assume that
In this paper we assume the outcome Y is continuous.Let

It is obvious that E[Y|X1, ..., Xp] = 0. We consider a stronger form of the liner regression model

and assume that given X1, ..., Xp, the variance of ε
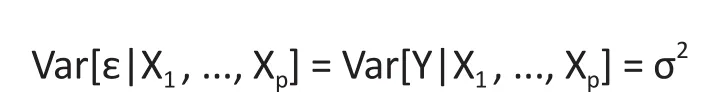
which does not depend on (X1, ..., Xp). This assumption is also used in most statistical literature on linear model.[1]We further assume that Xk, k = 1, . . . , p, have finite second moments.
From (1) we have

Let Zk= E[Xk|X1] , k = 1, . . . , p. (It is clear that Zk= Xk).Then the regression of Y on X1is

which still has a linear form. Let Then

Although (3) has the same form as (1), they are fundamentally different in the error terms. Note that E[η|X1] = 0, Cov( Zk, η) = 0, k = 1, . . . , p. However, the conditional variance of η given X1is

Therefore, the conditional variance of η given X1is no longer a constant. This violates the fundamental assumption used in linear regression model.[1]
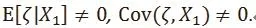
The univariate linear regression of on assumes the following form of the model
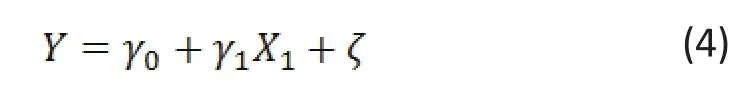
From (3) we know that generall
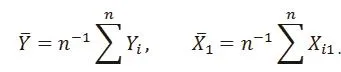
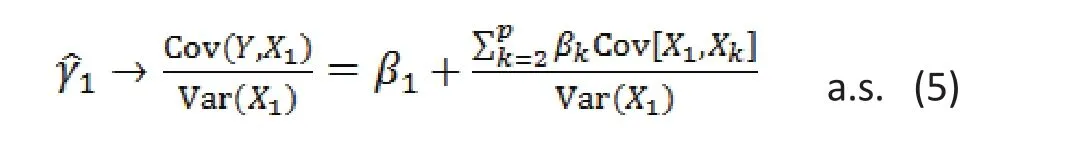
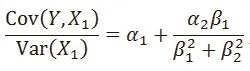
Suppose (Y, Xi1, ..., Xip), i = 1, . . . , n, is a random sample from (1). Let Letbe the least square estimate of the univariate regression of Yion X1iin (4). Then
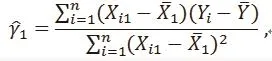
and
3. Two paradoxes in linear regression analysis
In this section we show why the estimates of the coefficient of some covariates in the univariate regression and in the multiple regression do not match.More specif i cally, we show that in some cases, the estimate from the univariate regression is signif i cant,but the result from the multiple regression is not. On the other hand, in some cases, the result is signif i cant for the multiple regression but not for the univariate regression.
Suppose (1) is the true multiple regression model.The univariate regression model uses model (4) by assuming that= 0. This assumption is generally wrong unless E[Xk|X1] is a constant (k = 2, . . . , p). Hence,with a correct multiple regression model, the estimate of the univariate analysis is based on a wrong model.This is the reason why the results from univariate regression and multiple regression do not match.Furthermore, result (5) shows that there is no clear interpretation of the estimate in the univariate analysis.
We discuss two paradoxes related to univariate and multiple regressions through both theoretical derivations and simulation studies.
3.1 Signif i cant covariate effect in multiple regression but not in univariate regression
Let X2, X3, X4and ε be independent random variables with standard normal distributions. Consider the following model

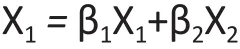
which is 0 if and only if
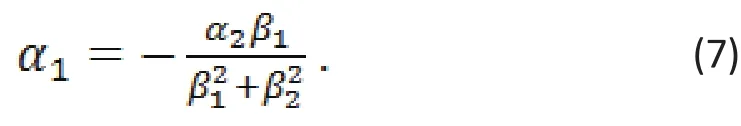
From (5) we know that if (7) is true, the least square estimatorof the coefficient of the univariate regression of Y on X1will not be signif i cant, even though X1is necessary in specifying model (6).
Example 1.Let α1= -3/5, α2= 3, α3= 4, β1= 1, β2= 2 in (6).The true model is

Table 1 shows the simulation result of the estimates and standard deviations of the coefficient of X1in both univariate and multiple regressions after 10,000 replications. For a wide range of sample sizes, the least square estimator of the coefficient of X1in the multiple regression is very close to the true value, and the standard deviation decreases signif i cantly with the sample size. However, the estimate of coefficient in the univariate analysis is very close to 0 in all cases.
According to the practice in medical publications[4-24], X1will not enter the multiple regression. Table 2 shows the result of the least square estimates of the coefficients of X2and X3after X1is removed in (8). It is easy to see that the estimate of the coefficient of X2is dramatically biased in the multiple regression after X1is removed due to the univariate analysis.
3.2 Signif i cant covariate effect in univariate regression but not in multiple regression
Suppose X1, X2, X3and ε are independent standard normal random variables, and X4= β1X1+β2X2,where
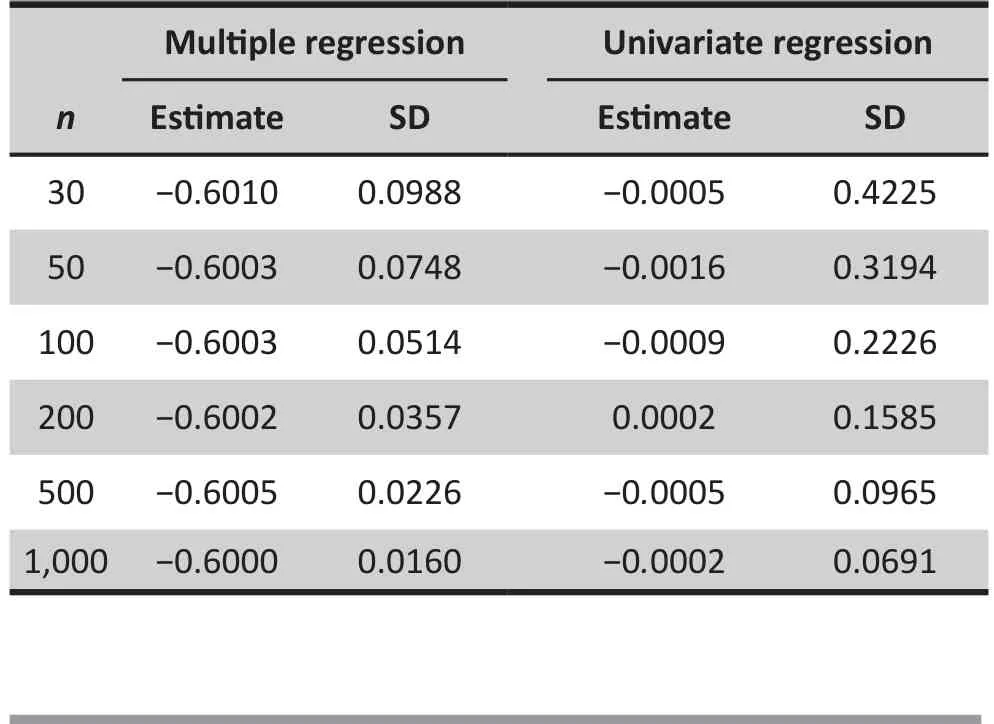
Table 1. Estimate of the regression coefficientof X1
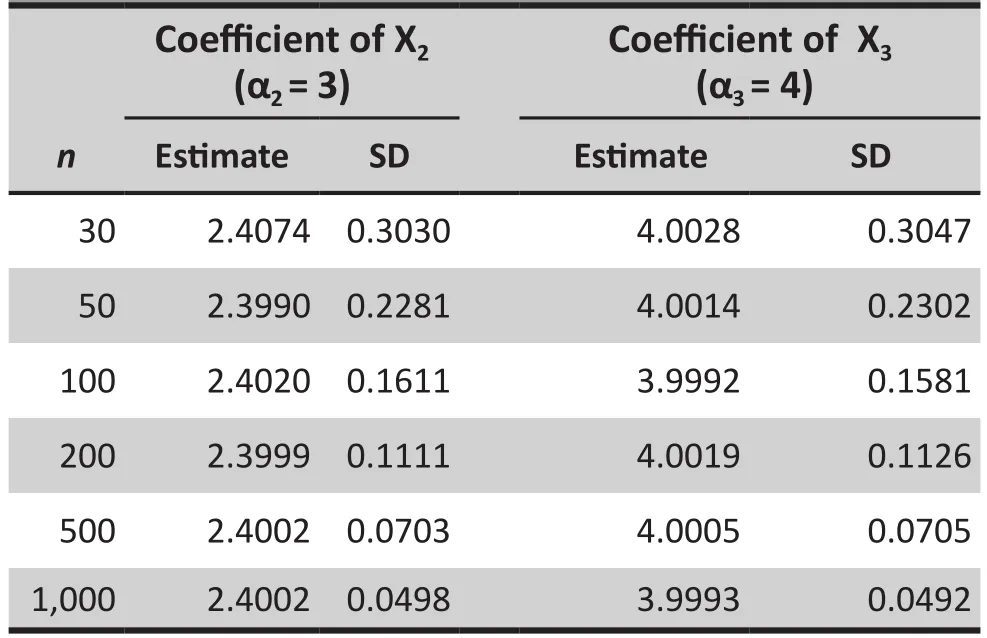
Table 2. Estimates of the regression coefficients of X2 and X3 with X1 being removed
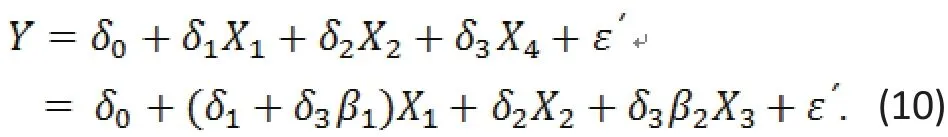
Consider the following true model is

If (9) is expanded to include X4and the expanded model still satisf i es the conditions of the linear regression, then the regression equation becomes
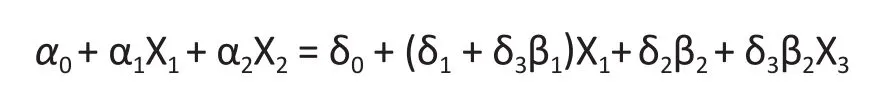
From (9) and (10) we have

or
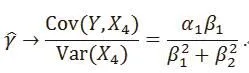
Example 2.Let α0= 0, α1= 1, α2= 2 in (9) and β1= β2=1, Table 3 shows the least square estimates of the coefficient of X4in both univariate and multiple linear regressions after 10,000 replications. For all sample sizes, the univariate regression shows that X4has very signif i cant effect on Y. However, in the multiple regression, the effect is not signif i cant.
4. Transitivity of correlation
Another issue around the regression analysis is the transitivity of the correlation in the interpretation.For example, some people may say like that: “Since factor A is highly correlated with outcome Y, and factor A and factor B are highly correlated, then B should be correlated with Y.” It seems very intuitive and reasonable that correlation is transitive. Unfortunately,this is not true. Here is a theoretical example. Suppose X and Z are independent standard normal random variables and Y=X+Z. It’s clear that the correlation between X and Y, and between Y and Z are both 0.707.However, the correlation between X and Z is 0.

Table 3. Estimate of the regression coefficient of X4
In our Example 2, the correlations between X4and X1and Y are 0.707 and 0.408, respectively. However,we proved in Section 3.2 shows that X4has no role in the multiple regression if X1and X2are in the model although X4is not a linear combination of X1and X2.
5. Discussion
Regression analysis in medical research usually involves many predictors (independent variables). The model selection is needed to pick covariates having signif i cant effect on the outcome. A widely used method in medical publications[4-24]is first to screen those covariates through univariate analysis. If a covariate is not significant in the univariate regression analysis,it will not enter the multiple regression analysis. The underlying assumption of this method is that is a covariate is significant in the multiple regression only if it is significant in the univariate regression analysis.Our results indicate that this assumption is wrong.A covariate may be very signif i cant in the univariate regression but has no role in the multiple regression (see Example 2 in Section 3). On the other hand, a covariate is a necessary part of a multiple regression but may be not correlated with the outcome (see Example 1 in Section 3). The initial univariate screening method totally ignores the correlation among covariates.There is no theoretical work to support this method.Our simulation results clearly show that the multiple regression results after the univariate screening may be dramatically biased and misleading. The biomedical community should stop using this procedure in their research and publications.
Funding
None
Conflict of interest statement
The authors report no conflict of interest related to this manuscript.
Author’s contribution
Ge Feng and Changyong Feng: theoretical derivation and revision
Jing Peng, Dongke Tu, and Julia Z. Zheng: Simulation and manuscript drafting
1. Seber GAF, Lee AJ. Linear regression analysis (2nd ed).Hoboken, NJ: Wiley; 2003
2. Agresti A. Categorical data analysis (2nd ed). Hoboken, NJ:Wiley; 2002
3. Cox DR. Regression models and life-tables (with discussion).J R STAT SOC. 1972; B. 34:187-220. doi: http://dx.doi.org/10.2307/2985181
4. McIntyre LK, Arbabi S, Robinson EF, Maier RV. Analysis of Risk Factors for Patient Readmission 30 Days Following Discharge From General Surgery. JAMA Surgery. 2016; (Epub ahead of print). doi: http://dx.doi.org/10.1001/jamasurg.2016.1258
5. Bardia A, Sood A, Mahmood F, Orhurhu V, Mueller A,Montealegre-Gallegos M, et al. Combined epiduralgeneral anesthesia vs general anesthesia alone for elective abdominal aortic aneurysm repair. JAMA Surgery. 2016;(Epub ahead of print). doi: http://dx.doi.org/10.1001/jamasurg.2016.2733
6. Barlesi F, Mazieres J, Merlio JP, Debieuvre D, Mosser J, Lena H,et al. Routine molecular prof i ling of patients with advanced non-small-cell lung cancer: results of a 1-year nationwide programme of the French Cooperative Thoracic Intergroup(IFCT). Lancet. 2016; 387: 1415-1426. doi: http://dx.doi.org/10.1016/S0140-6736(16)00004-0
7. Brooks GA, Kansagra AJ, Rao SR, Weitzman JI, Linden EA,Jacobson JO. A clinical prediction model to assess risk for chemotherapy-related hospitalization in patients initiating palliative chemotherapy. JAMA Oncology. 2015; 1(4): 441-447; doi: http://dx.doi.org/10.1001/jamaoncol.2015.0828
8. Cronin PR, DeCoste L, Kimball AB. A multivariate analysis of dermatology missed appointment predictors. JAMA Dermatology. 2013; 149(12): 1435-1437. doi: http://dx.doi.org/10.1001/jamadermatol.2013.5771
9. Fivez T, Kerklaan D, Mesotten D, Verbruggen S, Wouters PJ,Vanhorebeek I, et al. Early versus late parenteral nutrition in critically Ill children. N Engl J Med. 2016; 374(12): 1111-1122. doi: http://dx.doi.org/10.1056/NEJMoa1514762
10. Geng E, Kreiswirth B, Burzynski J, Schluger NW. Clinical and radiographic correlates of primary and reactivation tuberculosis: a molecular epidemiology study. JAMA.2005; 293(22): 2740-2745. doi: http://dx.doi.org/10.1001/jama.293.22.2740
11. Hole J, Hirsch M, Ball E, Meads C. Music as an aid for postoperative recovery in adults: a systematic review and meta-analysis. Lancet. 2015; 386: 1659-1671. doi: http://dx.doi.org/10.1016/S0140-6736(15)60169-6
12. International CLL-IPI working group. An international prognostic index for patients with chronic lymphocytic leukaemia (CLL-IPI): A meta-analysis of individual patient data. Lancet Oncology. 2016; 17(6): 779-790. doi: http://dx.doi.org/10.1016/S1470-2045(16)30029-8
13. Leon MB, Smith CR, Mack MJ, Makkar RR, Svensson LG,Kodali SK, et al. Transcatheter or surgical aortic-valve replacement in intermediate-risk patients. N Engl J Med.2016; 374(17): 1609-1620. doi: http://dx.doi.org/10.1056/NEJMoa1514616
14. Li Y, Stocchi L, Cherla D, Liu X, Remzi FH. Association of preoperative narcotic use with postoperative complications and prolonged length of hospital stay in patients with crohn disease. JAMA Surgery. 2016; 151(8): 726-734. doi: http://dx.doi.org/10.1001/jamasurg.2015.5558
15. Lorant V, Deliѐge D, Eaton W, Robert A, Philippot P, Ansseau M. Socioeconomic Inequalities in Depression: A Meta-Analysis. Am J Epidemiol. 2003; 157(2): 98-112. doi: http://dx.doi.org/10.1093/aje/kwf182
16. van der Meer AJ, Veldt BJ, Feld JJ, Wedemeyer H, Dufour JF,Lammert F, et al. Association between sustained virological response and all-cause mortality among patients with chronic hepatitis C and advanced hepatic fi brosis. JAMA.2012; 308(24): 2584-2593. doi: http://dx.doi.org/10.1001/jama.2012.144878
17. Mingrone G, Panunzi S, De Gaetano A, Guidone C, Iaconelli A, Nanni G, et al. Bariatricmetabolic surgery versus conventional medical treatment in obese patients with type 2 diabetes: 5 year follow-up of an open-label, single-centre,randomized controlled trial. Lancet. 2015; 386: 964-973. doi:http://dx.doi.org/10.1016/S0140-6736(15)00075-6
18. Nelson KB, Ellenberg JH. Antecedents of cerebral palsy:I. univariate analysis of risks. Am J Dis Child. 1985;139(10): 1031-1038. doi: http://dx.doi.org/10.1001/archpedi.1985.02140120077032
19. Nelson KB, Ellenberg JH. Antecedents of cerebral palsy:Multivariate analysis of risk. N Engl J Med. 1986; 315(2): 81-86. doi: http://dx.doi.org/10.1056/NEJM198607103150202
20. NICE-SUGAR Study Investigators. Hypoglycemia and risk of death in critically ill patients. N Engl J Med. 2012; 367(12):1108-1118. doi: http://dx.doi.org/10.1056/NEJMoa1204942
21. Pagѐs F, Berger A, Camus M, Sanchez-Cabo F, Costes A,Molidor R, et al. Effector memory T cells, early metastasis,and survival in colorectal cancer. N Engl J Med. 2005;353(25): 2654-2666. doi: http://dx.doi.org/10.1056/NEJMoa051424
22. Schwed AC, Boggs MM, Pham XD, Watanabe DM,Bermudez MC, Kaji AH, et al. Association of admission laboratory values and the timing of endoscopic retrograde cholangiopancreatography with clinical outcomes in acute cholangitis. JAMA Surgery. 2016; (Epub ahead of print). doi:http://dx.doi.org/10.1001/jamasurg.2016.2329
23. Templin C, Ghadri JR, Diekmann J, Napp LC, Bataiosu DR, Jaguszewski M, et al. Clinical features and outcomes of takotsubo (stress) cardiomyopathy. N Engl J Med.2015; 373(10): 929-938. doi: http://dx.doi.org/10.1056/NEJMoa1406761
24. Wood GC, Benotti PN, Lee CJ, Mirshahi T, Still CD, Gerhard GS, Lent MR. Evaluation of the association between preoperative clinical factors and long-term weight loss after roux-en-y gastric bypass. JAMA Surgery. 2016;(Epub ahead of print). doi: http://dx.doi.org/10.1001/jamasurg.2016.2334

Ge Feng is a graduate student in the School of Geophysics and Oil Resources at Yangtze University,Wuhan, Hubei, China. His research interest includes statistical analysis in rock physics.
线性回归分析中的两个悖论
Feng G, Peng J, Dongke TU, Zheng JZ, Feng C
向前选择,向后消除,单变量回归,多元回归
Regression is one of the favorite tools in applied statistics. However, misuse and misinterpreta-tion of results from regression analysis are common in biomedical research. In this paper we use statistical theory and simulation studies to clarify some paradoxes around this popular statistical method. In particular, we show that a widely used model selection procedure employed in many publications in top medical journals is wrong. Formal procedures based on solid statistical theory should be used in model selection.
[Shanghai Arch Psychiatry. 2016; 28(6): 355-360.
http://dx.doi.org/10.11919/j.issn.1002-0829.216084]
1School of Geophysics and Oil Resource, Yangtze University, Wuhan, China
2Department of Biostatistics & Computational Biology, University of Rochester, Rochester, NY, USA
3Department of Anesthesiology, University of Rochester, Rochester, NY, USA
4School of Philosophy, Wuhan University, Wuhan, China
5Department of Microbiology and Immunology, McGill University, Montreal, QC, Canada
*correspondence: Dr. Changyong Feng. Mailing address: Department of Biostatistics and Computational Biology, University of Rochester, 601 Elmwood Ave., Box 630, Rochester, NY, USA. Postcode: NY 14642. E-mail: Changyong_feng@urmc.rochester.edu
概述:回归是应用统计学中最受欢迎的工具之一。然而,回归分析结果的误用和误解在生物医学研究中是常见的。本文运用统计理论和模拟研究来说明有关这种普遍使用的统计方法的一些悖论。我们还特别指出在顶级医学期刊发表的很多文章中广泛使用的模型选择程序事实上是错误的。模型选择使用哪一种步骤化程序需基于可靠的统计理论。
猜你喜欢
科学与社会(2022年4期)2023-01-17
保健医苑(2022年1期)2022-08-30
全科护理(2022年19期)2022-07-09
全科护理(2022年16期)2022-06-09
全科护理(2022年10期)2022-04-07
全科护理(2022年8期)2022-03-23
科学与社会(2021年4期)2022-01-19
数学小灵通·3-4年级(2021年11期)2021-12-02
当代陕西(2019年9期)2019-05-20
图书馆建设(2018年5期)2018-07-10

- 上海精神医学的其它文章
- Effects of transcranial direct current stimulation (tDCS) for auditory hallucinations: A systematic review
- Effect of repetitive transcranial magnetic stimulation on cigarette smoking in patients with schizophrenia
- Effect of clonazepam co-administered with clozapine on the serum clozapine and norclozapine concentration of patients with schizophrenia: A Retrospective Survey
- Eye movement indices in the study of depressive disorder
- Comparative analysis of results from a cognitive emotion regulation questionnaire between international students from West Asia and Xinjiang college students in China
- Why is diagnosing MDD challenging?