
Optimal design of heat exchanger header for coal gasification in supercritical water through CFD simulations☆
2017-05-29 10:48LeiHuangLinQiHongnaWangJinliZhangXiaoqiangJia
Lei Huang ,Lin Qi,Hongna Wang ,Jinli Zhang ,Xiaoqiang Jia ,,*
1 Department of Biochemical Engineering,School of Chemical Engineering and Technology,Tianjin University,Tianjin 300072,China
2 Key Laboratory of Systems Bioengineering(Ministry of Education),Tianjin University,Tianjin 300072,China
3 SynBio Research Platform,Collaborative Innovation Center of Chemical Science and Engineering(Tianjin),School of Chemical Engineering and Technology,Tianjin University,Tianjin 300072,China
1.Introduction
With the increased stringency of environmental requirements,the demand for clean energy resources increases year by year.Coalgasification technology is an effective measure to make up for the clean energy shortage[1–6].Forits relatively high yield ofclean energy products such as CH4and H2compared to traditional coal gasification[7–10],coal gasification in supercriticalwater(SCW)has been increasingly investigated in recentyears[11,12].For the continuous process of coalgasification in SCW,heat exchangers are essential to preheat feed and recycle energy from products,as well as to convey feed.Particle deposition and tube plugging are common phenomena in preheaters,because the feed often contains a significant number of solid particles.Due to impingement of solid particles,large amounts of accumulated particles would further aggravate corrosion on the heater surface,especially in SCW conditions[13].Furthermore,the low uniformity of particle distribution,which is greatly influenced by hydrodynamics,would lead to tube plate worming and low heattransfer efficiency.Optimizing the exchanger header structure would resolve those problems.But the rigorous operational conditions under high temperature and pressure in supercritical water make it difficult to study the hydrodynamics of exchangers through experiment.
Numerical simulation based on computational fluid dynamics(CFD)calculations can provide a feasible way to determine the hydrodynamics of an exchanger under different conditions.Many researchers have employed this technique to optimize the design of heat exchangers.Bhuttaet al.[14]reviewed CFD application in designs of various types of heat exchangers.In particular,CFD has been employed by many researchers to optimize the shelland tube heatexchanger structure.Brennanetal.[15]proved thatthe axialentry flowwasbetterthan side entry for heating slurry,but the effect was influenced considerably by inlet pipe con figuration.Tube damage primarily occurs in tube inlets,because the high velocity angle of the slurry often leads to flow separation in the tube inlets[15].Kimet al.[16]studied different designs of shell and tube heat exchanger headers with CFD codeflUENT 6.0.They found that uniformity of flow distribution increased with header length and decreased with gas flow rate.The flow pattern of the header was also affected by the inlet nozzle con figuration.Bremhorstet al.[17]used a “with tubes”approximation for tubes instead of a “porous plug”approximation.They also developed new flow modeling strategies for flow simulation in the inlet header and the passes header of a side entry shell.The rapid flow expansion from one port to another often leads to vortical regions where solids can divide,coagulate and block tube entries.Badret al.[18]proved that,at low inlet velocities,the erosion rates in all tubes were negligibly small for all particle sizes.The erosion rates became appreciable when the inlet velocity reached 2.1 m·s-1.The highest erosion rates were caused by small-and medium-size particles(10 and 200 μm).When the velocity increased to 4.5 m·s-1,small particles were the main factor in tube erosion.
Although the structure of the tube entrance region was the most criticalfactorforsolid deposition in heatexchangers,there was scantliterature concerning the possibility of plugging at the inlet due to the deposition of particles.For this study,a full- flow- field,three-dimensional and transient CFD model was developed.We adopted an Eulerian–Eulerian approach to the coupling of a solid particle collision model,based on kinetic theory,to simulate the SCW and solid particle twophase flow in a shell and tube heat exchanger based on BEM type.Hydrodynamic characteristics of the exchanger,which was used for preheating the feed and cooling the products,were to be thoroughly investigated under varied header lengths,tube pass arrangements,inlet tube diameters,positions and directions.The optimal design of the exchanger was that which could alleviate the deposition and improve the uniformity.In this paper,in order to minimize deposition and plugging ofthe heatexchanger,more optimaldesigns have been established through CFD simulations.According to simulation results,we know that the optimumstructure ofa heatexchangerhas a rectangle con figuration ofthe tube pass distraction,a bottominlet,a 200-mm header heightand a 10-mm inlet pipe diameter.
2.CFD Model
2.1.Physical model
The physicalmodelin this paperis the heatexchanger,which is used to exchange material heat before and after the reaction,heat the feed and cool the discharge.It is an EDR standard-type tube-and-shell heat exchanger,and the structure needs to be exported from ASPEN.The specific characteristics of the exchanger are shown in Table 1.During flow simulation calculations,the reference condition is defined as 24 MPa,570°C.The flow type is two-phase,consisting of a flow supercritical phase and a solid phase.Because of the large difference between the longitudinal and transverse dimensions,simulating the entire exchanger requires a number of simulation grids and exceeds maximum computational loads.Therefore,the heat exchanger is simplified to intercept a part of a tube side(0.5 m)and channel in the bottom.The model diagram is shown in Fig.1.
Table 1
Characteristics of the heat exchanger

Contents Numerical value Full-length 6 m Tube side Single Shell side Single Outer diameter of internal tube side 12 mm Height of tube box 330 mm Type of placement Vertical Temperature range of heat transfer 420 °C-640 °C Pressure range of heat transfer 23 MPa-25 MPa
2.2.Governing equations
The Eulerian approach[19]was adopted to describe flow behaviors ofthe gas and solid phases,which were considered to be the continuous phase and dispersed phase,respectively.The kinetic theory-based hydrodynamics model was used for closure of the solid stress term[20,21].The interaction between the supercritical and solid phases is expressed by the Gidaspow drag model[22]with the modified Wen and Yu drag law[20,23],which is validated by Guoet al.[21]and adopted in supercritical condition.The numerical methods and simulation parameters are shown in Table 2.The IAPWS-IF97 database,which is in the CFX material library,was implemented to accurately simulate properties of SCW[24],which have been used by many for CFD modeling in supercritical condition[25,26].
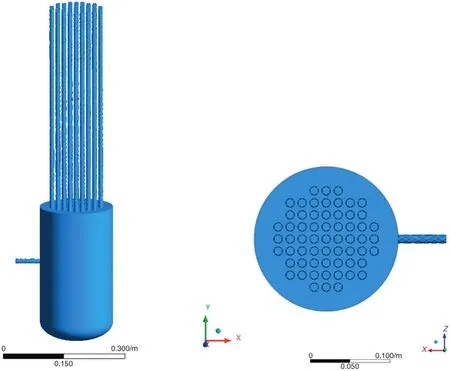
Fig.1.Physical model of the heat exchanger.
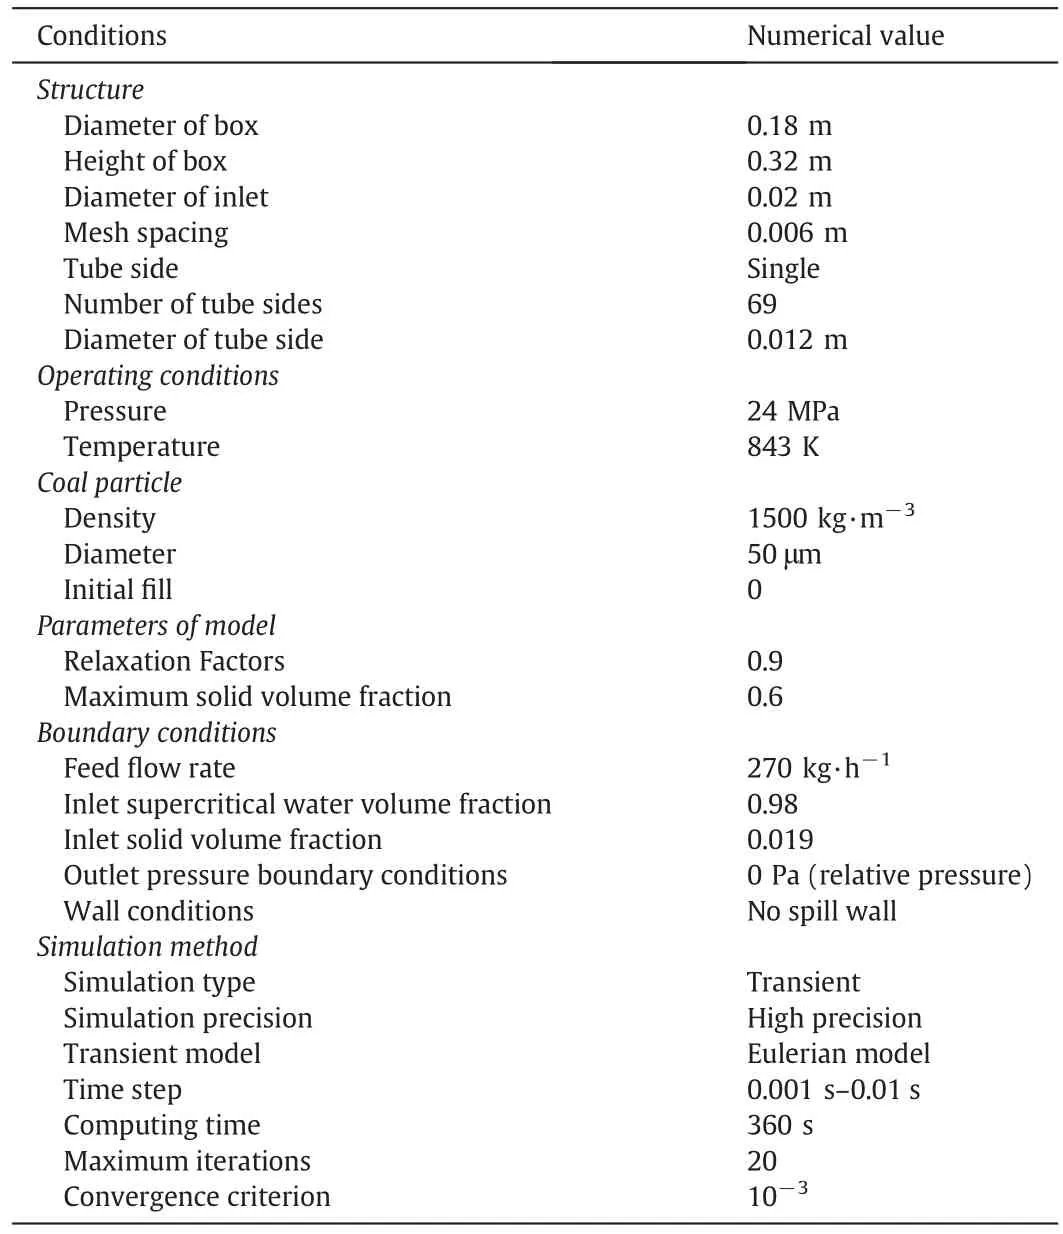
Table 2Numerical methods and simulation parameters
2.3.Inter-phase momentum transfer
Interphase turbulent dispersion force was exerted,adopting the model of Lopez de Bertodano[27].The eddy viscosity hypothesis was assumed to hold for each turbulent phase.Diffusion of momentum in each phase was governed by an effective viscosity:
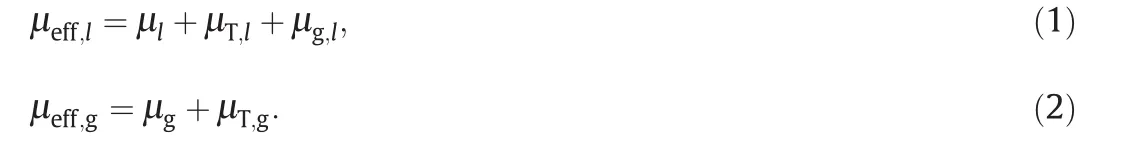
Thek-ε dispersed turbulence model was used,which was appropriate when the concentrations of the secondary phases were dilute[28].Many studies had used it in supercritical condition[29].
The turbulence viscosity of the continuous phase was obtained by thek-ε model[29]:
The standard values of constants were used:

2.4.Initial and boundary conditions
Initial conditions assumed that the SCW and solid phase were all stagnant,and the solid phase was zero in the heat exchanger.
The inlet pipe used a bulk mass flow of 270 kg·h-1as an inlet boundary condition under 570°C,24 MPa.The volume fraction of particles in the feed was 1.8%.All tube outlets used a pressure outlet boundary condition,and all other boundaries were walls,including the tube plate.
No slip wall was adopted.Zhouet al.[30]had reported that solidphase wallboundary conditions had little effecton axialvoidage pro files when the Gidaspow drag model was used.
2.5.Numerical solution
In former study,the stirred tank models(computational grids of quad or hex elements)were usually set up automatically using MixSim from Fluent LLC[9]and commercial CFD codeflUENT 4.52 was often used with the EGM model in the solution of the solid–liquid multiphaseflows by researchers.In this work,the granular viscosity model of Syamlal and O′Brien[10]was used.The computational domain of all the heaters investigated in this study was set up in Gambit 2.4.6.The base geometry,including inlet pipe,header,tube sheet and part of the tube pass,was based on a 180-mm ID heater with 69 12-mm ID,1-m height tubes on a 15-mm rectangular pitch.The header length was changed to 300,200 and 100 mm,and the inlet nozzle position was changed to the horizontalor vertical side.We implemented 853012 unstructured tetrahedral grids for the base heat exchanger,as shown in Fig.2,to obtain nearly mesh-independent results.
To numerically solve the partialdifferentialequations above,we carried out a high-resolution discretization of the equations using a finitevolume scheme with a coupled multi-grid solver,as implemented in the commercial CFD code CFX 13.0.A transient solution was used to simulate the variation along the operating time.The time step length was 0.1 s.The diameter of the header was 0.18 m.In the current condition,the estimated time to flow out the domain is 40 s.So,360 s is enough to give a good steady state.A typical solver run over 360 s of simulation time took about 4 d,15 h on a Dell workstation T7500 with 12 CPUs(Intel Xeon 2.66 GHz)inside.The solution was iterated until convergence was achieved,so that the residual for each equation fell below 10-3.The flow field reached a steady flow,as evidenced by unchanging angles of attack at the tube sheet.Steady flow was achieved after 20 s of simulation time.
2.6.Model validation
Experimental data from the literature were chosen to validate the two-phase flow field for the minimum fluidization velocity.

Fig.2.A rendering of whole exchanger geometry and exchanger mesh.
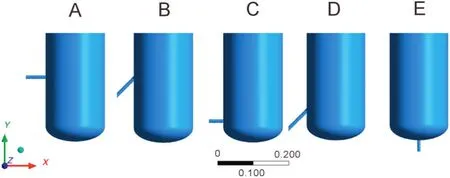
Fig.3.Geometry of different inlet pipe positions and directions based on same header.

Fig.4.Mass of small particles in exchanger.
Luet al.[6]have measured the minimum fluidization velocities of an SCW fluidized bed with a diameter of 35 mm and height of 600 mm in the pressure range of 23 to 27 MPa and at temperatures from 633 K to 693 K.In this section,simulations were conducted over the same range of temperature and pressure.Although Fig.2 showed that the minimum fluidization velocities computed by numerical simulation were slightly higher than experimentally measured values under several conditions,a close agreement within a deviation of+20%was observed.Therefore,the model was validated.
3.Results and Discussion
3.1.Effect of inlet nozzle position and direction
The con figuration of different inlet pipe positions and directions on the same header is shown in Fig.3.
Inlet position and inlet angle will affect the mass of particles accumulated in a vertical type exchanger.Fig.3 shows exchangers with five different inlet pipe con figurations,labeled A,B,C,D and E.The tube pass simulated was 50 mm,which did not show in Fig.3.The inletnozzle ofAand C is verticalto the nearheaderwall.The inletnozzle of E is vertical to the tube sheet.The inlet nozzle of B is in the same position as A,with a lean inletdirection,whereas the inletnozzle ofDis almost at the same position as C,with a lean inlet direction.
The accumulated masses of particles sized 50 μm in five exchangers for 0–360 s are shown in Fig.4.This clearly shows that the five con figurations exhibited greatly different deposition effects and different flow patterns,although only a 0.5-m tube pass had been simulated.As we can see,particle mass tended to remain steady only in Cases E and C.That means particles could be transported out of the exchanger and would not lead to block-up.Particle mass in Case E was least among thefive con figurations considered.In Cases Aand B,mass was still accumulating along with time.The largest mass accumulated was in Case D.
Differentstructures lead to different flow patterns,thus affecting the accumulated mass.Fig.5 shows the contour of the volume fraction of particles for 50-μm particles in the heat exchanger axial cross-section.Case E had fewest particles deposited at the bottom in all structures.Cases B and D,with inclined inlet nozzles,apparently concentrated more particles at the bottom compared with the same feed position in Cases A and C.In addition,Case B showed an obvious fluid drift phenomenon.
A 50-μm particle velocity vector in the axial plane is shown in Fig.6.There is a dead zone atthe bottom ofthe headerwith lean inlet(Cases B and D),making it easy to accumulate particles and jam the feed pipe,as well as increasing the operational pressure drop.At the same time,an exchanger with a lean inlet would cause maldistribution in the tube pass,which would greatly affect the heat-exchange effect.So,adopting an inclined nozzle was not an advisable option.For Cases A and C,the feed velocity vector at the tube plate had a large angle to the vertical direction ofthe tube plate,which,according to the literature[31],would lead to more serious tube plate corrosion.The velocity vector in Case E was almost perpendicular to the tube plate,leading to less corrosion and having more advantageous to transport particles.

Fig.6.Vector of small particle velocity on axial plane.

Fig.7.Rendering of three different header length geometries.
As we all know,fewerparticlesaccumulated in the headerwould reduce abrasion and corrosion,as well as the possibility of deposition and plugging.So,Case E,with an inlet at the bottom,was preferred among the five designs to avoid plugging.
3.2.Effect of header height
The structure of the exchanger header will affect particle deposition inside.To investigate the effect of header length,exchangers with three different header lengths were simulated,as shown in Fig.7.The header heightin Case E was 330 mm,thatin case F was 200 mm and thatin case G was 100 mm.A bottom inlet was adopted,and all other structures were the same in all cases.
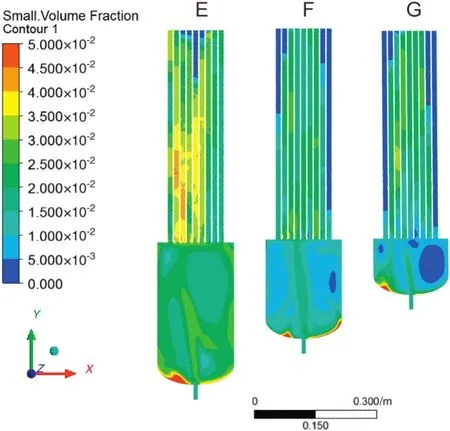
Fig.8.Contour of small particle(50 μm)volume fraction for three heat exchangers with different header lengths(HE=330 mm,HF=200 mm,HG=100 mm).
Fig.8 shows the accumulated mass contour of 50-μm particles in 360 s.The accumulated mass per unit volume decreased with the increase of header height.But at the same time,the particle distribution was more uneven in the header tube pass from case E to B,G.In several pipes, flow speed was very low.With the decrease of the header height,more particles tended to distribute in the middle of the tube pass.
Fig.9 shows the accumulated mass of 50-μm particles in heat exchangers.After timestep 2500,the mass of small particles in the Case F structure was beginning to decrease,however,the particles in Cases G and E were still accumulating.As Fig.8 shows,Cases F and G could not meet the basic requirement of conveying particles out of the tube plate uniformly after they were fully fluidized in the header.In Case G,there was a dead zone in the header,leading to particle accumulation.
Fig.10 shows the supercritical water velocity vector in the intersection plane from 0.01 m above the tube sheet.As the header height increased,the velocity in the tube-side center decreased and the velocity in the tube-side periphery increased.In Case E,the peripheral velocity of SCW was greater than the velocity in the center,and the main flow was concentrated in the periphery,while some tubes in the center had velocities close to zero.However,the central rate in Case F started to increase and the velocity gradient decreased.In Case G,with the shortest header height,the mainstream was concentrated in the center line.Peripheral velocity decreased,and the velocity of several pipes was close to zero.
Due to a greater velocity of the main flow on the cross-section and the smallest particle-accumulation trends,Case F with a 200-mm header height was the best option among Cases E,F and G.

Fig.11.Exchangers based on Case F with different inlet pipe diameters,respectively 10 mm,25 mm and 50 mm.
3.3.Effect of inlet pipe diameter
Maldistribution of flow in Case F still existed in the tube pass crosssection,and flow was concentrated in the center,hence one might consider increasing the pipe diameter to optimize flow.

Fig.12.Mass of small particles(50 μm)in exchanger.

Fig.14.Contour of solid volume fraction for different tube pass distributions.
Fig.11 shows the exchanger based on Case F with inlet pipe diameters of 10 mm,25 mm and 50 mm.
As can be seen from Fig.12,particle accumulation increased with the increase of inlet pipe diameter.It may become difficult to transport the particles out of the exchanger,leading to a deposition problem.Although it might increase distribution,increasing the inlet pipe diameter beyond 10 mm may be not advisable.Determination of the best con figuration must weigh distribution and accumulation.In this case,Case F was the best choice to minimize deposition.
3.4.Effect of tube pass distribution
Nonuniformity in fluid flow is one of the primary reasons for poor heatexchanger performance.This may be attributed to improperdesign of the inlet/outlet port and header con figuration,distributor construction and plate corrugations.
The con figurations of different inlet pipe positions and directions on the same headerare shown in Fig.13.The volume fraction ofparticles in the feed took 1.8%.
The contour of the solid volume fraction for different tube pass distributions from 0 s to 50 s is shown in Fig.14.Regarding three-tube pass distribution,it can be seen that there was little difference in the volume fraction of solid particles on the outlet,which indicated tube pass distribution in the same tube number has little influence on particle transport.Certainly,careful observation of Fig.14 indicates that rectangular distribution might have an advantage,with slightly more particle volume fraction at the outlet than other types.This means more particles were brought out of the exchanger in a rectangular distribution.So rectangle con figuration was the optimum distribution.
4.Conclusions
A series of CFD simulations in CFX were conducted with 0.5-m tubes in the pass.This heater is typical of heat exchangers used for primary slurry heating in supercritical water coal gasification.(Experimental data from the literature were chosen to validate the two-phase flow field for the minimum fluidization velocity.)
The standard side-entry heaterdesign was optimized.Averticalinlet was better than an inclined inlet,and an inlet at the bottom ofthe header is suggested to avoid plugging.Increasing the header height would lead to more feed flow in the center of the tube plate,and one with a uniform distribution of flow was preferable.Particle accumulation increased with the increase of the inlet pipe diameter.A rectangular tube pass distribution mighthave advantages over circularand triangular types.We discussed seven exchanger structures(A,B,C,D,E,F and G),with different inlet nozzle con figurations,header heights,inlet pipe diameters and tube pass distributions.Simulation results indicate that the optimum heatexchanger has structure F,i.e.,a rectangular configuration of the tube pass distraction,a bottom inlet,a 200-mm header height and a 10-mm inlet pipe diameter.
Nomenclature
CBconstant,dimensionless
CDdrag coefficient,dimensionless
CLlift coefficient,dimensionless
Cε1constant,dimensionless
Cε2constant,dimensionless
Cμconstant,dimensionless
Cμpconstant,dimensionless
dsparticle diameter,m
essrestitution coefficient

Fig.13.Different tube pass con figurations(triple,circular and rectangular).
ggravitational acceleration,m·s-2
g0,ssradial distribution coefficient
Istress tensor
Kfsgas/solid momentum exchange coefficient
kturbulence kinetic energy,m2·s-2
kΘ,sdiffusion coefficient for granular energy,kg·s-1·m-1
MDdrag force,N·m-3
MIinter-phase momentum transfer force,N·m-3
MLlift force,N·m-3
mmass,kg
nnumber density,m-3
Pkturbulence production,kg·m-1·s-3
ppressure,Pa
Qgvolumetric inlet gas flow rate,L·min-1
ResReynolds number,dimensionless
rijequivalent radius,m
Ssource term,kg·m-3·s-1
Sijcross-sectional area of the collision,m2
ttime,s
uivelocity vector,m·s-1
utturbulent velocity,m·s-1
Xmass fraction,dimensionlesss
α volume,dimensionless
β constant,dimensionless
γΘ,scollision dissipation of energy,kg·s-3·m-1
ε turbulence eddy dissipation,m2·s-3
Θsgranular temperature,m2·s-2
λ bulk viscosity,kg·s-1·m-1
μ shear viscosity,kg·s-1·m-1
μeff effective viscosity,Pa·s
μg,lgas particle induced viscosity of liquid phase,Pa·s
μTturbulence induced viscosity,Pa·s
ξ dimensionless size ofeddies in the inertialsubrange ofisotropic turbulence
ρ density,kg·m-3
σ surface tension between liquid phase and gas phase,N·m-1
σkconstant,dimensionless
σεconstant,dimensionless
τ actual time during the collision,s
υ kinematic viscosity,m2·s-1
Subscripts
exp experimental values
f fluid
i general index
mf minimum fluidization
s solid phase
sim simulated vales
Acknowledgments
The authors thank LetPub(www.letpub.com)for its linguistic assistance during the preparation of this manuscript.
[1]M.J.Veraa,A.T.Bell,Effect of alkalimetalcatalysts on gasification ofcoal char,Fuel57(1978)194–200.
[2]S.Nosé,A molecular dynamics method for simulations in the canonical ensemble,Mol.Phys.52(1984)255–268.
[3]W.G.Hoover,Canonical dynamics:Equilibrium phase-space distributions,Phys.Rev.A31(1985)1695–1697.
[4]T.Takarada,Y.Tamai,A.Tomita,Reactivities of 34 coals under steam gasification,Fuel64(1985)1438–1442.
[5]Z.L.Liu,H.H.Zhu,Steam gasification of coal char using alkali and alkaline-earth metal catalysts,Fuel65(1986)1334–1338.
[6]T.Takarada,Y.Tamai,A.Tomita,Effectiveness of K2CO3and Ni as catalysts in steam gasification,Fuel65(1986)679–683.
[7]L.Q.Wang,Y.H.Dun,X.N.Xiang,Z.J.Jiao,T.Q.Zhang,Thermodynamics research on hydrogen production from biomass and coal co-gasification with catalyst,Int.J.Hydrog.Energy36(2011)11676–11683.
[8]A.A.Vostrikov,S.A.Psarov,D.Y.Dubov,O.N.Fedyaeva,M.Y.Sokol,Kinetics of coal conversion in supercritical water,Energy Fuel21(2007)2840–2845.
[9]L.Han,R.Zhang,J.Bi,L.Cheng,Pyrolysis ofcoal-tar asphaltene in supercriticalwater,J.Anal.Appl.Pyrolysis91(2011)281–287.
[10]S.Wang,Y.Guo,L.Wang,Y.Wang,D.Xu,H.Ma,Supercritical water oxidation of coal:Investigation of operating parameters'effects,reaction kinetics and mechanism,Fuel Process.Technol.92(2011)291–297.
[11]L.Guo,H.Jin,Boiling coal in water:Hydrogen production and power generation system with zero net CO2emission based on coal and supercritical water gasification,Int.J.Hydrog.Energy38(2013)12953–12967.
[12]J.Zhang,X.Weng,Y.Han,W.Li,Z.Gan,J.Gu,Effect of supercritical water on the stability and activity of alkaline carbonate catalysts in coal gasification,J.Energy Chem.22(2013)459–467.
[13]P.A.Marrone,G.T.Hong,Corrosion control methods in supercritical water oxidation and gasification processes,J.Supercrit.Fluids51(2009)83–103.
[14]M.M.Aslam Bhutta,N.Hayat,M.H.Bashir,A.R.Khan,K.N.Ahmad,S.Khan,CFD applications in various heat exchangers design:A review,Appl.Therm.Eng.32(2012)1–12.
[15]M.Brennan,K.Bremhorst,CFD modeling of alumina slurry heat exchanger headers:(ii)Parametric studies,Seventh International Conference on CFD in the Minerals and Process IndustriesCSIRO 2009,pp.1–6.
[16]M.Kim,Y.Lee,B.Kim,D.Lee,W.Song,CFD modeling of shell-and-tube heat exchanger header for uniform distribution among tubes,Korean J.Chem.Eng.26(2009)359–363.
[17]K.Bremhorst,M.Brennan,CFD modelling of alumina slurry heat exchanger headers:(i)Comparison of CFD approaches,Seventh Int.Conf.on CFD in the Minerals and Process IndustriesCSIRO,Melbourne,Australia 2009,pp.9–11.
[18]H.M.Badr,M.A.Habib,R.Ben-Mansour,S.A.M.Said,S.S.Al-Anizi,Erosion in the tube entrance region of an air-cooled heat exchanger,Int.J.Impact Eng.32(2006)1440–1463.
[19]J.Ding,D.Gidaspow,A bubbling fluidization model using kinetic theory of granular flow,AIChE J36(1990)523–538.
[20]V.Jiradilok,D.Gidaspow,S.Damronglerd,W.J.Koves,R.Mosto fi,Kinetic theory based CFD simulation of turbulent fluidization of FCC particles in a riser,Chem.Eng.Sci.61(2006)5544–5559.
[21]Y.Lu,L.Guo,C.Ji,X.Zhang,X.Hao,Q.Yan,Hydrogen production by biomass gasification in supercritical water:A parametric study,Int.J.Hydrog.Energy31(2006)822–831.
[22]D.Gidaspow,Multiphaseflow and Fluidization:Continuum and Kinetic Theory Descriptions,Academic Press,San Diego,CA,(1994)467.
[23]N.Yang,W.Wang,W.Ge,L.Wang,J.Li,Simulation of heterogeneous structure in a circulating fluidized-bed riser by combining the two- fluid model with the EMMS approach,Ind.Eng.Chem.Res.43(2004)5548–5561.
[24]W.Wagner,A.Kruse,H.-J.Kurtzschmar,Properties of Water and Steam:The Industrial Standard IAPWS-IF97 for the Thermodynamic Properties and Supplementary Equations for Other Properties:Tables Based on These Equations,Springer-Verlag,Berlin,1998.
[25]J.Serin,J.Mercadier,F.Marias,P.Cezac,F.Cansell,Use of CFD for the design of injectors for supercritical water oxidation,Proceedings of the 10th European Meeting on Supercritical Fluids:Reactions,Materials and Natural Products Processing,Colmar,France,2005.
[26]T.Yoshida,Y.Matsumura,Reactor development for supercritical water gasification of 4.9 wt%glucose solution at 673 K by using computational fluid dynamics,Ind.Eng.Chem.Res.48(2009)8381–8386.
[27]M.L.de Bertodano,Turbulent Bubbly Flow in a Triangular Duct,Ph.D.Thesis,Rensselaer Polytechnic Institute,Troy New York,1991.
[28]C.Chen,P.Wood,A turbulence closure model for dilute gas-particle flows,Can.J.Chem.Eng.63(1985)349–360.
[29]C.Narayanan,C.Frouzakis,K.Boulouchos,K.Príkopský,B.Wellig,P.Rudolf von Rohr,Numerical modelling of a supercritical water oxidation reactor containing a hydrothermal flame,J.Supercrit.Fluids46(2008)149–155.
[30]X.Zhou,J.Gao,C.Xu,X.Lan,Effect of wall boundary condition on CFD simulation of CFB risers,Particuology11(2013)556–565.
[31]D.Elvery,K.Bremhorst,Erosion-corrosion due to inclined flow into heat exchanger tubes–investigation of flow field,Proceedings of the ASMefluids Engineering Division Summer Meeting,San Diego,California,USA July,1996,pp.7–11.
 Chinese Journal of Chemical Engineering2017年8期
- Chinese Journal of Chemical Engineering的其它文章
- Coupled simulation of recirculation zonal firebox model and detailed kinetic reactor model in an industrial ethylene cracking furnace☆
- Integration strategies of hydrogen network in a refinery based on operational optimization of hydrotreating units☆
- Application of the dividing wall column to olefin separation influidization methanol to propylene(FMTP)process☆
- Optimization and control of a reactive distillation process for the synthesis of dimethyl carbonate☆
- A systematic strategy for multi-period heat exchanger network retro fit under multiple practical restrictions☆
- Performance of CO2 absorption in a diameter-varying spray tower☆