
含不同杂原子共轭单元的有机光敏染料的超快发光动力学
2018-05-04 01:42刘娇霍继存张敏董献堆
物理化学学报 2018年4期
刘娇 ,霍继存 ,张敏 ,董献堆
1 中国科学院长春应用化学研究所,长春 130022
2 天津理工大学新能源材料与低碳技术研究院,天津 300384
3 中国科学院大学,北京 100049
1 Introduction
Dye-sensitized solar cells (DSCs)1have gained much attention because they are flexible to modify to improve power conversion efficiency (PCE) at low cost. In a typical DSC, the selection of a sensitizer plays a crucial role in the PCE by determining the capacity of sunlight harvesting and controlling the charge transfer dynamics in the interface of titania/dye/ electrolyte. In this context, taking into account the abundance of raw materials, flexibility of molecular tailoring and bright color, enormous efforts have been devoted to the development of metal-free organic dyes2-19. Furthermore, both experimentally and theoretically studies have shown that the kernel influence of electronic and optical properties of dyes on the performance of DSCs devices, which holds the promise of dye design through tuning the electronic and optical structures and properties, among which the electron injection from the excited state of the dye to the conduction band of nanocrystals on the picosecond/femtosecond timescales is regarded as the dominating process in DSCs devices20-25. Consequently, the research on the excited-state dynamics is of importance for the characterization of metal-free organic dyes, and the femtosecond time-resolved fluorescence spectroscopy techniques have already been utilized and developed to make up the shortfall of the conventional electronic detection techniques such as streak camera detection due to their slow electronic switches26-32. The dynamics curves can be monitored accurately with no interference from the exciting pulse attributed to the short enough exciting pulse duration. Moreover, the femtosecond fluorescence up-conversion measurement is more powerful because of the direct access to the exciton relaxation and higher sensitivity with respect to the nonlinear time-resolved absorption techniques33-36.
In our previous paper, we synthesized a typical metal-free organic dye C210 (Fig.1) featuring a conjugated segment between the electron-releasing group TPA and the electron-withdrawing acceptor CA with π-conjugated linker bifuran, and further switched the conjugated linker from bifuran to bithiophene and biselenophene to construct dye C214 and C216 (Fig.1)37, respectively. However, the excited-state dynamics and ultrafast charge transfer processes for these dyes applied in DSCs remain unclear due to a lack of detailed investigation. Hence, through a joint femtosecond fluorescence up-conversion and time-correlated single-photon counting (TCSPC) measurements, we will take a close look at the impacts of conjugated linkers with different heteroatoms upon the excited state dynamics of aforementioned dyes. A nanosecond laser flash photolysis spectrometer measurement will be resorted to inspect the carrier dynamics occurring at the photochemical interface. Furthermore, with a bilayer titania film and an ionic liquids electrolyte, the photovoltaic performance of DSCs will be studied by measuring external quantum efficiency (EQE) and current-voltage (J-V) curves, and the electrical analyses based on charge extraction (CE) and transient photovoltage decay (TPD) measurements.
2 Experimental section
2.1 Materials
Tetrahydrofuran (THF, 99.9%), toluene (PhMe, 99.9%), chloroform(99.9%), ethanol (99.9%), PMMA, PS,lithium bis(trifluoromentylsulfonyl)imide (LiTFSI, 99.9%), 1-ethyl-3- methylimidazoliumbis(trifluoromethanesulfonyl)imide (EMITFSI, 99.9%), and 4-tert-butylpyridine (TBP, 99.9%), 1,3-Dimethylimidazolium iodide (DMII, 99.9%), sulfolane (99.9%), iodine (99.9%), N-butylbenzimidazole (NBB, 99.9%), and guanidinium thiocyanate (GNCS, 99.9%) were purchased from Sigma-Aldrich. The transparent alumina/titania pastes38, dye molecules (C210, C214 and C216)37were prepared according to the preceding literature procedures. The scattering titania paste was purchased from Dyesol.
2.2 Cell fabrication and measurement
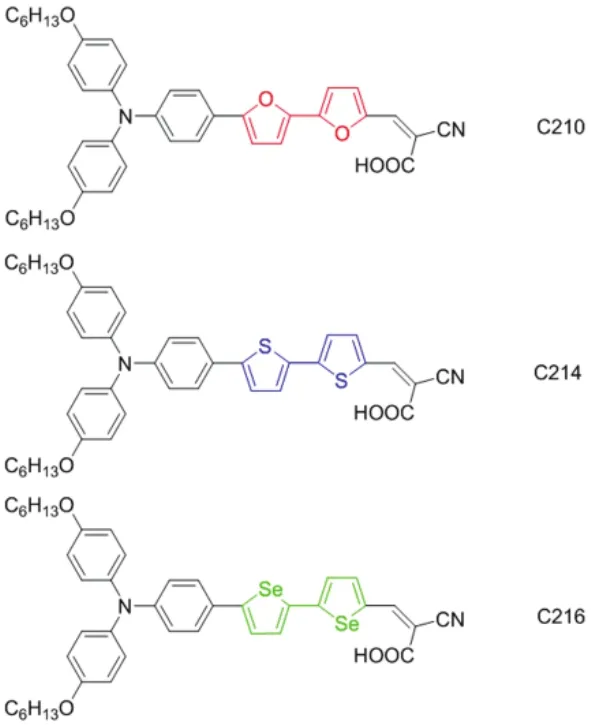
Fig.1 Chemical structures of D-A dyes C210, C214, and C216, characteristic of bifuran (red), bithiophene (blue), and biselenophene (green) as the conjugated linkers, respectively, combined with the dihexyloxy-substituted triphenylamine donor and the cyanoacrylic acid acceptor. Color online.
We fabricated the DSCs by using fluorine doped tin oxide (FTO) conducting glass (NSG, Solar) partly screen-printed with a bilayer titania film as the negative electrode. The bilayer semiconducting film contains translucent layer (4.6-μm-thick) composed of small particles (25 nm) and light-scattering layer (5.0-μm-thick) with large particles (350-450 nm). More preparation details can be found from a previous paper38. The solutions of 150 μmol·L-1dye in the solvent mixture of chloroform/ethanol (with volume ratio of 1/9) for C210, C214, and C216 were prepared respectively. Then a titania film was immersed into the solution overnight for dye-loading. A 25-μm-thick Surlyn ring was heated at 130 °C to adhere a dye grafted titania electrode with a Pt coated FTO electrode. The infiltrated ionic liquid composite electrolyte with iodide/triiodide as the redox couple contains DMII, EMIII, sulfolane, iodine, NBB, and GNCS at a molar ratio of 12 : 12 : 16 : 1.67 : 3.33 : 0.67. One could find more details on EQE, J-V, CE, and TPD measurements in our previous papers39,40. A black metal mask with an aperture area of 0.160 cm2was covered on a testing cell during EQE and J-V measurements.
2.2 Photophysical measurements
A G1103A spectrometer (Agilent) was used for UV-Vis spectra measurements, and the steady-state photoluminescence (PL) spectroscopy measurements were carried out by using a SpectraSuite Spectrometer (Ocean Optics). TCSPC experiments were carried out by a LifeSpec-II spectrometer with an EPL485 pulsed laser diode and a Hamamatsu H5773-04 photomultiplier. More details about the femtosecond fluorescence up-conversion measurements were presented in our previous paper41. In brief, the output of 130 fs pulses at 800 nm from a regenerative amplifier (Spitfire, Spectra Physics) was split into two parts by using a 9/1 beam splitting prism. The large portion was directed to an optical parametric amplifier (TOPAS-C, Light Conversion) to give birth to pump pulse at 490 nm. The minor portion was directed to a 0.3-mm-thick BBO crystal to overlap with the photons emitted from a rotating sample and yield a sum frequency light. We carried out the Global analysis for PL traces by using the free Glotaran software42. Four time constants were enough to get a satisfactory global fitting. Then each kinetic trace was fitted to get the corresponding amplitudes using the four time constants by the Surface Xplorer software (version 2.3).
3 Results and discussion
In order to provide a fundamental understanding of the mechanism of excited-state evolution at the molecular level, the static and dynamic optical properties for chromophores in solutions is of essential. We firstly measured steady absorption and PL spectra of diluted solutions of dye molecules in THF solvent (Fig.2a). The maximum absorption peak shifts from 484 to 489 and 520 nm along with the alteration of the π-conjugation from bifuran (C210) to bithiophene (C214) and biselenophene (C216). Then comparing the maximum absorption peaks of the three dyes with the maximum PL wavelengths of 610, 625, and 675 nm for C210, C214 and C216, respectively, the large values of Stokes shift can be decuced, being 0.53 eV for C210, 0.55 eV for C214, and 0.55 eV for C216, respectively. The large energy losses following vertical excitation have somehow implied the existence of excited state relaxations to a large extent such as relaxations of vibration, solvent and torsion43-47.
With the help of the femtosecond fluorescence up-conversion and time-correlated single-photon counting techniques, we further recorded time-resolved PL traces of above molecules in THF (Figs.S1-S3, in the Supporting Information). It is noted that all the molecules featrue wavelength-dependent PL kinetics. We selected three typical time-resolved PL traces for C214 in THF (610, 710 and 890 nm) from different wavelengh regions as presented in Fig.2b. Obviously, the three selected PL traces are very distinguishing, the rise and decay process both become slower with the wavelengh red-shifting. The PL traces at various wavelengths for each molecule can be nicely fitted by four-exponential function convoluted with Gaussian instrument response function IRF via the following function
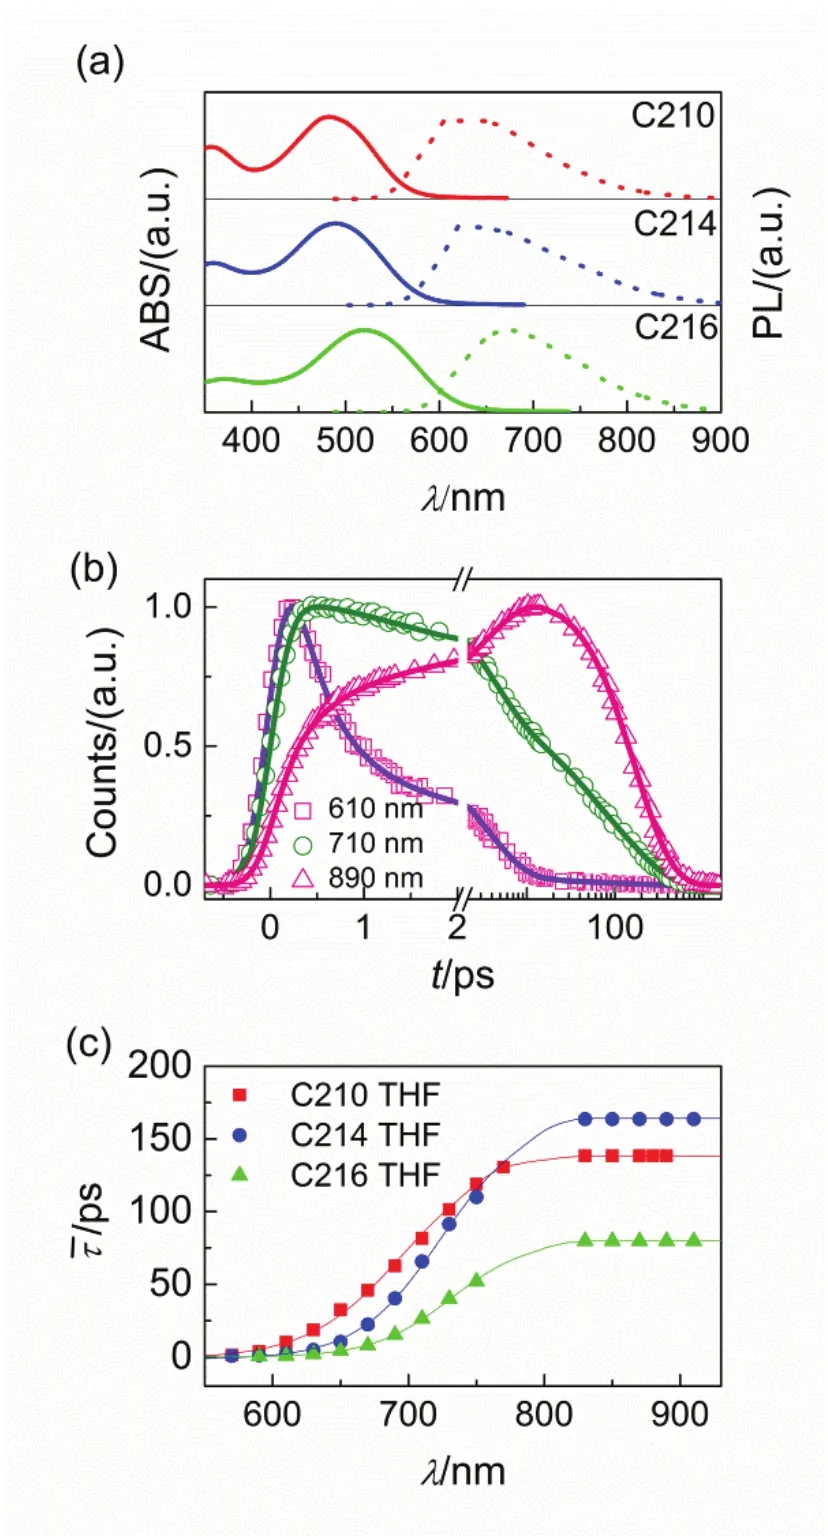
Fig.2 Photophysical properties of chromophores dissolved in THF (150 μmol·L-1). (a) Steady-state UV-Vis absorption (solid lines) and PL (short dash lines) spectroscopies of C210 (red), C214 (blue), and C216 (green). (b) Normalized ultrafast kinetic traces (scatter dots) at three selected PL wavelengths of C214 in THF. The solid fitting lines are obtained via equation 1. (c) Scatter plots of average time constants as a function of PL wavelengths for these molecules in THF. The solid lines are displayed to guide the eyes.
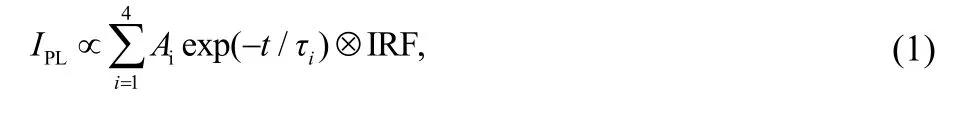
where in t, Ai, and τi represent the delay time, fractional amplitude, and lifetime. The derived values of Aiwere collected i n T able S 1-S3 ( Supporting I nformation). Furthermore, the values of average lifetimes (τ ) were determined by
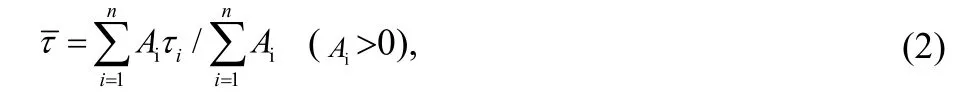
which also were compiled in Table S1-S3 (Supporting Information). The wavelength dependent values of τ are displayed in Fig.2c, which present a gradual increase along with the red-shifting of photoluminescence wavelengths. We could see that an equilibrium excited state is achieved as wavelength gradually red shifting, because the molecules via intramolecular charge transfer to a non-equilibrium vertically excited state, such as the Franck-Condon excited state, which undergoes stepwise vibrational and torsional relaxations after the light excitation43-47. It is strongly supported by the slow arising signals (Figs.S1-S3, in the Supporting Information) and negative amplitudes of the short time constants in Table S1-S3 (Supporting Information) at the long PL wavelengths. Thevalues at long wavelengths were invariable which is considered as the deactivation time constants of the first equilibrium excited singlet stateThe lifetime value offor C210 is 138.4 ps, which enhances to 163.6 ps for C214 and reduces to 79.7 ps for C216, respectively. Considering the integral of dynamic PL trace is proportional to the counts of emitting photons at the corresponding wavelength in the steady PL spectroscopy, we reconstructed contour plots of time-resolved PL (TRPL) spectroscopies as shown Fig.3(a-c). In addition, the evolution associated PL (EAPL) spectroscopies can be derived by using the Glotaran software as presented in Fig.3(d-i). Obviously, all the molecules present dynamic Stokes shifts, which indicate the occurrence of the stepwise intramolecular relaxations of non-equilibrium excited state.
The photochemical properties of dyes could significantly influenced by the solute-solvent interactions dependence on solvent polarity due to the effect of the dipole moments of the solute in the corresponding ground and excited states48-50. Consequently, in order to investigate the static and dynamic optical properties of dyes in different solvents with various polarity, we measured the static absorption and PL spectroscopies of C210, C214 and C216 in PhMe solvent as shown in Fig.4a, which present a same trend compared to that in THF solvent. The maximum absorption wavelengths are 472 nm for C210, 480 nm for C214, and 502 nm for C216. The maximum PL wavelengths are 607 , 619, and 650 nm for C210, C214 and C216, respectively. By comparing the absorption and fluorescence spectra peaks for the three molecules in THF (Fig.2a) and PhMe (Fig.4a), blue shifting of the maximum wavelengths were clearly observed. It is easily seen that all maxima are blue-shifted with the decrease of solvent polarity which could be attributed to the stabilization of the charge-transfer state in polar solvent.
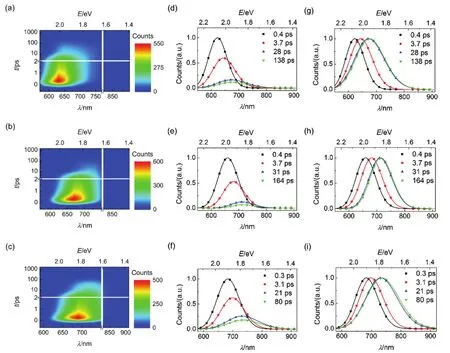
Fig.3 (a-c) Contour plots of time-resolved PL (TRPL) spectroscopies, (d-f) evolution associated PL (EAPL) spectroscopies,and (g-i) normalized EAPL of (a, d, and g) C210, (b, e, and h) C214, and (c, f, and i) C216 in THF. The time constants of spectroscopic evolution derived from global fitting are included, and the solid lines are obtained via log-normal function.
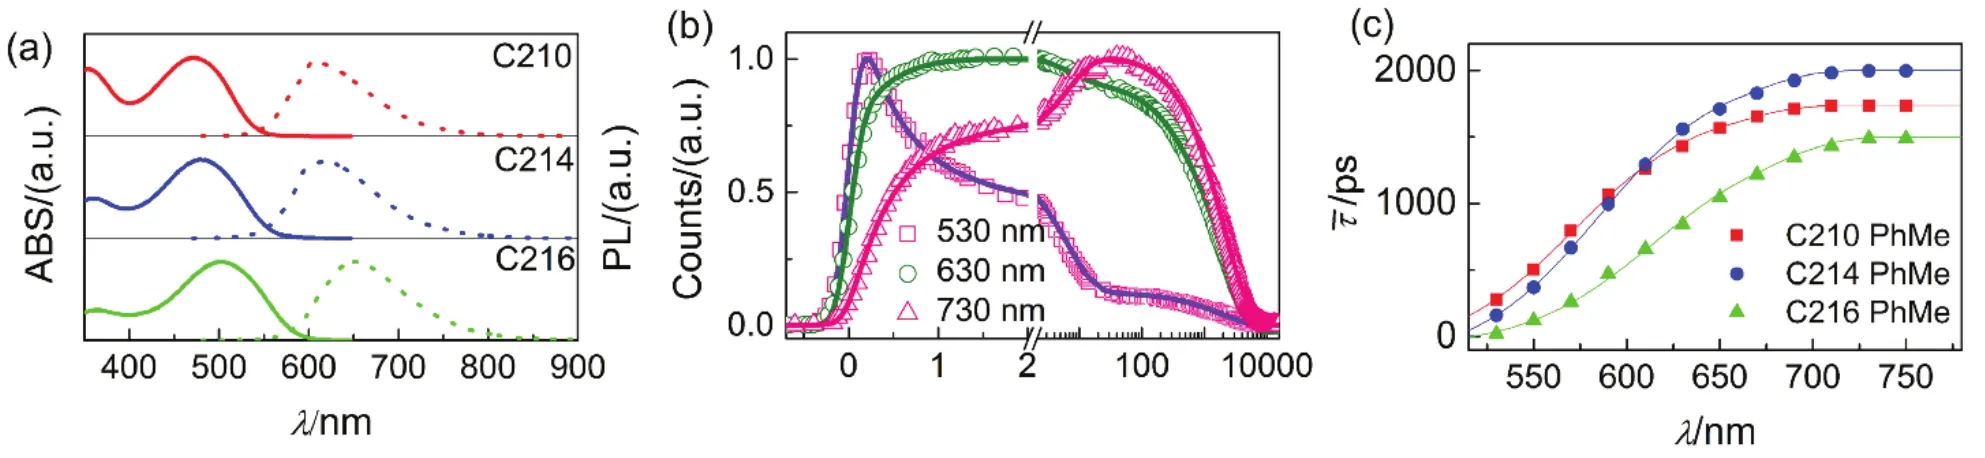
Fig.4 Photophysical properties of chromophores dissolved in PhMe (150 μmol·L-1). (a) Steady-state UV-Vis absorption (solid lines) and PL (short dash lines) spectroscopies of C210 (red), C214 (blue), and C216 (green). (b) Normalized ultrafast kinetic traces (scatter dots) at three selected PL wavelengths of C214 in PhMe. The solid fitting lines are obtained via equation 1. (c) Scatter plots of average time constants ( ) as a function of PL wavelengths for these molecules in PhMe. The solid lines are displayed to guide the eyes.
The time-resolved PL traces of above molecules in PhMe solvents (Figs.S4-S6, in the Supporting Information) were studied by the abovementioned method. Moreover, three distinguishing time-resolved PL traces for C214 in PhMe solvents in different wavelengh regions (530, 630, and 730 nm) were picked up in Fig.4b. Similarly, the PL traces at various wavelengths for the three molecules could be nicely fitted by four time constants listed in Table S4-S6 (Supporting Information), and the lifetime values of τ were also compiled in Table S4-S6 (Supporting Information) and depicted in Fig.4c. With the PL wavelengths red shifting, the average lifetime increases gradually until an invariable value which is considered as the deactivation time constants of the first equilibrium excited singlet state. The lifetime value offor C210 is 1733 ps, which enhances to 1997 ps for C214 and reduces to 1489 ps for C216 in PhMe solvents, presenting the same variation tendency as that in THF solvents. Furthermore, the TRPL (Fig.5(a-c)) and EAPL (Fig.5(d-i)) spectroscopies for dyes in PhMe solvents were further reconstructed by the aforementioned procedure. It is easy to speculate the existence of stepwise intramolecular relaxations for non-equilibrium excited state with PhMe as solvent, owing to the occurrence of dynamic Stokes shifts.
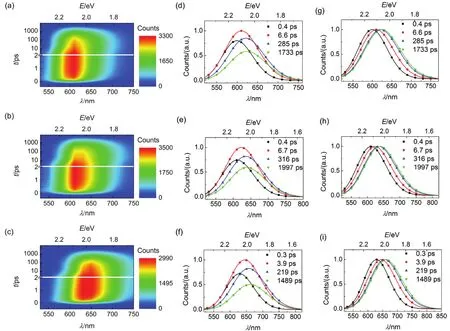
Fig.5 (a-c) Contour plots of time-resolved PL (TRPL) spectroscopies, (d-f) evolution associated PL (EAPL) spectroscopies,and (g-i) normalized EAPL of (a, d, and g) C210, (b, e, and h) C214, and (c, f, and i) C216 in PhMe. The time constants of spectroscopic evolution derived from global fitting are included, and the solid lines are obtained via log-normal function.
To get more informations about excited-state for the three dyes, we measured the static and dynamic spectroscopies for dyes dispersed in polymers film including PMMA and PS by using the same research methods as described above. The static absorption and static PL spectroscopies of C210, C214 and C216 dispersed in PMMA and PS films were shown in Figs.6a and 7a, and the shapes of the absorption and PL spectroscopies are similar to what is observed for the molecules in THF or PhMe solvent. Moreover, the switch of solid dispersion from PMMA to PS do not distinctly affect the the maximum absorption and PL wavelengths of dyes. The absorption peaks are 497 nm for C210, 506 nm for C214, and 523 nm for C216, along with the maximum PL wavelengths of 612, 667, and 685 nm for C210, C214 and C216 dyes dispersed in PMMA film, respectively. Similarly, the absorption maxima are 494 nm for C210, 502 nm for C214, and 518 nm for C216, along with the maximum PL wavelengths of 610, 658, and 683 nm for C210, C214 and C216 dyes dispersed in PS film, respectively.
Then we measured the time-resolved PL traces for dyes dispersed in PMMA and PS films respectively, three distinguishing time-resolved PL traces for C214 (630 nm, 730, and 910 nm) in different wavelengh regions were picked up as presented in Figs.6b and 7b. There is a rapid rising process for time-resolved PL trace in the short wavelength region while slow arising signals in the long wavelengths. The PL traces at various wavelengths for the three molecules could be fitted by four time constants nicely as listed in Table S7-S12 (Supporting Information), and the values of τ were also compiled in Table S7-S12 (Supporting Information) and presented in Figs.6c and 7c. Moreover, the lifetime values ofare 601, 857, and 559 ps for C210, C214 and C216 dispersed in PMMA film, respectively. Meanwhile, the lifetime values ofare 828, 914, and 626 ps for C210, C214 and C216 dispersed in PS flim, respectively. The lifetime values offor dyes dispersed in PMMA and PS films remain the same variation tendency as presented in THF and PhMe solvents in the order of C216 < C210 < C214. The difference is that the lifetime values offor dyes dispersed in PMMA and PS films are generally lower than that of in PhMe solvent and higher than that of in THF solvent. Furthermore, the TRPL and EAPL spectroscopies for dyes dispersed in PMMA and PS films were reconstructed and presented in panels of Figs.8 and 9, which also indicate the occurrence of the stepwise intramolecular relaxations of non-equilibrium excited state of dye molecule insolid dispersion.

Fig.6 Photophysical properties of chromophores dispersed in PMMA. (a) Steady-state UV-Vis absorption (solid lines) and PL (short dash lines) spectroscopies of C210 (red), C214 (blue), and C216 (green). (b) Normalized ultrafast kinetic traces (scatter dots) at three selected PL wavelengths of C214 dispersed in PMMA. The solid fitting lines are obtained via equation 1. (c) Scatter plots of average time constants ( ) as a function of PL wavelengths for these molecules dispersed in PMMA. The solid lines are displayed to guide the eyes.
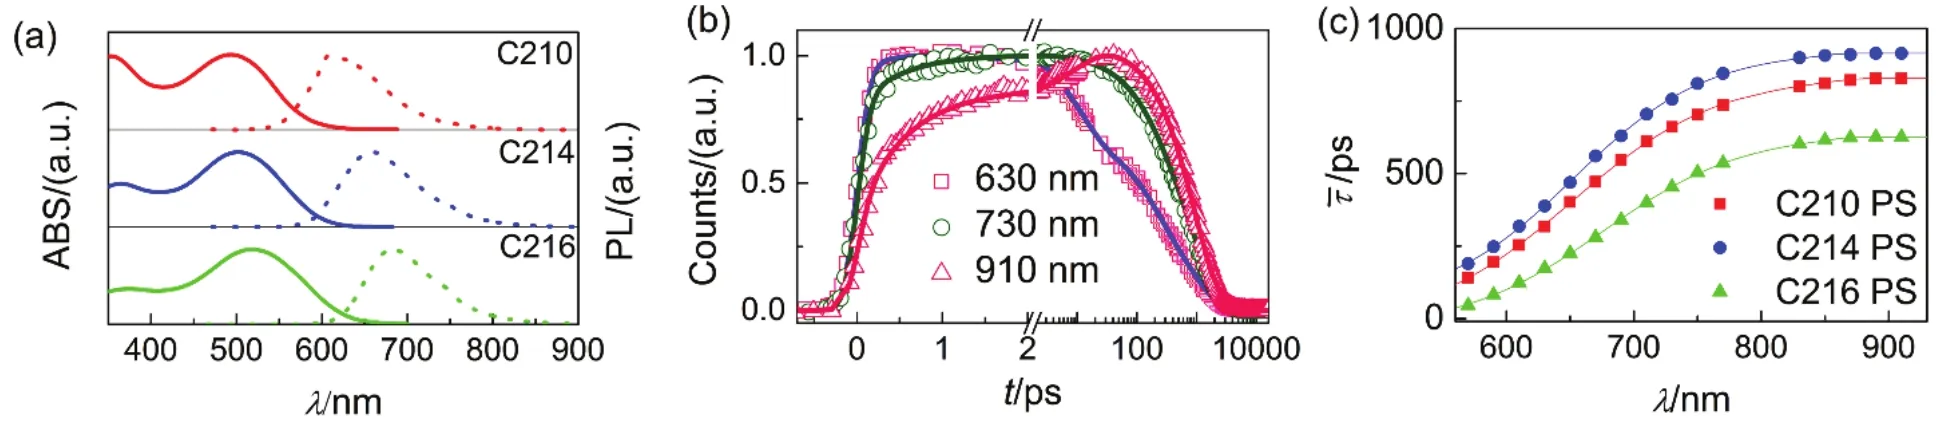
Fig.7 Photophysical properties of chromophores dispersed in PS. (a) Steady-state UV-Vis absorption (solid lines) and PL (short dash lines) spectroscopies of C210 (red), C214 (blue), and C216 (green). (b) Normalized ultrafast kinetic traces (scatter dots) at three selected PL wavelengths of C214 dispersed in PS. The solid fitting lines are obtained via equation 1. (c) Scatter plots of average time constants ( ) as a function of PL wavelengths for these molecules dispersed in PS. The solid lines are displayed to guide the eyes.

Fig.8 (a-c) Contour plots of time-resolved PL (TRPL) spectroscopies, (d-f) evolution associated PL (EAPL) spectroscopies,and (g-i) normalized EAPL of (a, d, and g) C210, (b, e, and h) C214, and (c, f, and i) C216 grafted on PMMA. The time constants of spectroscopic evolution derived from global fitting are included, and the solid lines are obtained via log-normal function.
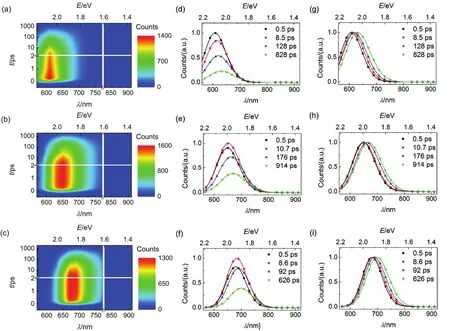
Fig.9 (a-c) Contour plots of time-resolved PL (TRPL) spectroscopies, (d-f) evolution associated PL (EAPL) spectroscopies,and (g-i) normalized EAPL of (a, d, and g) C210, (b, e, and h) C214, and (c, f, and i) C216 grafted on PS. The time constants of spectroscopic evolution derived from global fitting are included, and the solid lines are obtained via log-normal function.
To gain more insights, dyes self-organized on the surface of nanocrystals including alumina and titania with a realistic ionic liquid composite electrolyte were further studied for the static and dynamic spectroscopies as presented in Figs. 10a and 11a. The maximum absorption wavelengths are 487 nm for C210, 490 nm for C214, and 502 nm for C216, along with the maximum PL wavelengths of 695, 720, and 747 nm for C210, C214 and C216 dyes grafted on alumina, respectively. Likewise, the absorption maxima are 501 nm for C210, 505 nm for C214, and 506 nm for C216, along with the maximum PL wavelengths of 719, 739, and 768 nm for C210, C214 and C216 dyes grafted on titania, respectively. Obviously, there are larger Stokes shifts for dye-grafted alumina (C210: 0.76 eV; C214: 0.81 eV; C216: 0.81 eV) and titinia (C210: 0.75 eV; C214: 0.78 eV; C216: 0.84 eV) compared to dye dispersed in solution or solid polymer film, which may be ascribed to the intermolecular energy transfer induced by the melecule aggregation on the surface of oxide film.
Further the time-resolved traces for dyes grafted on nanocrystals at a successive of PL wavelengths were given in Figs.S13-S18 (Supporting Information), the corresponding parameters were collected in Table S13-S18 (Supporting Information). Three typical time-resolved PL traces for C214 grafted on the surface of alumina/titania nanocrystals (630, 730, and 910 nm) from blue to red wavelength regions were chosen for better comparison as shown in Figs.10b and 11b. The variation tendency of wavelength-dependent average lifetime is in agreement with that in THF/PhMe solutions and dispersed in PMMA/PS films, increasing to 1-2 orders of magnitude with the red shift of the PL wavelength as shown in Figs.10c and 11c. The derived TRPL and EAPL spectroscopies for dyes grafted on the surface of alumina/titania nanocrystals were given (Figs.12 and 13) based on the corresponding stationary PL spectra (Figs.10a and 11a) by the aforementioned protocols. Dynamic Stokes shifts can also be clearly observed for dye grafted oxide films.
We further calculated PL quenching yields (QYD) through dynamic method. Assuming that electrons cannot be injected to alumina from dyes in the electronically excited-states (D*). The dynamic PL quenching yields (QYD) at discrete wavelengths were derived via equation
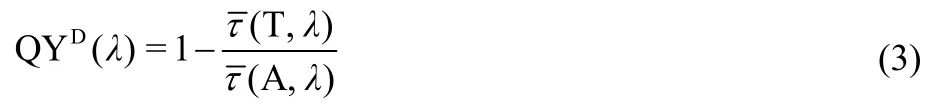
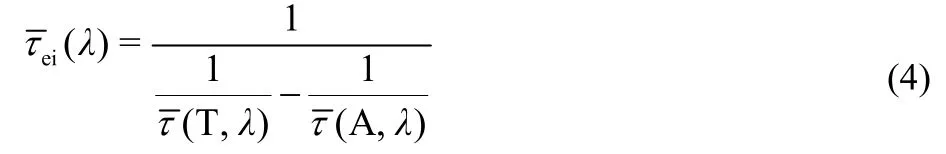
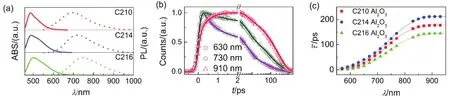
Fig.10 Photophysical properties of chromophores grafted on alumina. (a) Steady-state UV-Vis absorption (solid lines) and PL (short dash lines) spectroscopies of C210 (red), C214 (blue), and C216 (green). (b) Normalized ultrafast kinetic traces (scatter dots) at three selected PL wavelengths of C214 grafted on alumina. The solid fitting lines are obtained via equation 1. (c) Scatter plots of average time constants (τ ) as a function of PL wavelengths for these molecules grafted on alumina. The solid lines are displayed to guide the eyes.
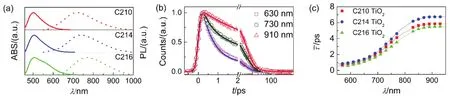
Fig.11 Photophysical properties of chromophores grafted on titania. (a) Steady-state UV-Vis absorption (solid lines) and PL (short dash lines) spectroscopies of C210 (red), C214 (blue), and C216 (green). (b) Normalized ultrafast kinetic traces (scatter dots) at three selected PL wavelengths of C214 grafted on titania. The solid fitting lines are obtained via equation 1. (c) Scatter plots of average time constants ( ) as a function of PL wavelengths for these molecules grafted on titania. The solid lines are displayed to guide the eyes.
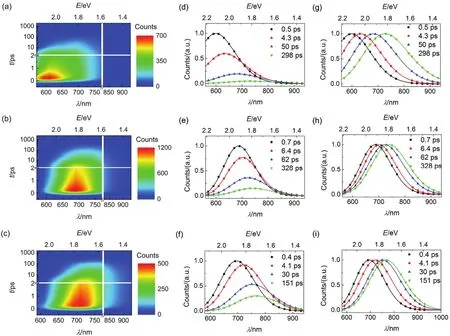
Fig.12 (a-c) Contour plots of time-resolved PL (TRPL) spectroscopies, (d-f) evolution associated PL (EAPL) spectroscopies,and (g-i) normalized EAPL of (a, d, and g) C210, (b, e, and h) C214, and (c, f, and i) C216 grafted on alumina. The time constants of spectroscopic evolution derived from global fitting are included, and the solid lines are obtained via log-normal function.
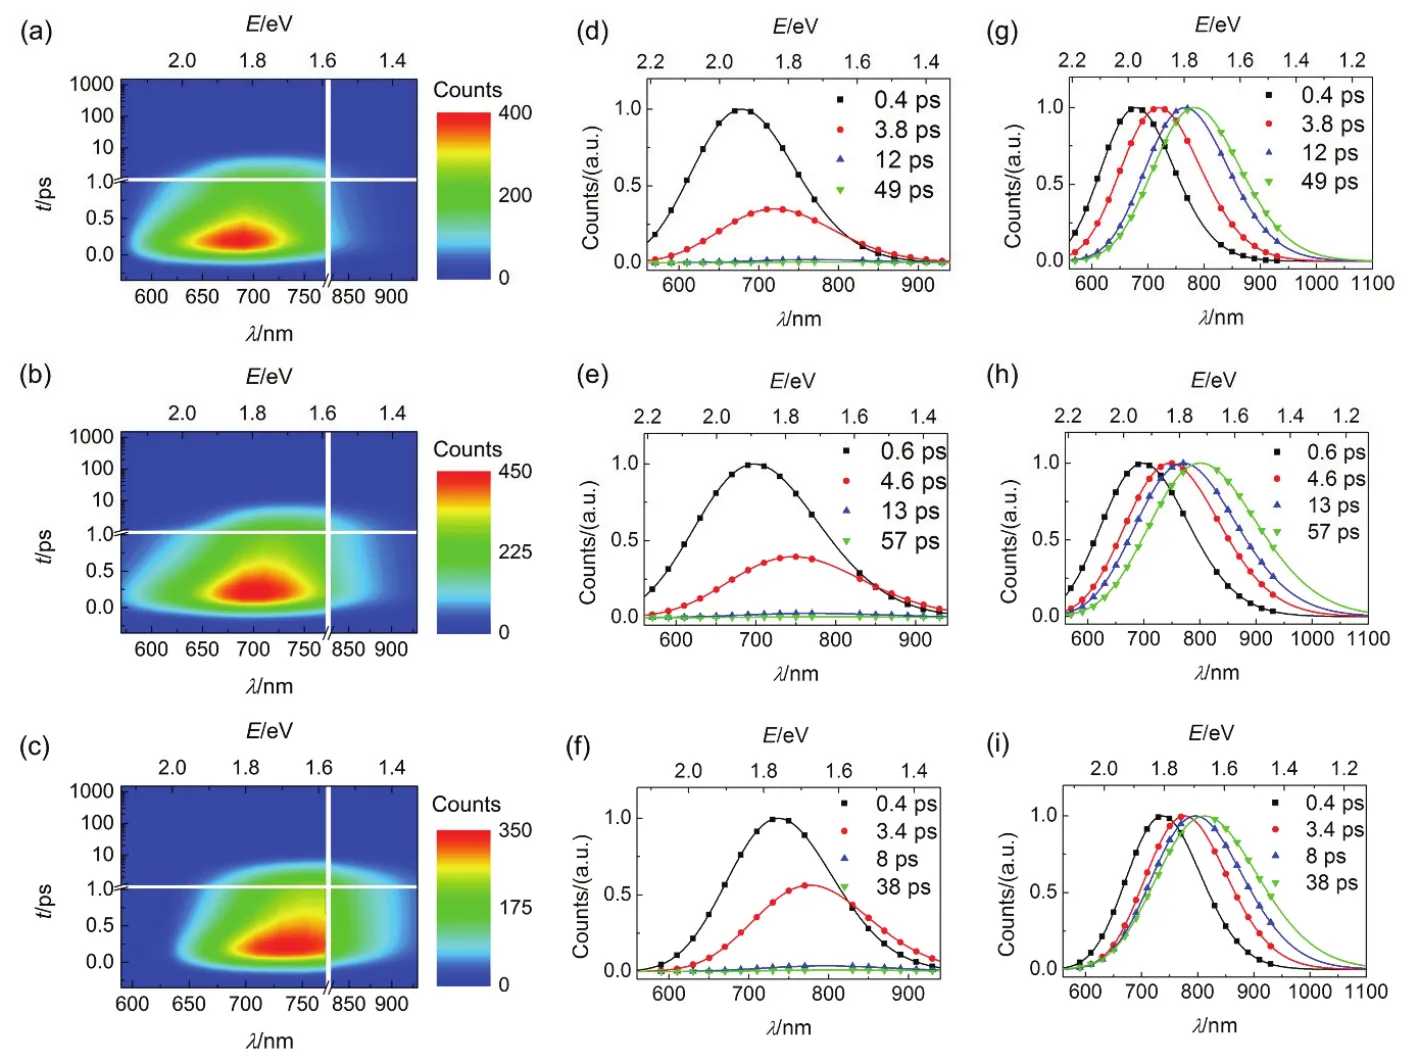
Fig.13 (a-c) Contour plots of time-resolved PL (TRPL) spectroscopies, (d-f) evolution associated PL (EAPL) spectroscopies,and (g-i) normalized EAPL of (a, b, and g) C210, (b, e, and h) C214, and (c, f, and i) C216 grafted on titania. The time constants of spectroscopic evolution derived from global fitting are included, and the solid lines are obtained via log-normal function.
Along with PL wavelengths red shifting which is associated with a decrease of the potential energy of excited state, the values ofbecome larger for each dye as presented in Fig.14b, featuring a broad time scale over one magnitude of order for time constants of electron injection due to the great energy losses originating from the multiple torsional relaxations. The values ofin theexcited state are 6.1, 6.9 and 5.7 ps for C210, C214 and C216, respectively. It is obvious that the value ofin thestate is in the order of C216 <C210 <C214 which implys that the electronic coupling between the excited state of dye molecules and titania is changed by switching the π-cconjugated linker from bifuran to bithiophene for dye C214 and to biselenophene for dye C216. It is reasonable to observe a slight largerfor C214 at a given energy of PL, which might ascribed to the weaker electronic coupling of C214 in the excited state with titania along with the larger reorganization energy of electron injection for C214.
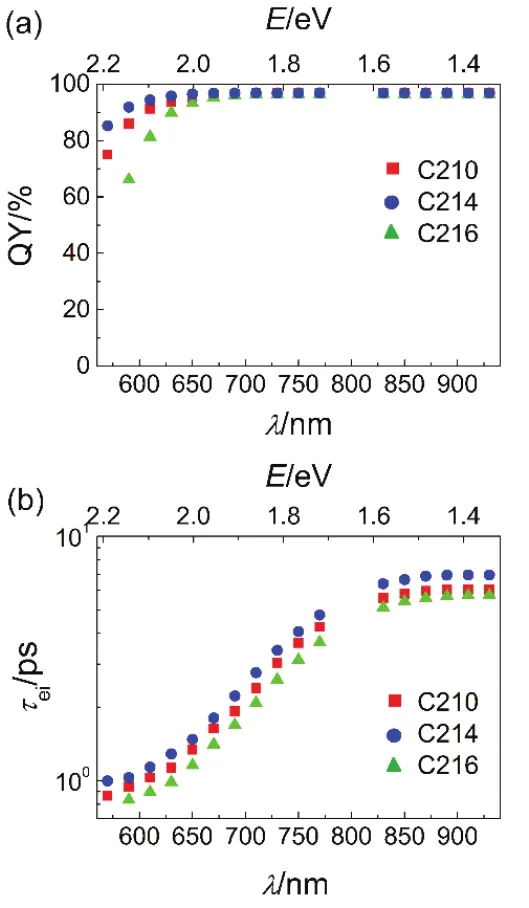
Fig.14 (a) Dynamic PL quenching yields (QY, symbols) of C210 (red), C214 (blue), and C216 (green). (b) Time constants of electron injection as a function of PL wavelengths.
We fabricated DSCs through immersing a bilayer titania film into a mixed solvent of chloroform and ethanol (with volume ratio of 1/9) dissolved with dye molecules. More manufacture details are given in the experimental section. By using monochromatic lights at the wavelength interval of 10 nm, we examined the external quantum efficiencies (EQEs) at short-circuit as shown in Fig.15a. The values of maximal EQE are 80%, 86% and 75% for C210, C214 and C216, respectively. It could be found that saturation of absorption is achieved for all three dyes by observing the wavelength-dependent light-harvesting yields (φLH) presented in Fig.15b. Then we measured the photocurrent density-photovoltage (J-V) curves under an irradiance of simulated AM1.5G sunlight (100 mW·cm-2, ASTM G173-03) (Fig.15c), and the averaged photovoltaic parameters of 4 cells were listed in Table 1. The results of J-V curves are in good agreement with the integrals of EQEs. Though the fill factor for DSCs fabricated with C214 is lower than that of C216, the overall PCE value is comparative due to the higher VOCfor C214.
With a suit of neutral metal meshes, J-V curves were also tested under different irradiances of attenuated AM1.5G lights, and the recorded VOCis plotted as a logarithmic function of(Fig.15d). The fitting lines of dye C210, C214 and C216 are nearly parallel, and the value of VOCfor C214 is higher than that of C210 (~32 mV) and C216 (~45 mV). We further carried out charge extraction (CE) and transient photovoltage decay (TPD) measurements to scrutinize the interfacial energetic and dynamic origins of VOCvariationThe conduction-band (CB) edge and distribution of trap states of titania should be not changed for each dye because charges extracted from titaniaagainst VOCare quite overlapped as observed in Fig.15e. The half-lifetime of electrons (tTPD) in the CB is in the order

Fig.15 (a) Plots of external quantum efficiencies (EQEs) as a function of wavelengths (λ) for DSCs made with dye-grafted bilayer [(4.6+5.0)-μm-thick] titania films in collaboration with an ionic liquid composite electrolyte. (b) Wavelength-dependent light-harvesting yields (φLH) of 8.0-μm-thick mesoporous titania films grafted with dye molecules and also immersed in an ionic liquid composite electrolyte. (c) Current-voltage (J-V) curves measured under an irradiance of 100 mW·cm-2 simulated AM1.5G sunlight. On top of a DSC was laminated with an antireflection film. The aperture area of our metal mask was 0.160 cm2. (d) Open-circuit photovoltages (VOC) plotted against short-circuit photocurrent densities (JSC). The solid linear fittings were also included. (e) Plots of charges extracted from a dye-grafted titania film (QCE) versusVOC. (f) Plots of electron half-lifetimes as a function of of C210 (red), C214 (blue), and C216 (green).
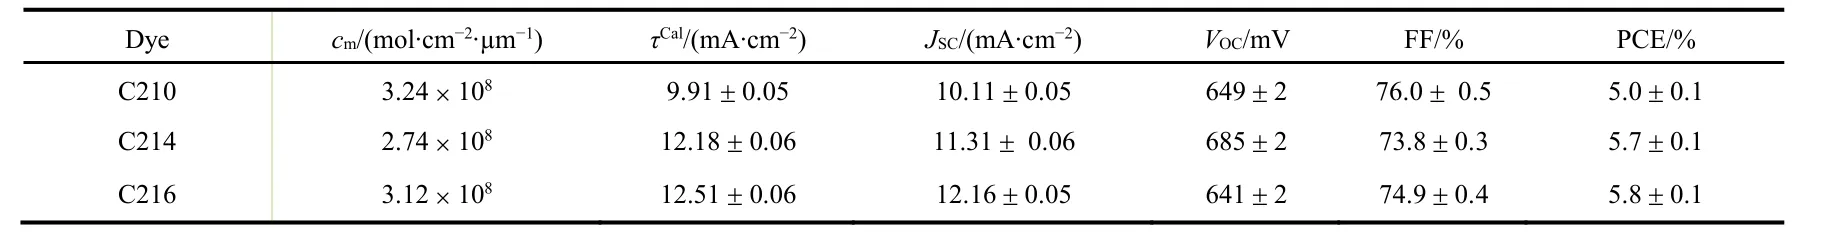
Table 1 Averaged photovoltaic parameters of 4 cells measured at an irradiance of 100 mW·cm-2 simulated AM1.5G sunlight.
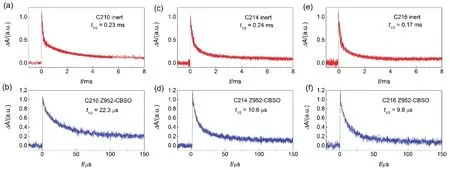
Fig.16 Normalized absorption transients upon nanosecond laser pulse excitation of transparent titania films grafted with: (a) C210, (c) C214, and (e) C216 immersed in an inert electrolyte composed of 0.5 mol·L-1 N-butylbenzoimidazole (NBB) in EMITFSI; (b) C210, (d) C214, and (f) C216 immersed in an ionic liquid composite electrolyte. The excitation wavelength was selected according to a 0.5 optical density of dye-grafted titania films to yield an alike distribution profile of vertically excited states in our testing samples. Excitation wavelength: 579 nm for C210, 596 nm for C214, and 620 nm for C216 in contact with an inert electrolyte, while 583 nm for C210, 595 nm for C214, and 619 nm for C216 in contact with an ionic liquid composite electrolyte. Pulse fluence: 20 μJ·cm-2. Probe wavelength: 785 nm. Multi-exponential fittings were shown as solid gray lines.
1/2 C216 <C210 <C214 (Fig.15f), which is in good agreement with the order of VOCvariation. The dye loading amounts (cm) on the mesoporous titania film were also estimated with visible spectrometry, being 3.24 × 10⁻⁸mol·cm-2·μm-1for C210, 2.74 × 10⁻⁸mol·cm-2·μm-1for C214, and 3.12 × 10⁻⁸mol·cm-2· μm-1for C216. Obviously, the somewhat higher values of cm for C210 with bifuran and C216 with biselenophene do not contribute to an enhanced VOCcomparing with C214 with bithiophene.
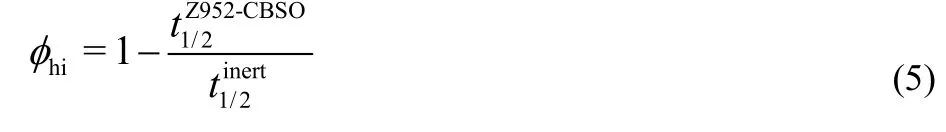
Furthermore, by using nanosecond laser flash photolysis spectrometer, we measured the charge transfer kinetics of reactions of photo-oxidized dye molecules (D+) with an ionic liquid composite electrolyte containing iodine anions and electrons in the conduction band as well as traps below the CB of titania. Inert electrolyte without iodine anions is used to fabricate cells to evaluate the dual-path charge transfer kinetics ofreactions. In detail, a 785 nm probe light was chosen in the measurements considering the robust electronic absorptions in the near-infrared spectral region of D+for all three dyes. The traces of transient absorption for dye grafted titania films with an inert electrolyte decay slow, which is attributed to the charge transfer reaction between D+and electrons stored in titania. As shown in Fig.16. The half lifetimes () of this reaction are 0.22, 0.24 and 0.17 ms for C210, C214 and C216, respectively. We observed remarkable acceleration decays of traces when an ionic liquid composite electrolyte introduced in device fabrication instead of the inert electrolyte. The phenomenon directly reflected the occurrence of hole injection betweenwith the iodine anions. The half-reaction timeare 23.5, 10.6 and 9.8 μs for C210, C214 and C216, respectively. The hole injection yield (hiφ) can be calculated by the formula being 90.3%, 95.6%, and 94.2% for C210, C214 and C216, respectively. The relative lower hole injection yield for C210 give a clue on the aforementioned EQE dissimilarity.
4 Conclusions
In conclusion, we have systematically inspected the photoluminescence and charge carrier dynamics of organic sensitizers with different conjugated linkers. The measurements based on femtosecond fluorescence up-conversion and time-correlated single-photon counting techniques have demonstrated that the occurrence of dynamic Stokes shifts for these three dyes in different media involving organic solvent, polymer films and the surface of porous oxide film surface, indicating the existence of stepwise intramolecular relaxations. We have disclosed a broad time scale over one magnitude of order for time constants of electron injection due to the great energy losses originating from the multiple torsional relaxations. With respect to the bifuran based dye C210 and biselenophene based sensitizer C216, C214 with bithiophene features a longer lifetime of equilibrium excited state, without enhancing the yield of electron injection at the functional interface of titania and dye because of sluggish electron injection kinetics. Our work helped a better understanding in the ultrafast femtosecond scale for the molecular engineering of organic dyes and encouraged further explorations on DSCs dyes. Supporting Information:available free of charge via the internet at http://www.whxb.pku.edu.cn.
(1) O’Regan, B. C.; Grätzel, M. Nature 1991, 353, 737. doi: 10.1038/353737a0
(2) Mishra, A.; Fischer, M. K. R.; Bäuerle, P. Angew. Chem. Int. Ed. 2009, 48, 2474. doi: 10.1002/anie.200804709
(3) Imahori, H.; Umeyama, T.; Ito, S. Acc. Chem. Res. 2009, 42, 1809. doi: 10.1021/ar900034t
(4) Clifford, J. N.; Martínez-Ferrero, E.; Viterisi, A.; Palomares, E. Chem. Soc. Rev. 2011, 40, 1635. doi: 10.1039/B920664G
(5) Wonneberger, C.; Li, H. Adv. Mater. 2012, 24, 613. doi: 10.1002/adma.201104447
(6) Wu, Y.; Zhu, W. Chem. Soc. Rev. 2013, 42, 2039. doi: 10.1039/C2CS35346F
(7) Liang, M.; Chen, J. Chem. Soc. Rev., 2013, 42, 3453. doi: 10.1039/C3CS35372A
(8) Lin, Y. Z.; Huang, C. H.; Chang, Y. J.; Yeh, C. W.; Chin, T. M.; Chi, K. M.; Chou, P. T.; Watanabe, M.; Chow, T. J. Tetrahedron 2014, 70, 262. doi: 10.1016/j.tet.2013.11.072
(9) Li, H.; Yang, Y.; Hou, Y.; Tang, R.; Duan, T.; Chen, J.; Wang, H.; Han, H.; Peng, T.; Chen, X.; Li, Q.; Li, Z. ACS Sustainable Chem.Eng. 2014, 2, 1776. doi: 10.1021/sc500234a
(10) Kakiage, K.; Aoyama, Y.; Yano, T.; Oya, K.; Fujisawa, J. I.; Hanaya, M. Chem. Commun. 2015, 51, 15894. doi: 10.1039/C5CC06759F
(11) Yao, Z.; Zhang, M.; Li, R.; Yang, L.; Qiao, Y.; Wang, P. Angew.Chem. Int. Ed. 2015, 127, 6092. doi: 10.1002/ange.201501195 (12) Yao, Z.; Wu, H.; Li, Y.; Wang, J.; Zhang, J.; Zhang, M.; Guo, Y.; Wang, P. Energy Environ. Sci. 2015, 8, 3192. doi: 10.1039/C5EE02822A
(13) Yao, Z.; Zhang, M.; Wu, H.; Yang, L.; Li, R.; Wang, P. J. Am.Chem. Soc. 2015, 137, 3799. doi: 10.1021/jacs.5b01537
(14) Li, H.; Fang, M.; Xu, T.; Hou, Y.; Tang, R.; Chen, J.; Liu, L.; Han, H.; Peng, T.; Li, Q.; Li, Z. Org. Chem. Front. 2016, 3, 233. doi: 10.1039/C5QO00377F
(15) Yang, L.; Li, Y.; Chen, S.; Zhang, J.; Zhang, M.; Wang, P. Acta Phys. -Chim. Sin. 2016, 32, 329. [杨林, 李阳, 陈淑, 张静, 张敏, 王鹏. 物理化学学报, 2016, 32, 329.] doi: 10.3866/PKU.WHXB201511031
(16) Weng, X. L.; Wang, Y.; Jia, C. Y.; Wan, Z. Q.; Chen, X. M.; Yao, X. J. Acta Phys. -Chim. Sin. 2016, 32, 1990. [翁小龙, 王艳, 贾春阳, 万中全, 陈喜明, 姚小军. 物理化学学报, 2016, 32, 1990.] doi: 10.3866/PKU.WHXB201605031
(17) Xiao, A.; Lu, H.; Zhao, Y.; Luo, G. G. Acta Phys. -Chim. Sin. 2016, 32, 2968. [肖岸, 卢辉, 赵阳, 骆耿耿. 物理化学学报, 2016, 32, 2968.] doi: 10.3866/PKU.WHXB201609194
(18) Li, Z. G.; Lu, T.; Gao, H.; Zhang, Q.; Li, M. J.; Ren, W.; Lu, W. C. Acta Phys. -Chim. Sin. 2017, 33, 1789. [李重杲, 卢天, 高恒, 张庆, 李敏杰, 任伟, 陆文聪. 物理化学学报, 2017, 33, 1789.] doi: 10.3866/PKU.WHXB201705082
(19) Ren, Y.; Liu, J.; Zheng, A.; Dong, X.; Wang, P. Adv. Sci. 2017, 1700099. doi: 10.1002/advs.201700099
(20) Rehm, J. M.; McLendon, G. L.; Nagasawa, Y.; Yoshihara, K.; Moser, J.; Grätzel, M. J. Phys. Chem. 1996, 100, 9577. doi: 10.1021/jp960155m
(21) Tachibana, Y.; Rubtsov, I. V.; Montanari, I.; Yoshihara, K.; Klug, D. R.; Durrant, J. R. J. Photoch. Photobio. A 2001, 142, 215. doi: 10.1016/S1010-6030(01)00516-0
(22) Luo, L.; Lo, C. F.; Lin, C. Y.; Chang, I. J.; Diau, W. G. J. Phys.Chem. B 2006, 110, 410. doi: 10.1021/jp055365q
(23) Martín, C.; Ziółek, M.; Marchena, M.; Douhal, A. J. Phys. Chem.C 2011, 115, 23183. doi: 10.1021/jp203489u
(24) Adamo, C.; Jacquemin, D. Chem. Soc. Rev. 2013, 42, 845. doi: 10.1039/C2CS35394F
(25) Fakis, M.; Hrobárik, P.; Yushchenko, O.; Sigmundová, I.; Koch, M.; Rosspeintner, A.; Stathatos, E.; Vauthey, E. J. Phys. Chem. C 2014, 118, 28509. doi: 10.1021/jp509971q
(26) Ai, X.; Guo, J.; Anderson, N. A.; Lian, T. J. Phys. Chem. B 2004, 108, 12795. doi: 10.1021/jp0483977
(27) Fakis, M.; Stathatos, E.; Tsigaridas, G.; Giannetas, V.; Persephonis, P. J. Phys. Chem. C 2011, 115, 13429. doi: 10.1021/jp201143n
(28) Yang, L.; Chen, S.; Zhang, J.; Wang, J.; Zhang, M.; Dong, X.; Wang, P. J. Mater. Chem. A 2017, 5, 3514. doi: 10.1039/C6TA10506H
(29) Li, Y.; Wang, J.; Yuan, Y.; Zhang, M.; Dong, X.; Wang, P. Phys.Chem. Chem. Phys. 2017, 19, 2549. doi: 10.1039/C6CP07916D.
(30) Chen, S.; Yang, L.; Zhang, J.; Yuan, Y.; Dong, X.; Wang, P. ACS Photonics 2017, 4, 165. doi: 10.1021/acsphotonics.6b00772
(31) Li, R.; Zhang, M.; Yan, C.; Yao, Z.; Zhang, J.; Wang, P. ChemSusChem 2015, 8, 97. doi: 10.1002/cssc.201402806
(32) Yang, L.; Yao, Z.; Liu, J.; Wang, J.; Wang, P. ACS Appl. Mater.Inter. 2016, 8, 9839. doi: 10.1021/acsami.6b02075
(34) Fleming, G. R.; van Grondelle, R. Current opinion in structural biology: Femtosecond spectroscopy of photosynthetic lightharvesting systems; Elsevier: Holland, 1997; Vol. 7, pp. 738-748.
(35) McCamant, D. W.; Kukura, P.; Mathies, R. A. J. Phys. Chem. A 2003, 107, 8208. doi: 10.1021/jp030147n
(36) Trotzky, S.; Hoyer, T.; Tuszynski, W.; Lienau, C.; Parisi, J. J. Phys. D: Appl. Phys. 2009, 42, 055105. doi: 10.1088/0022-3727/42/5/055105
(37) Li, R.; Lv, X.; Shi, D.; Zhou, D.; Cheng, Y.; Zhang, G.; Wang, P. J. Phys. Chem. C 2009, 113, 7469. doi: 10.1021/jp900972v
(38) Wang, P.; Zakeeruddin, S. M.; Comte, P.; Charvet, R.; Humphry-Baker, R.; Grätzel, M. J. Phys. Chem. B 2003, 107, 14336. doi: 10.1021/jp0365965
(39) Liu, J.; Li, R.; Si, X.; Zhou, D.; Shi, Y.; Wang, Y.; Jing, X.; Wang, P. Energy Environ. Sci. 2010, 3, 1924. doi: 10.1021/jp0365965
(40) Cai, N.; Wang, Y.; Xu, M.; Fan, Y.; Li, R.; Zhang, M.; Wang, P. Adv. Funct. Mater. 2013, 23, 1846. doi: 10.1002/adfm.201202562
(41) Zhang, J.; Yao, Z.; Cai, N.; Yang, L.; Xu, M.; Li, R.; Zhang, M.; Dong, X.; Wang, P. Energy Environ. Sci. 2013, 6, 1604. doi: 10.1039/C3EE40375K
(42) Snellenburg, J. J.; Laptenok, S. P.; Seger, R.; Mullen, K. M.; van Stokkum, I. H. M.; J. Stat. Softw. 2012, 49, 1. doi: 10.18637/jss.v049.i03
(43) Lanzani, G.; Nisoli, M.; De Silvestri, S.; Tubino, R. Chemical Physics Letters: Femtosecond vibrational and torsional energy redistribution in photoexcited oligothiophenes; Elsevier: Holland, 1996; Vol. 251, pp. 339-345.
(44) Glasbeek, M.; Zhang, H. Chem. Rev. 2004, 104, 1929. doi: 10.1021/cr0206723
(45) Amdursky, N.; Erez, Y.; Huppert, D. Acc. Chem. Res. 2012, 45, 1548. doi: 10.1021/ar300053p
(46) Nelson, T.; Fernandez-Alberti, S.; Roitberg, A. E.; Tretiak, S. Acc.Chem. Res. 2014, 47, 1155. doi: 10.1021/ar400263p
(47) Oliver, T. A. A.; Lewis, N. H. C.; Fleming, G. R. Proc. Natl.Acad. Sci. U.S.A. 2014, 111, 10061. doi: 10.1073/pnas.1409207111
(48) Klymchenko, A. S.; Demchenko, A. R. Methods in Enzymology:Chapter 3 Multiparametric Probing of Microenvironment with Solvatochromic Fluorescent Dyes; Elsevier: Holland, 2008; Vol. 450, pp. 37-58.
(49) Shemesh, D.; Sobolewski, A. L.; Domcke, W. Phys. Chem. Chem.Phys. 2010, 12, 4899. doi: 10.1039/B927024H
(50) Qian, J.; Brouwer, A. M. Phys. Chem. Chem. Phys. 2010, 12, 12562. doi: 10.1039/C003419C
(51) O’Regan, B. C.; Durrant, J. R. Acc. Chem. Res. 2009, 42, 1799. doi: 10.1021/ar900145z
(52) Fabregat-Santiago, F.; Garcia-Belmonte, G.; Mora-Séro, I.; Bisquert, J. Phys. Chem. Chem. Phys. 2011, 13, 9083. doi: 10.1039/C0CP02249G
(53) Bisquert, J. ChemPhysChem 2011, 12, 1633. doi: 10.1002/cphc.201100248
猜你喜欢
电影文学(2022年6期)2022-05-21
理财周刊(2022年4期)2022-04-30
婚姻与家庭·婚姻情感版(2022年5期)2022-04-29
快乐作文(7.8年级)(2022年2期)2022-04-15
小学生学习指导(低年级)(2021年12期)2021-12-31
金秋(2021年24期)2021-12-01
小学生学习指导·低年级(2021年6期)2021-09-10
格言·校园版(2021年18期)2021-09-10
海峡姐妹(2020年11期)2021-01-18
作文周刊·小学二年级版(2020年16期)2020-06-12
