
Dihydromyricetin Inhibits Activation of Hepatic Stellate Cells Induced by Iron Overload Through Potential Inhibition of Ferritinophagy*
2022-12-22 13:58ZENGBinZHOUShouHongXUZiWeiCHUYuYangDUANWuXia
生物化学与生物物理进展 2022年12期
ZENG Bin,ZHOU Shou-Hong,XU Zi-Wei,CHU Yu-Yang,DUAN Wu-Xia
(1)Department of Gastroenterology,First Affiliated Hospital of University of South China,Hengyang 421001,China;2)Guangxi Key Laboratory of Brain and Cognitive Neuroscience,Guilin Medical University,Guilin 541199,China;3)Guangxi Key Laboratory of Diabetic Systems Medicine,Guilin Medical University,Guilin 541199,China;4)Department of Gastroenterology,TheFourth People’s Hospital of Changde City,Changde 415000,China;5)Feinberg School of Medicine,Northwestern University,Chicago,IL 60611,USA;6)Department of Gastroenterology,People’s Hospital of Youxian,Zhuzhou 412300,China)
Abstract Objective Hepatic stellate cells (HSCs) are the main producers of fibrotic extracellular matrix (ECM) and play a critical role in the initiation, progression, and regression of hepatic fibrosis (HF). Dihydromyricetin (DMY) has hepatoprotective properties, but the mechanism of this protection is unclear. Our study examined the effects of DMY on the activation of HSCs triggered by ferric ammonium citrate (FAC) in HSC-T6 cells and explored the possible mechanisms of the hepatoprotective properties of DMY. Methods Cell viability was evaluated using MTT assay. The levels of ECM in the culture supernatant were examined usingenzyme linked immunosorbent assay.The iron deposition levels in HSC-T6 cells were assessed using Prussian Blue staining. The total iron and free iron levels in HSC-T6 cells were measured using colorimetric assay and calcein-AM assay,respectively. The ultrastructure of HSC-T6 cells was observed using transmission electron microscopy. The expression levels of ferritin heavy chain 1 (FTH1), α-smooth muscle actin (α-SMA), nuclear receptor coactivator 4 (NCOA4), microtubule-associated protein 1 light chain 3(LC3),and p62/SQSTM1 were measured using Western blotting.Results Compared with the FAC group,the DMY+FAC group had a significant reduction in the main components of ECM, total iron and free ironlevels, expression levels of α-SMA, NCOA4, and LC3-Ⅱproteins, and the ratio of LC3-Ⅱ/LC3-Ⅰ; there was also a significant upregulation of the protein expression levels of FTH1 and p62. Furthermore, rapamycin partially blocked the effects of DMY, which inhibited the activation of HSCs induced by FAC.Conclusion DMY inhibits the activation of HSCs induced by iron overload,and the underlying mechanism may be involved in the inhibition of ferritinophagy.
Key words dihydromyricetin,hepatic stellate cell,iron overload,ferritinophagy,hepatic fibrosis
Hepatic fibrosis (HF) is the common pathophysiological basis of numerous chronic liver diseases[1]. HF triggers greater synthesis than decomposition of the extracellular matrix (ECM),which results in the deposition of ECM in the liver,thus destroying the hepatic structure and leading to cirrhosis and liver failure[2-3]. Currently, the clinical treatments for HF are few in number and of limited efficacy. Therefore, elucidating the pathogenesis of HF, identifying novel effective treatments, and preventing the development of HF have become research hotspots in the field of liver diseases.
Hepatic stellate cells (HSCs) are the main producers of fibrotic ECM[4].The activation of HSCs is the initial step in the development of HF. HSCs mainly exist in the Disse space of the liver,accounting for 5%-15% of the total number of hepatocytes[5-6].Ⅰn the process of HF, HSCs transform into myofibroblast-like cells. The expression of myogenic marker proteins and the loss of large quantities of lipid droplets containing triacylglycerol and retinol ester are the important features of HSC activation[7-8]. α-Smooth muscle actin (α-SMA) is a sensitive and reliable marker protein for HSC activation, whereby HSC activation results in the upregulation of α-SMA expression[9]. Moreover, iron overload plays an important role in the activation of HSCs[10]; in HF, iron overload is often inevitable and leads to different degrees of HF in patients with thalassemia. Ferritin participates in the storage and release of iron and comprises 24 subunits with a combination of ferritin heavy chain 1 (FTH1) and light chains. When intracellular iron levels are low,ferritin is degraded, thus releasing iron for use by the cell[11]. Ferritinophagy is a subtype of cell autophagy,and is a selective autophagy with nuclear receptor coactivator 4 (NCOA4) as a cargo receptor, which mediates the degradation of ferritin[12-13]. During ferritinophagy, ferritin is delivered to the autophagosome by NCOA4, and this is followed by the membrane association of microtubule-associated protein 1 light chain 3 (LC3) and conversion of cytoplasmic LC3-Ⅰ to phosphatidylethanolaminebound LC3-Ⅱ. Ferritinophagy releases ferritin-bound iron[14-15]. A moderate level of ferritinophagy maintains the balance of intracellular iron, whereas excessive ferritinophagy leads to intracellular iron overload[16].
Ampelopsis grossedentata(Hand.-Mazz.) W.T.Wang is traditionally used to alleviate respiratory infections, asthma, coughs, colds, and sore throats in southern China[17]. Dihydromyricetin (DMY) is the most abundant (~30%) flavonoid extracted fromAmpelopsisgrossedentata(Hand.-Mazz.)W.T.Wang[18].DMY possesses numerous bioactive properties,including anti-inflammatory, anti-oxidative, antiatherosclerotic, and anti-cancer effects. Ⅰt can also decrease blood glucose, enhance immunity, and protect against bone loss[19-21]. Previous studies have suggested that DMY possesses hepatoprotective effects. For example, Qiuet al.[22]found that DMY alleviates ethanol-induced hepatic injury.Furthermore, Zenget al.[23]reported that DMY ameliorates nonalcoholic fatty liver disease by improving mitochondrial respiratory capacity and redox homeostasis through the modulation of sirtuin 3 signaling.Guoet al.[24]demonstrated that DMY exerts a protective effect on the fatty liver through the NF-κB/p53/Bax signaling pathways in a rat model.However, whether DMY can inhibit HF remains unclear. We hypothesized that DMY inhibits the activation of HSCs induced by iron overload and the occurrence of HF by inhibiting the ferritinophagy pathway. To explore this possibility, we used ferric ammonium citrate (FAC) to induce iron overload and the activation of HSCs in HSC-T6 cells. Thereafter,the effects of DMY on iron overload and the activation of HSC-T6 cells were examined. Our results demonstrate that DMY inhibits the activation of HSCs induced by iron overload through potential ferritinophagy pathway.
1 Materials and methods
1.1 Cell culture and treatment
The rat hepatic stellate cell line of HSC-T6(Xintai Jiahe Biotech Co.,Ltd.)was used in this study.HSC-T6 cells were cultured in Dulbecco's modified eagle medium (Ⅰnvitrogen, Ⅰnc.) containing 10% calf serum (Ⅰnvitrogen, Ⅰnc.), 100 U/ml penicillin, and 0.1 g/L streptomycin(Sigma-Aldrich; Merck KGaA) and were maintained at 37°C in a humidified atmosphere of 5% CO2. Upon reaching 70%-80%confluence, the cells were harvested and seeded into 6-well plates at a density of 1.0×10⁶cells per well.The cells were randomly divided into 6 groups:control, FAC (Shanghai Macklin Biochemical Co.,Ltd.), DMY (Sigma-Aldrich; Merck KGaA), FAC+DMY, rapamycin (Sigma-Aldrich; Merck KGaA), and FAC+DMY+rapamycin. DMY was extractedviathe solvent method[25]. The molecular formula of DMY is C15H10O8; its molecular mass is 318.24 u, and its melting point is 357-360°C. DMY materializes as pure white acicular crystals. The experimental design for the cells in each group is shown in Table 1.
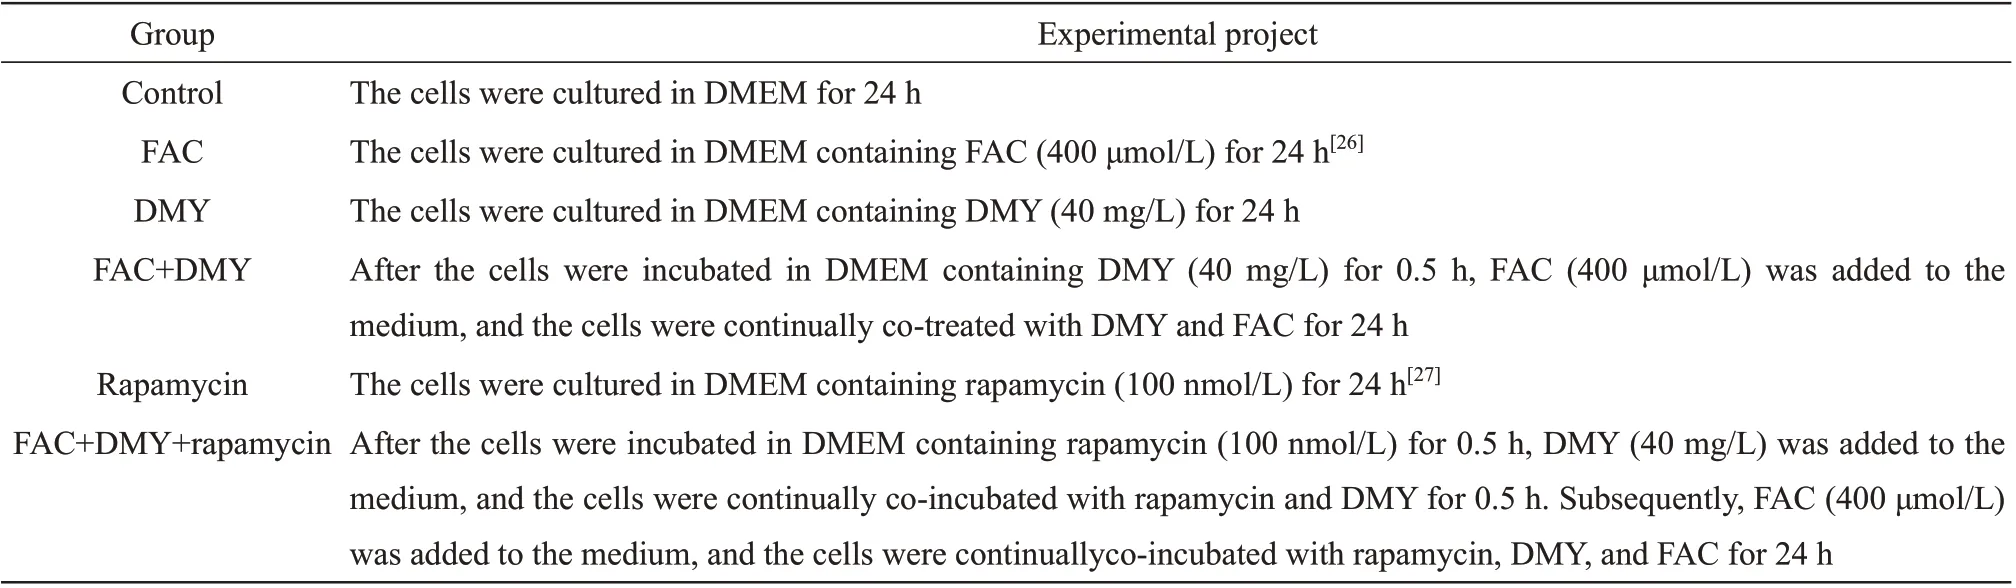
Table 1 Experimental design for the cells in each group
1.2 Detection of cell viability using MTT assay
The cell viability of HSCs was evaluated using MTT assay (Sigma-Aldrich; Merck KGaA) after the cell suspension was prepared. The cell density was adjusted to 5×10⁵cells/ml, and the cells were seeded in a 96-well cell culture plate. The cells were incubated with MTT (5 g/L) for 4 h, and 100 μl of dimethyl sulfoxide was added to each well. The detection wavelength was set at 490 nm. The absorbance (A) was measured at a wavelength of 570 nm with an ELX-800 microplate assay reader(BioTek).
1.3 Prussian Blue iron staining
The cells were seeded in a 6-well culture plate.The cell slides were washed three times with PBS and fixed with 4% polyformaldehyde for 20 min.Thereafter, the cell slides were stained with Prussian Blue (Sigma-Aldrich; Merck KGaA) dye solution at 37° C for 30 min and then washed with deionized water. Next, the cell slides were dyed with a nuclear fixing red (Sigma-Aldrich; Merck KGaA) dye solution for 5-10 min. The cell slides were then dehydrated, sealed, dried, and placed under a microscope to assess the deposition of blue particles.
1.4 Intracellular iron colorimetric assay
The cells were collected in a test tube and 0.3%Triton X-100 was added. The cell membranes were ruptured, and the supernatant was collected by centrifugation at 4°C for 15 min at 10 000×g. Next,50 μl of standard solution and 50 μl of supernatant were added to 96-well plates. Per the assay kit's instructions (Amyjet Technology Co., Ltd.), the working liquids A, B, and C were added in turn at a 1∶1∶1 ratio. All samples were mixed well and incubated for 1 h at 60°C. TheAvalue was measured at a wavelength of 550 nm with an ELX-800 microplate assay reader. The relative level of total intracellular iron was calculated with reference to theAvalue of the control group set as 100%.
1.5 Intracellular free iron detection
The cells in the logarithmic growth stage were planted in 6-well cell culture plates with a cell density of 1×10⁶cells/ml. The cells were cultured in an incubator containing 5% CO2at 37°C. Next, the cells were collected by adding trypsindigestive juice and centrifuged at 2 000×gfor 5 min. The cells were incubated with 0.5 μmol/L calcein-AM (Sigma-Aldrich;Merck KGaA)at 37°C for 30 min.The mean fluorescence intensity (MFⅠ) value was measured using an enzyme-labeled instrument (Molecular Devices) to obtain the first MFⅠvalue. The cells were then incubated withthe iron chelating agent deferiprone(100 μmol/L)for 1 h,and the second MFⅠvalue was measured using anenzyme-labeled instrument under the same conditions. The level of free iron was reflected by the difference in MFⅠ(ΔF).The relative level of intracellular free iron was calculated with reference to the value of ΔFin the control group set as 100%.
1.6 ELISA
The supernatant of the cell culture medium was collected after centrifugation for 5 min at 1 000 ×g.The levels of hyaluronic acid (HA), laminin (LN),procollagen Ⅲ(PCⅢ), and collagen Ⅳ(Ⅳ-C) in the supernatant were measured using ELⅠSA(Wuhan Bio-Swamp Co., Ltd.). The experiment was conducted as per the ELⅠSA kit's instructions. The concentrations of HA, LN, PCⅢ, and Ⅳ-C in the supernatant were calculated according to that of the standard curve.
1.7 Transmission electron microscopy analysis
The cells collected were fixed with 3%glutaraldehyde for 2 h at 4°C followed by 1% (v/v)perosmic acid; the cells were then dehydrated in an ethanol series. Ultrathin sections were placed on 400-mesh grids and double-stained with uranyl acetate and lead citrate. The ultrastructure of the cells was observed using a Hitachi H-600 transmission electron microscope.
1.8 Western blotting analysis
The cells were collected and lysed on ice.Protein concentrations were measured using bicinchoninic acid assay (Pierce; Thermo Fisher Scientific, Ⅰnc.).Thereafter, the protein samples were subjected to SDS-PAGE at room temperature. Following electrophoresis, the proteins were transferred electrophoretically to PVDF membranes (Pierce;Thermo Fisher Scientific, Ⅰnc.). The PVDF membranes were blocked with 3% fat-free milk for 1 h at 37°C. Next, the blots were incubated with rabbit anti-rat FTH1 (1∶300), LC-3 (1∶200),p62 (1∶200), α-SMA (1∶400), NCOA4 (1∶300),and β-actin (1∶500) monoclonal antibodies (Santa Cruz Biotechnology, Ⅰnc.) at room temperature overnight. Subsequently, the membranes were incubated with a horseradish peroxidase-conjugated secondary antibody for 2 h at room temperature.Ⅰmmunoreactivity was assessed by enhanced chemiluminescence. The band density was measured with Ⅰmage J analysis software (Rawak Software, Ⅰnc.Germany), and the quantification of the level of the protein of interest compared with that of β-actin was achieved by densitometry analysis.
1.9 Statistical analysis
All results were expressed as means±SD and analyzed using SPSS 18.0 software(ⅠBM).Significant differences between groups were determined using one-way ANOVA and LSD-ttest for continuous variables and multiple groups.P<0.05 was considered to represent a statistically significant difference.
2 Results
2.1 Effect of DMY on the activation of HSC-T6 cells induced by FAC treatment
The protein expression levels of α-SMA were significantly upregulated in the FAC group compared with that in the control group (P<0.05). Conversely,the protein expression levels of α-SMA were significantly downregulated in the DMY+FAC group compared with that in the FAC group (P<0.05).There was no statistically significant difference in the protein expression levels of α-SMA between the DMY and control groups (P>0.05) (Figure 1a, b).DMY and FAC had no effect on the cell viability of HSC-T6 cells compared with that in the control group(allP>0.05)(Figure 1c).
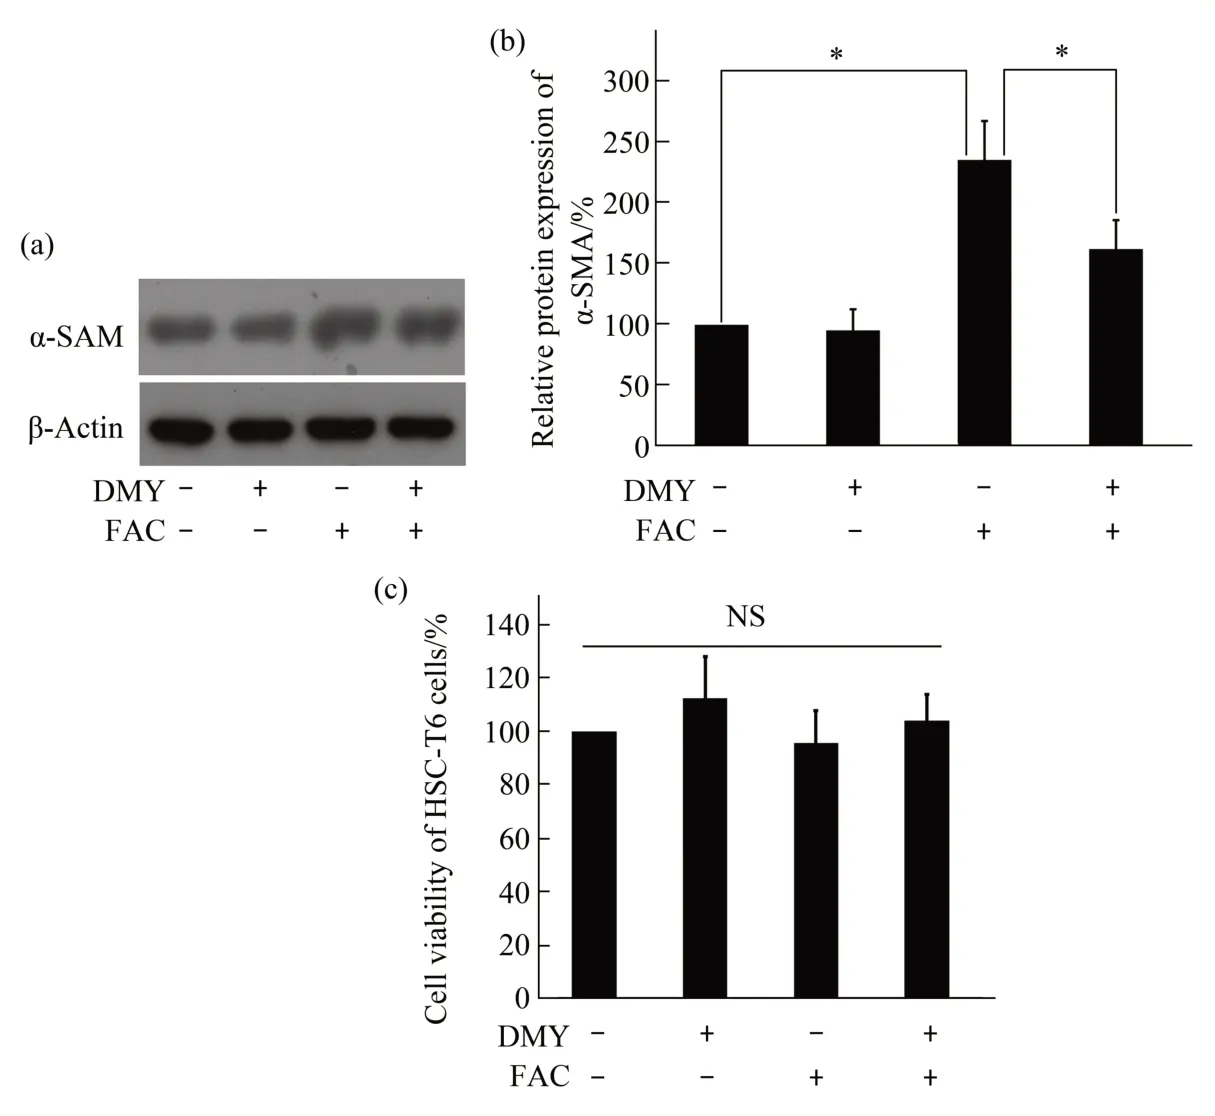
Fig.1 Effect of DMY and FAC on the protein expression level of α-SMA and effect of DMY,FAC,and rapamycin on the cell viability in HSC-T6 cells
HA, LN, PC Ⅲ, and Ⅳ-C are important components of the ECM. Our results showed that the levels of HA, LN, PCⅢ, and Ⅳ-C in the cell culture medium were significantly increased in the FAC group compared with those in the control group (allP<0.05). Ⅰn contrast, the levels of HA, LN, PCⅢ, andⅣ-C in the cell culture medium were significantly decreased in the DMY+FAC group compared with those in the FAC group (allP<0.05). There was no statistically significant difference in the levels of HA,LN, PC Ⅲ, or Ⅳ-C in the cell culture medium between the DMY and control groups (allP>0.05)(Figure 2). Taken together, our results suggest that DMY inhibits the activation of HSC-T6 cells induced by FAC.
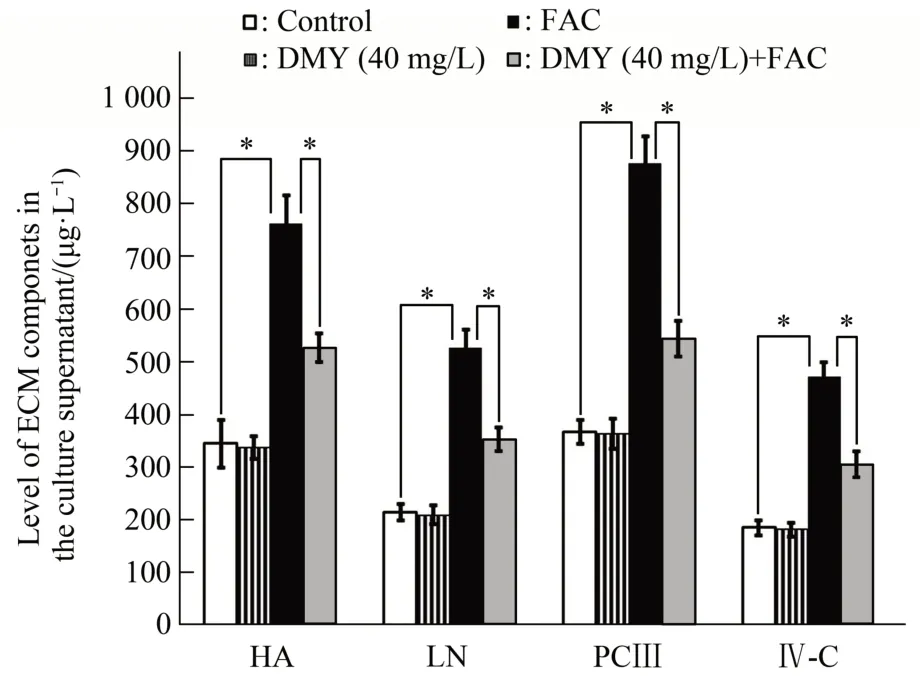
Fig.2 Effect of DMY and FAC on the levels of HA,LN,PCⅢ,and Ⅳ-C in the culture supernatant of HSC-T6 cells
2.2 Effect of DMY on iron overload induced by FAC in HSC-T6 cells
The levels of iron deposition (Figure 3a), total iron (Figure 3b), and free iron (Figure 3c) in HSC-T6 cells were significantly increased in the FAC group compared with those in the control group(allP<0.05).Conversely, the levels of iron deposition, total iron,and free iron in HSC-T6 cells were significantly decreased in the DMY+FAC group compared with those in the FAC group (allP<0.05). There was no statistically significant difference in the levels of iron deposition, total iron,and free iron in HSC-T6 cells between the DMY and control groups (allP>0.05).Our data demonstrate that DMY inhibits iron overload induced by FAC in HSC-T6 cells.
2.3 Effect of DMY on ferritinophagy induced by FAC in HSC-T6 cells
The ultrastructure of the HSC-T6 cells was observed using transmission electron microscopy. The number of autophagosomes in HSC-T6 cells was significantly increased in the FAC group compared with that in the control group (P<0.05). Ⅰn contrast,the number of autophagosomes in HSC-T6 cells was significantly decreased in the DMY+FAC group compared with that in the FAC group(P<0.05)(Figure 4a). Moreover, the protein expression levels of NCOA4(Figure 4b,c),FTH1(Figure 4b,d),and LC3-Ⅱ(Figure 4b, f), and the LC3-Ⅱ/LC3-Ⅰratio (Figure 4g) in HSC-T6 cells were significantly increased in the FAC group compared with those in the control group (allP<0.05). The protein expression levels of p62 (Figure 4b, e) in HSC-T6 cells were also significantly decreased in the FAC group compared with those in the control group (allP<0.05).Furthermore, the protein expression levels of NCOA4 and LC3-Ⅱand the LC3-Ⅱ/LC3-Ⅰratio in HSC-T6 cells were significantly decreased in the DMY+FAC group compared with those in the FAC group (allP<0.05). The protein expression levels of FTH1 and p62 in HSC-T6 cells were also significantly increased in the DMY+FAC group compared with those in the FAC group (allP<0.05). There was no statistically significant difference in the protein expression levels of NCOA4, FTH1, LC3-Ⅱ, or p62, or the LC3-Ⅱ/LC3-Ⅰratio in HSC-T6 cells between the DMY (40 mg/L) and control groups (allP>0.05). Our data suggest that DMY inhibits ferritinophagy induced by FAC in HSC-T6 cells.
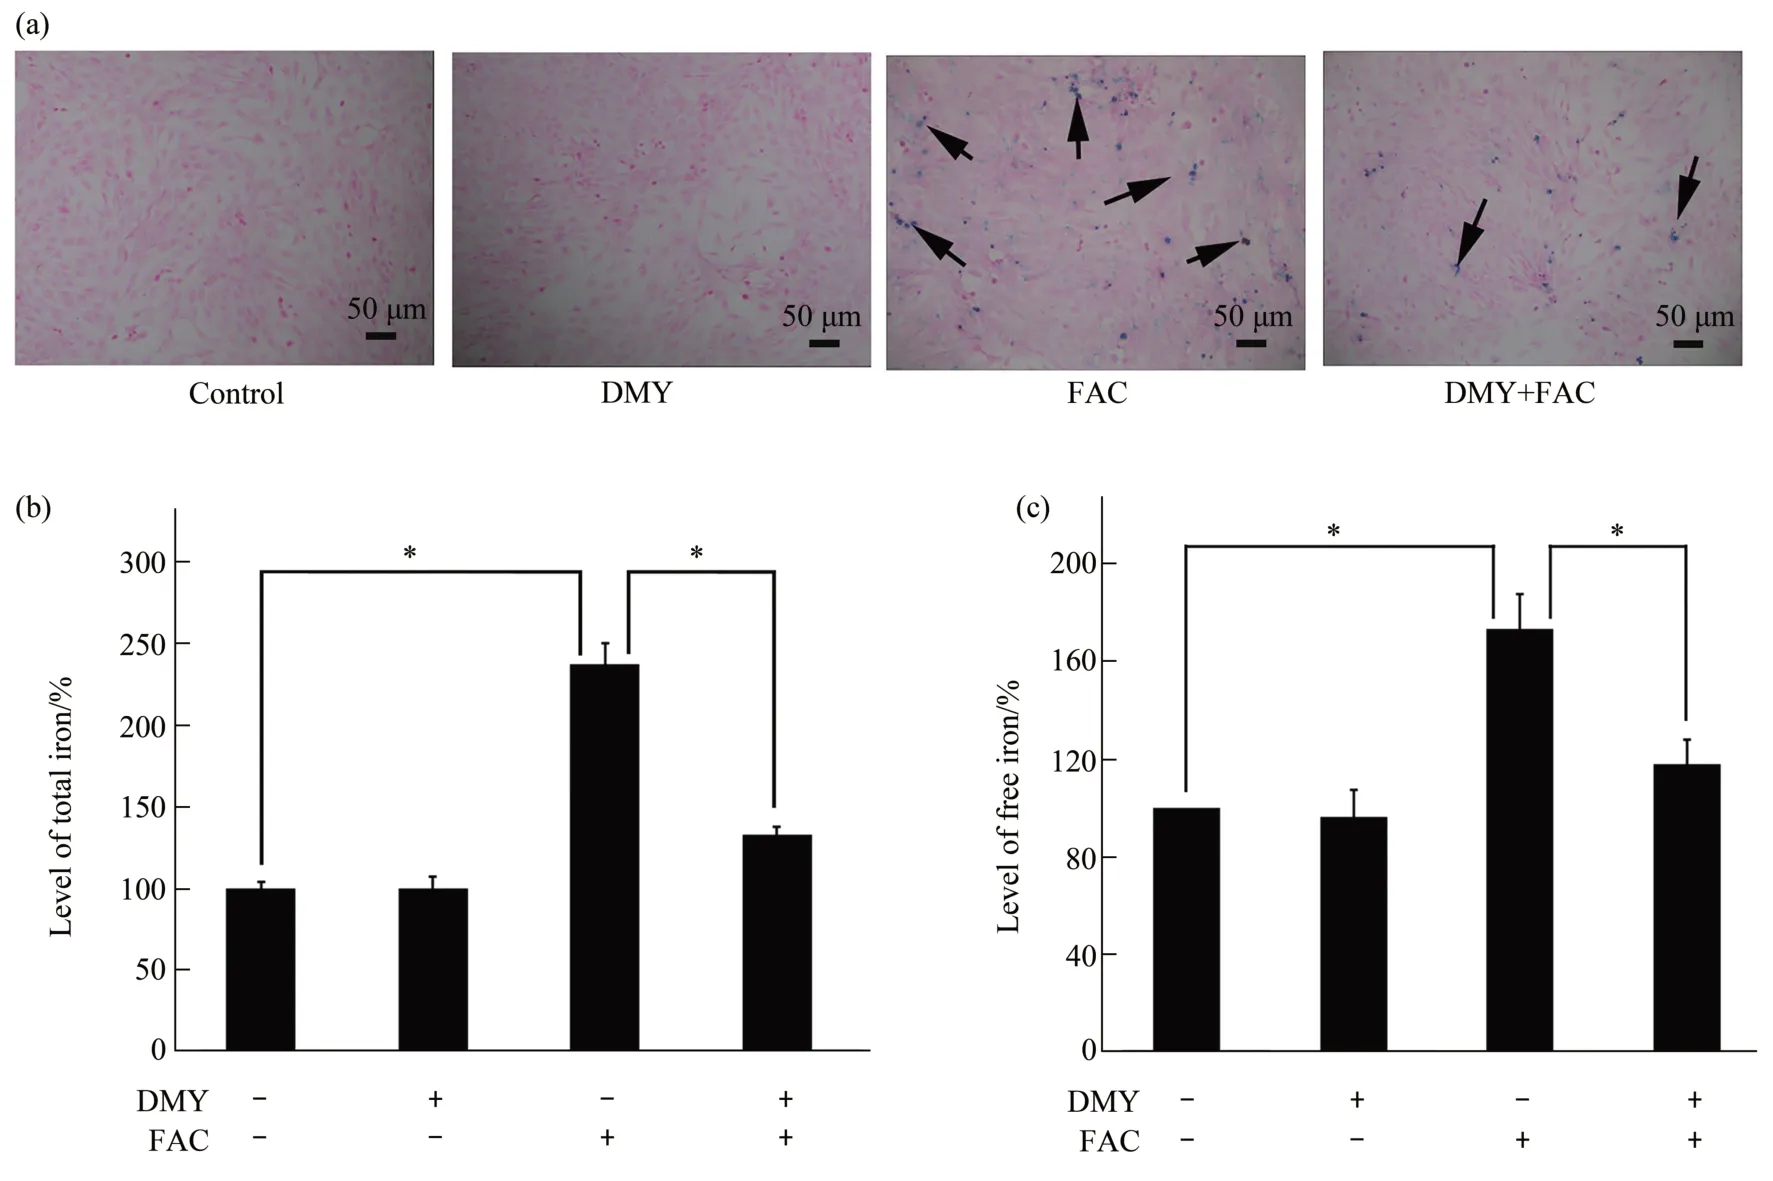
Fig.3 Effect of DMY and FAC on the levels of iron deposition,total iron,and free iron in HSC-T6 cells
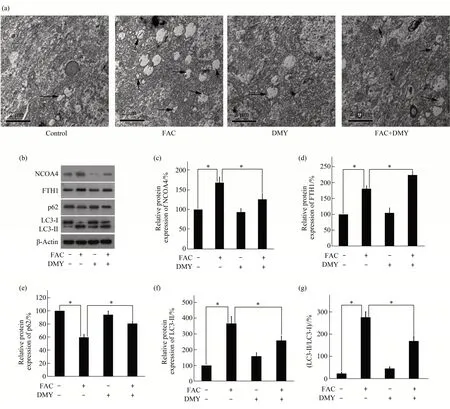
Fig.4 Effect of DMY and FAC on autophagy and the expression levels of ferritinophagy-associated proteins in HSC-T6 cells
2.4 Effect of rapamycin on the action of DMY
The protein expression levels of α-SMA (Figure 5a), the levels of HA, LN, PC Ⅲ, and Ⅳ-C in the supernatant of the cell culture of HSC-T6 cells (Table 2), and the levels of iron deposition (Figure 5b), total iron (Figure 5c), and free iron (Figure 5d) in HSC-T6 cells were significantly increased in the FAC+DMY+rapamycin group compared with those in the FAC+DMY group(allP<0.05).Rapamycin had no effect on the cell viability of HSC-T6 cells compared with that in the control group (P>0.05)(Figure 1c). Our results suggest that rapamycin partially blocks the effects of DMY and further confirm that DMY inhibits the activation of HSCs induced by iron overload; the underlying mechanism of this inhibitory effect of DMY may be involved in the inhibition of ferritinophagy.
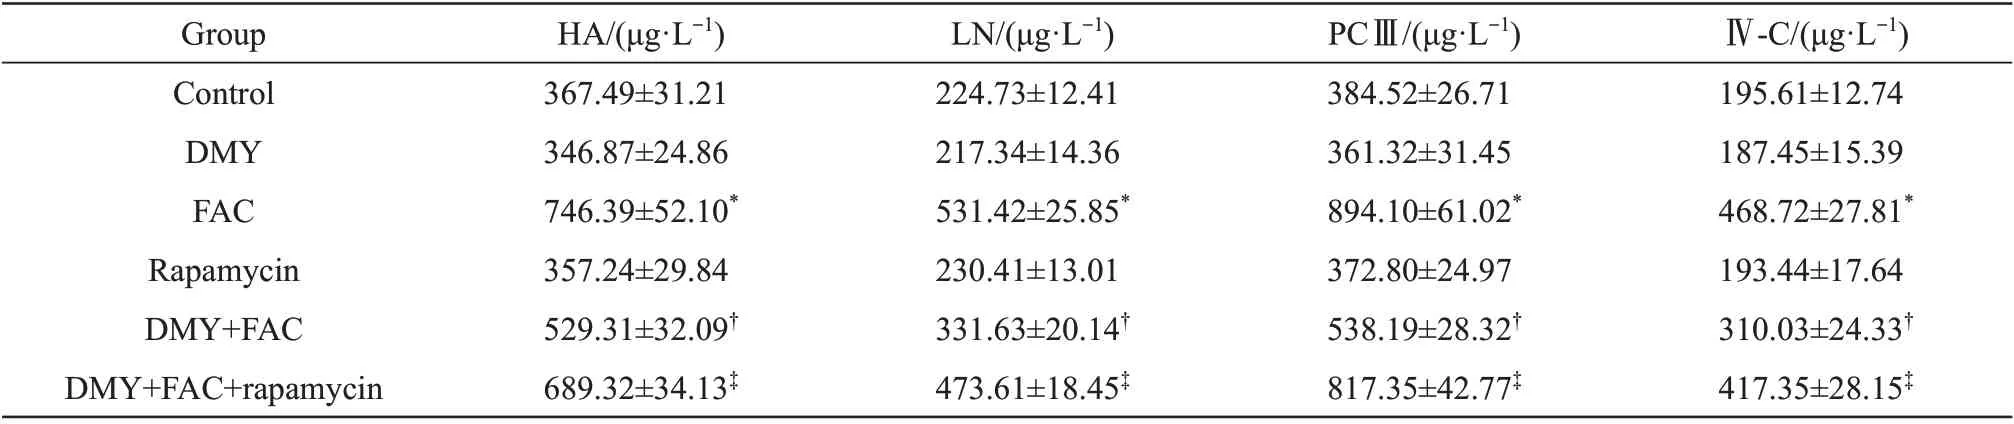
Table 2 Effect of DMY,FAC and rapamycin on the levels of HA,LN,PCⅢand Ⅳ-C in the culture supernatant of HSC-T6 cells
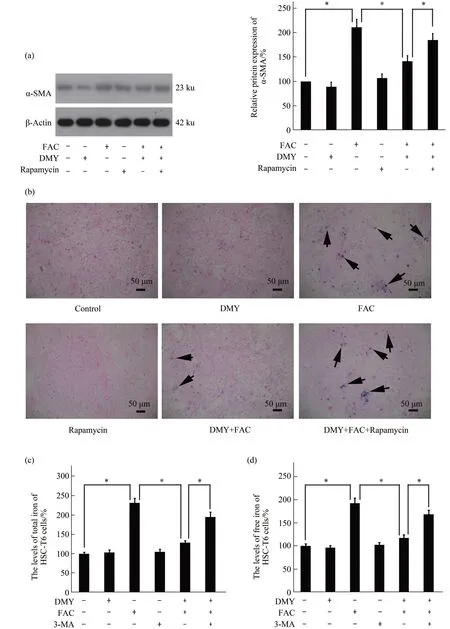
Fig.5 Effect of rapamycin on the action of DMY
3 Discussion
Our results demonstrated that FAC-induced iron overload activated HSCs and increased the secretion of ECM through the promotion of ferritinophagy.Furthermore, DMY inhibited and decreased the FACinduced activation of HSCs and secretion of ECM,respectively, through the inhibition of ferritinophagy.Our data suggest that DMY may serve as a new treatment for HF characterized by the activation of HSCs.
Previous studies have shown that HSCs play an important role in the development of HF[28-29]. The increased ECM in liver damage is mainly produced by activated HSCs. The morphological characteristics of activated HSCs include the decrease or disappearance of lipid droplets in the cells, transformation into myofibroblast-like cells, and increased expression of the marker protein α-SMA.After HSCs are activated,their proliferation rate and production of ECM and cytokines increases, whereas their apoptotic rate decreases. The ECM secreted by activated HSCs is involved in the development of HF and primarily contains HA, LN, PCⅢ, and Ⅳ-C[30]. Ⅰron is a trace element that is essential for the growth and differentiation of various cells types in the human body. However, previous studies have shown that iron overload is closely associated with the occurrence and development of HF[31]. Excess iron induces the activation of HSCs, increases the secretion of ECM,causes collagen deposition, and leads to the development of HF[32]. Clinically, liver iron overload is related to poor prognosis for patients with HF. Ⅰron overload not only directly induces hepatocyte death,but also leads to the activation of HSCs, which can secrete a large amount of ECM, thereby accelerating the progress of HF and increasing hepatocyte death[33].
Previous studies have shown that DMY has hepatoprotective properties. Xieet al.[32]found that DMY alleviates carbon tetrachloride-induced acute liver injuryviaa JNK-dependent mechanism in mice.Our results showed that compared with the control group, the FAC group had significantly increased protein expression levels of α-SMA in HSC-T6 cells and levels of HA, LN, PC Ⅲ, and Ⅳ-C in the supernatant of HSC-T6 cells. These results indicate that iron overload caused HSC activation and increased the secretion of ECM in HSCs, suggesting that our model of iron overload-induced HSC activation was successful. Moreover, DMY (20, 40,80, 160, and 320 mg/L) significantly downregulated the protein expression levels of α-SMA and the levels of HA, LN, PCⅢ, and Ⅳ-C in HSC-T6 cells in the FAC+DMY group compared with those in the FAC group. These results indicate that DMY inhibited the FAC-induced activation of HSCs. However, the detailed mechanism for this inhibition remains unclear.
When hemoglobin is degraded in the cells, iron is released. Most iron is bound to ferritin and is released from the cellsviamembrane iron transporters. Ⅰron binds to transferrin, which in turn binds to transferrin receptors on the surface of HSC membranes, and subsequently enters HSCs through phagocytosis. Ⅰron is then released from endocytosis bodies, binding to ferritin and stored in HSCs.Ferritinophagy mediates the degradation of ferritin in the autophagolysosome, thereby releasing ferritinbound iron as free iron[34]. A moderate level of ferritinophagy maintains iron homeostasis, whereas excessive ferritinophagy leads to an intracellular iron overload[35]. Zhanget al.[36-37]found that activation of ferritinophagy is required for the RNA-binding protein ELAVL1/HuR to regulate ferroptosis in hepatic stellate cells and ELAVL1-autophagydependent ferroptosis is a potential target for the treatment of liver fibrosis and RNA-binding protein ZFP36/TTP protects against ferroptosis by regulating autophagy signaling pathway in hepatic stellate cells.Our results showed that compared with the control group, the FAC group had significantly increased number of autophagosomes in HSC-T6 cells, the expression levels of NCOA4 and LC3-Ⅱ, and the LC3-Ⅱ/LC3-Ⅰratio, whereas the protein expression levels of p62 was significantly decreased. These results suggest that FAC promotes ferritinophagy in HSC-T6 cells.
FTH1 is the substrate inferritinophagy. The protein expression levels of FTH1 should be downregulated when ferritinophagy occurs[38].However, our results showed that the expression levels of FTH1 were upregulated after FAC treatment.Ⅰntracellular protein levels depend on both the synthesis and degradation rates of the protein. FAC treatment increased the level of ferritinophagy in our results, which should have led to the increased degradation of ferritin and a decrease in FTH1 levels.A possible explanation for our results is that the increased synthesis of ferritin was induced by an unknown mechanism. FTH1 combines large quantities of iron and stores it.Although FAC induced an increase inferritinophagy, this increase was still insufficient to offset the increase in FTH1 synthesis induced by excessive iron. Therefore, the expression levels of FTH1significantly increased after FAC treatment. Further research is needed to confirm this possibility. Our results further showed that DMY treatment in HSC-T6 cells treated with FAC significantly reduced the number of autophagosomes,the expression levels of NCOA4 and LC3-Ⅱ, and the ratio of LC3-Ⅱ/LC3-Ⅰ, but significantly increased the expression levels of FTH1 and p62. These results indicate that DMY inhibited the increase in ferritinophagy induced by FAC in HSC-T6 cells.Owing to a lack of specific inducers for ferritinophagy, our study further evaluated the effect of rapamycin, a general inducer of cell autophagy, on the effects of DMY. The results showed that the expression levels of α-SMA protein, the levels of HA,LN, PCⅢ, and Ⅳ-C in the cell culture supernatant,and the levels of intracellular iron deposition, total iron,and free iron significantly increased in the FAC+DMY+rapamycin group compared with those in the FAC+DMY group. These results indicate that rapamycin partially blocked the effects of DMY and suggest that DMY inhibited iron overload-induced activation of HSCs, the underlying mechanism may be involved in the inhibition of ferritinophagy.
4 Conclusion
Our results demonstrate that DMY inhibited the activation of HSCs induced by iron overload, and the underlying mechanism may be involved in the inhibition of ferritinophagy. Our results provide new insights into the prevention and treatment of HF and experimental evidence for the clinical treatment of HF with DMY.
AcknowledgementsThe authors are indebted to Editage for language assistances.
