
基于SPEI和TVDI的河南省干旱时空变化分析
2018-01-09 01:07陈少丹张利平汤柔馨黄勇奇
农业工程学报 2017年24期
陈少丹,张利平,,汤柔馨,杨 凯,黄勇奇
基于SPEI和TVDI的河南省干旱时空变化分析
陈少丹1,张利平1,2※,汤柔馨1,杨 凯2,黄勇奇2
(1. 武汉大学水资源与水电工程科学国家重点实验室,武汉430072; 2. 黄冈师范学院旅游文化与地理科学学院,黄冈438000)
近年来干旱在中国频发且影响不断加剧,因此监测干旱对气候变化、农业生产都有重要意义。基于1961-2016年56年的气象资料,利用标准化降水蒸散指数(SPEI)定量地分析了河南省不同时间尺度(1、3、6和12个月)的干旱发生的时空变化特征和强度;另外采用温度植被干旱指数(TVDI)分析了河南省的区域面积上的干旱空间变化,并探讨了SPEI和TVDI的相关性。结果表明:1961-2016年56 a间,SPEI值在各时间尺度上都呈微弱的湿润化,随着时间尺度的增大,SPEI值波动幅度减小;河南省各地区干旱分布不均匀,发生干旱年的是1961、1965、1966、1968、1972、1976、1978、1981、1986、1988、1997、2001、2013共13年,与实际情况较为一致。在月时间尺度上,SPEI与TVDI的相关性分析表明,SPEI-1与TVDI呈负相关关系,即TVDI越小,SPEI的值越大,干旱程度越轻;TVDI越大,SPEI的值越小,干旱程度越严重。研究结果可为河南省干旱影响评估提供参照标准。
气候变化;干旱;遥感;SPEI;TVDI;MODIS;河南省
0 引 言
干旱是全球最常见、最复杂的自然灾害之一,其发生的频率高、持续时间长、并且影响范围广,对农业生产、自然生态系统和社会经济都造成了巨大的影响[1]。目前对于干旱的监测方法应用最广泛的主要有帕尔默干旱指数(palmer drought severity index,PDSI)、标准化降雨指数(standard precipitation index,SPI)和标准化降雨蒸散指数(standard precipitation evapotranspiration index,SPEI)[2-4]。
PDSI是由Palmer(1965)在水平衡原理的基础上提出的一个气象干旱指数,主要考虑了前期降水、水分供给及潜在蒸散发等因素。然而,PDSI具有固定的时间尺度,不能多尺度反映干旱特征[5]。SPI指数具有多尺度特性且计算简单,能够很好地反映干旱强度及持续时间,缺点是只考虑了降水对干旱的影响,不能反映由于全球变暖导致的温度上升而引起的蒸发量的变化[6]。2010年,Vicente-Serrano等[7]在SPI的基础上,通过引入潜在蒸散,构建了SPEI指数,它融合了PDSI和SPI的优点,不仅考虑了PDSI中干旱对蒸散的响应,而且结合了SPI的计算简单和多时间尺度特征,因此能很好地对干旱进行监测与分析[8-12]。近年来,许多学者也开始采用SPEI进行研究,庄少伟、高蓓等利用SPEI分别研究了中国区域及东北地区近几十年来干旱时空变化特征[9-11],研究结果证明SPEI在该地区有较好的适用性。另外,植被作为联结土壤、大气和水分的自然纽带,也受干旱影响显著[13-14]。随着遥感技术的发展,研究范围从基于站点的观测延展到整个区域,对于站点分布不均并且数据较少的区域提供了干旱计算新的途径,并且可以对大面积干旱进行实时动态的监测。基于温度植被干旱指数(temperature vegetation dryness index,TVDI)的遥感干旱监测模型已在国内很多地方得到了验证[15-17]。MODIS遥感影像具有高的空间分辨率,但由于影像的时间序列较短,因此采用遥感反演技术很难对研究区的干旱演变进行长时间分析。目前单独采用SPEI和TVDI进行干旱监测分析较多,但是同时利用SPEI和TVDI两种指数对干旱进行监测,并且分析两者之间关系的研究较少。基于此,本研究以河南省为研究区域,基于SPEI和TVDI指数,分析了区域干旱多时空尺度演变特征,采用相关分析探讨了上述2种方法描述干旱的差异和相关性,分析了干旱对于植被生长的影响,以期为河南省的干旱监测预警和农业生产提供参考依据。
1 研究区与数据
1.1 研究区概况
河南省位于中国中东部、黄河中下游,界于110°~116°E和31°~36°N之间[8]。研究区属于暖温带-亚热带、湿润-半湿润季风气候,降雨多集中在夏季,常伴有暴雨,年平均降水量约为500~900 mm,南部及西部山地分布较多,尤其大别山区可达1 100 mm以上,降水的时空分布不均,更易受旱涝灾害的影响[18]。
1.2 研究数据
本文采用河南省1961-2016年逐月的气象数据,由中国气象科学数据共享网(http://cdc.cma.gov.cn/home.do)提供,包括降雨量、平均气温、最高气温、最低气温、风速与日照时数等。由于有的站点数据缺失,因此最终选取17个气象站点的数据进行研究,站点的分布见图1。遥感影像数据选用的是美国USGS数据中心(https://lpdaac.usgs.gov/)提供的空间分辨率为1km的植被指数产品MOD13A3 NDVI月合成数据,NDVI月合成主要是通过最大合成法对日数据进行合成得到;地表温度数据是的MOD11A2,其分辨率是1km。然后利用NASA官方网站提供的MRT(MODIS ReProjection Tool)工具对MOD13A3、MOD11A2进行投影与文件格式的转换,投影坐标系为常用的UTM投影,投影带为49。

图1 河南省气象站点分布
2 研究方法
2.1 标准化降雨蒸散指数(SPEI)
SPEI是根据降水量和潜在蒸散发的差值偏离平均状态的程度来计算研究区域的干旱状况[19]。在SPEI计算过程中,潜在蒸散发目前常用的2种方法是Thornthwaite 公式和Penman-Monteith公式[20-22],但由于Thornthwaite公式只是温度的函数,而Penman-Monteith公式不仅考虑了热量因子,也考虑了空气动力因子,因此本文选用Penman-Monteith公式来计算潜在蒸散发,其计算过程不再赘述,详见文献[23-24]。SPEI的计算过程如下:
1)计算逐月的降水与潜在蒸散量的差值,其公式如下

式中D为降水量与潜在蒸散量的差值,P为月降水,PET是根据Penman-Monteith公式计算的月潜在蒸散量,D、P和PET的单位均为mm。
2)计算不同时间尺度的水分盈亏累积序列,本文计算的时间尺度包括1、3、6和12个月。

式中是计算的次数,则是计算的时间尺度。
3)D数据序列进行正态化。采用log-logistic概率密度函数分布对D进行拟合,并求出累计函数

式中和分别是尺度参数、形状参数和起始参数,可通过线性矩的方法计算得到。()是概率密度函数,()是概率分布函数。
4)SPEI值是通过对序列进行标准正态分布转换获得。


其中,常数0=2.515 5,1=0.802 9,2=0.010 3,1= 1.432 8,2=0.189 3,3=0.001 3。
SPEI具有多时间尺度的特征,本研究主要选取1、3、6和12个月的尺度进行分析。按照中国气象局制定的SPEI干旱等级划分标准对河南省的干旱等级进行分析(表1)。

表1 SPEI值干旱等级划分
本文采用干旱频率来评价河南省干旱发生的频繁程度,其计算公式如下
式中为数据序列中干旱发生的次数,为数据的总月份数。文中选用SPEI-3来计算河南省17个气象站干旱的发生频率[8,25]。
2.2 温度植被干旱指数(TVDI)
地表温度(TS)与归一化植被指数(NDVI)之间存在明显的负相关关系,两者的结合能够提供植被生长状况与土壤湿度分布信息[26]。当研究区植被覆盖与土壤湿度变化范围大时,与NDVI的散点图呈三角形分布,在-NDVI的特征空间有很多的等值线,由此提出了温度植被干旱指数(TVDI),其定义为[27-31]

式中min是最低地表温度,℃,max是相同NDVI值条件下最高地表温度,℃。min=1+1·NDVI,对应的是Ts-NDVI特征空间中的湿边,max=2+2·NDVI,称为干边,1、1和2、2分别是湿边和干边的拟合方程的系数。离湿边越接近,TVDI的值越小,干旱程度越轻;相反,越接近于干边,TVDI的值会越大,说明干旱越严重[30]。因此,TVDI的取值介于0~1之间,其表达式如下

3 结果与分析
3.1 干旱的多时间尺度
本研究选用河南省的17个气象站点1961-2016年的逐月气象数据,根据前面介绍的步骤分别对各站点56年的SPEI值进行计算,研究共计算了1、3、6和12个月4种时间尺度,然后对计算得到的17个气象站点的SPEI值进行月平均得到1、3、6和12个月的年际变化特征(图2)。
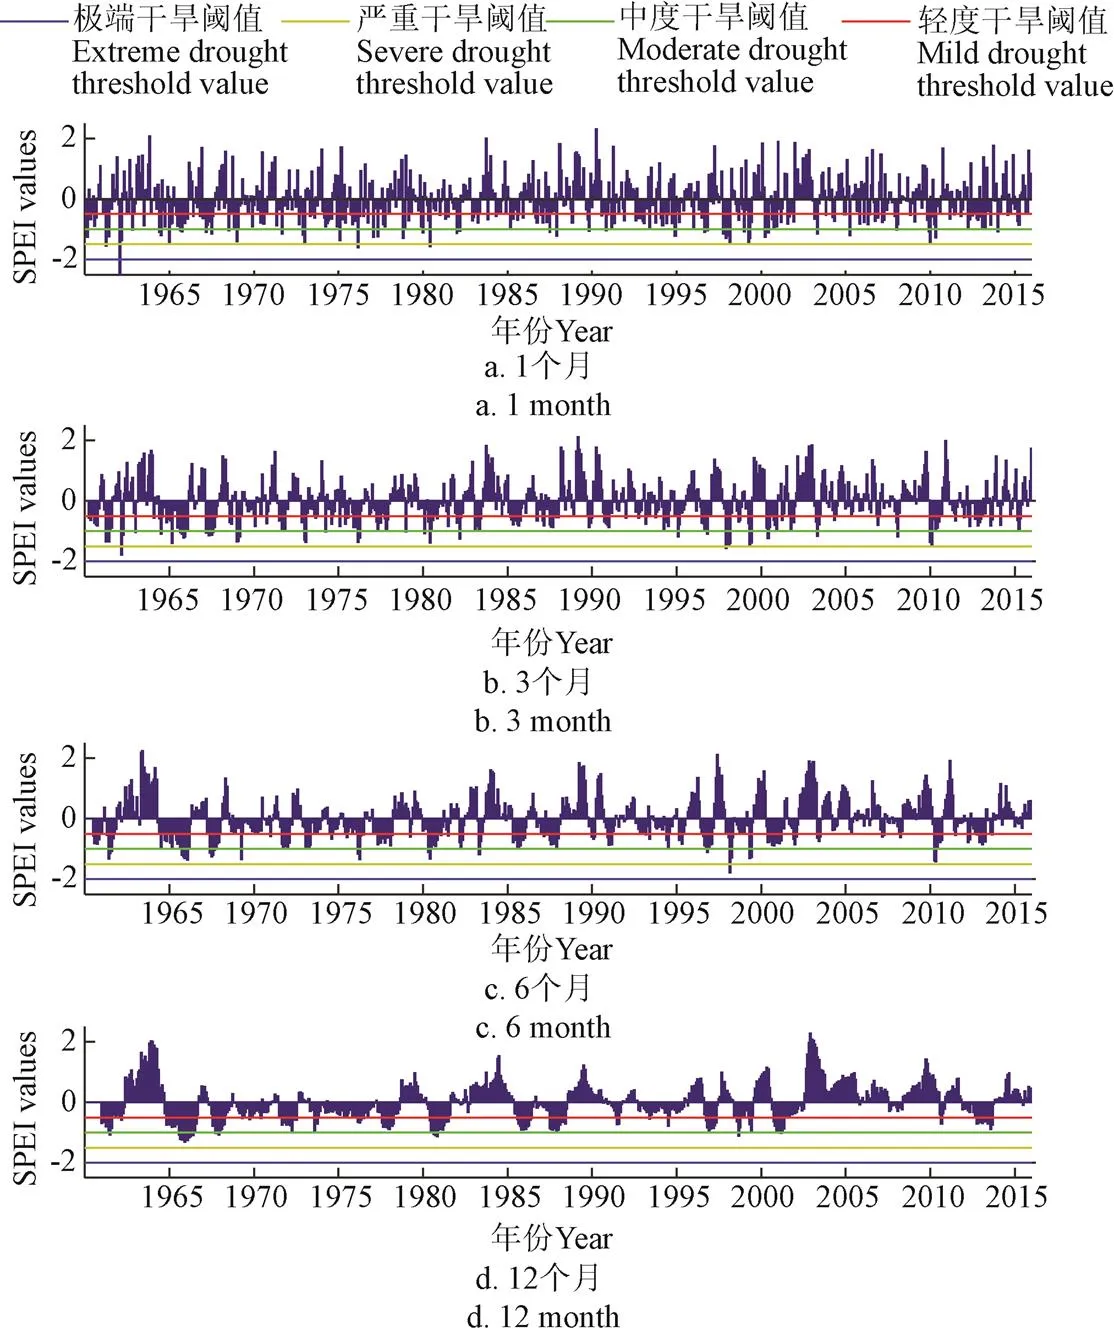
图2 1961-2016年1、3、6和12个月的时间尺度年际变化
从图2中可以看出,随着时间尺度的变大,波动的幅度在减小,SPEI值在各时间尺度上都呈微弱的湿润化。1个月尺度的SPEI值(SPEI-1)波动幅度最大,其次为3个月(SPEI-3)、6个月(SPEI-6),波动幅度最小的是12个月的尺度(SPEI-12)。
为了表示河南省不同年份的干旱事件,本文绘制了各个时间尺度的月等高线图及在图上绘制了相应干旱事件的严重程度等级(图3)。通常SPEI-3的值表示的是季尺度的干旱状况,每年的5、8、11、2月分别代表春、夏、秋、冬的干旱状况。SPEI-6的是半年的干旱状况,每年的10、2月代表的是前半年、后半年的干旱状况。SPEI-12是年干旱状况,12月代表的是年干旱的SPEI值。从图3中可以看出,轻度干旱发生的最为频繁,然后是中度干旱。SPEI-1和SPEI-3反映的是短期的干旱过程,SPEI-6和SPEI-12反映的是中长期的干旱过程。从图3b中SPEI-3中看出发生春旱、夏旱、秋旱和冬旱的年数分别是12、12、13和15年(表2)。从图3d中,SPEI-12中可以看出发生干旱的年份是:1961、1965、1966、1968、1972、1976、1978、1981、1986、1988、1997、2001、2013共13年,与实际情况较为一致。
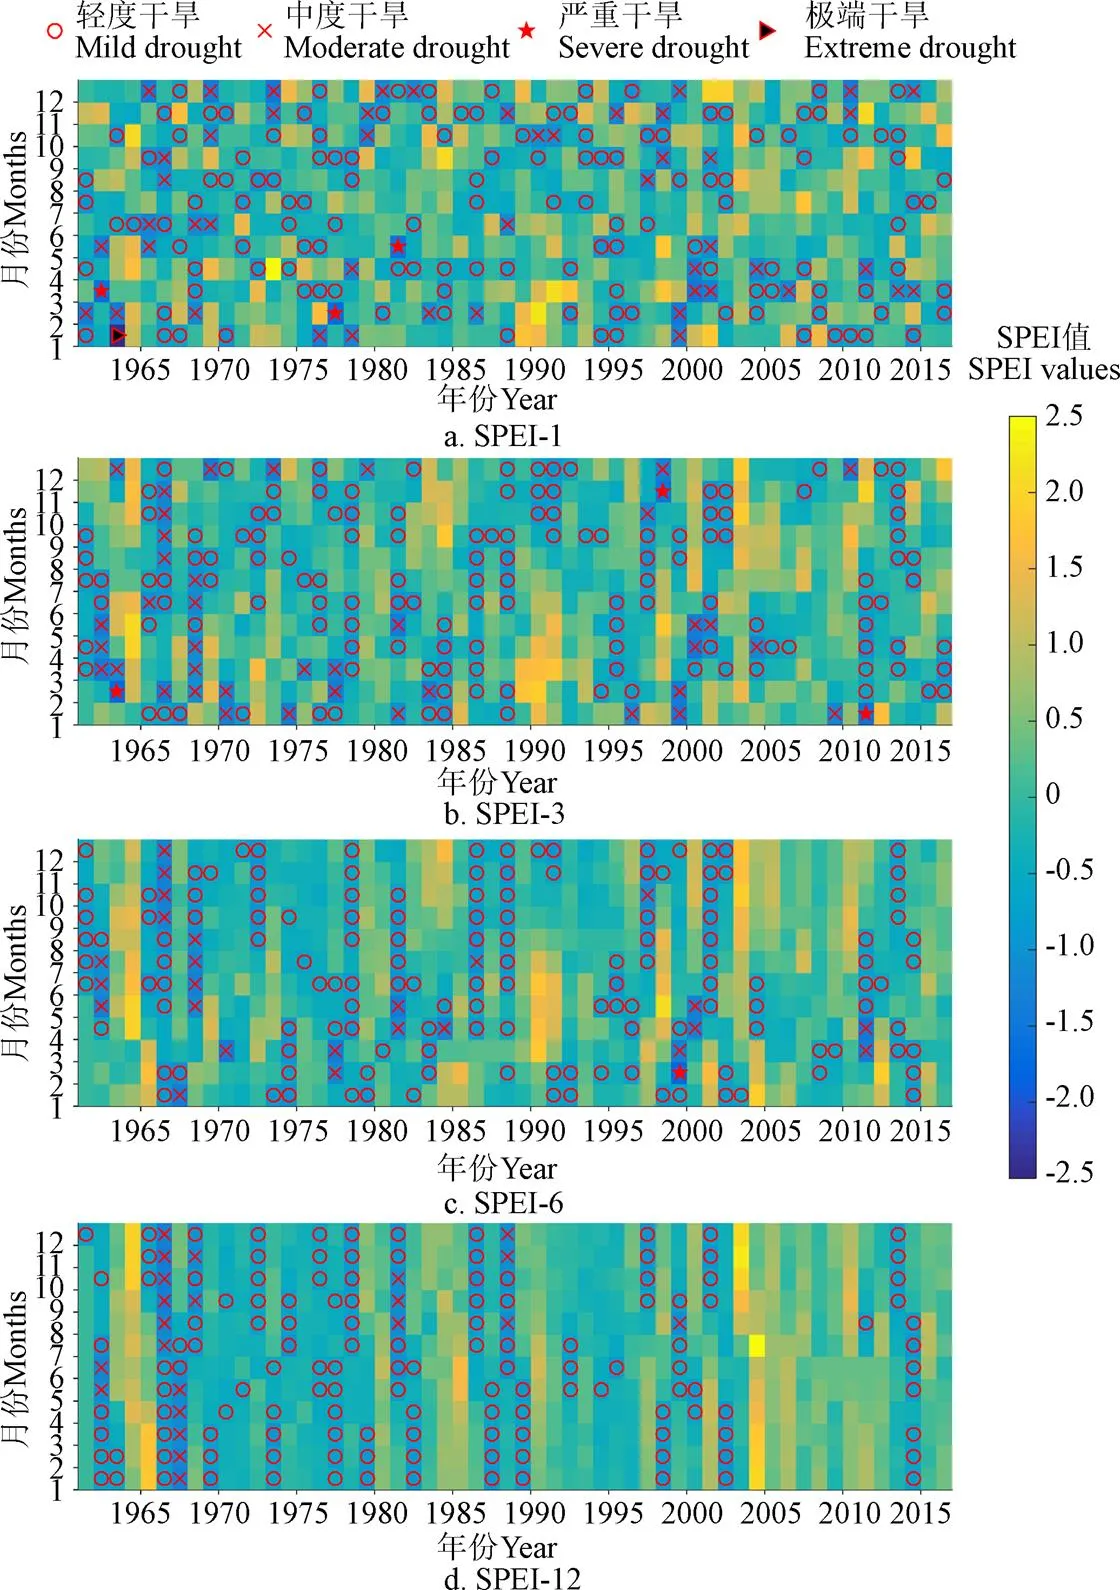
注:SPEI-1、SPEI-3、SPEI-6 与SPEI-12 分别指1、3、6 和12 个月尺度的SPEI指数值。

表2 基于SPEI-3的河南省发生春旱、夏旱、秋旱和冬旱的年份
为分析河南省17个气象站的干旱频率分布特征,根据气象站56 a的SPEI-3值统计出不同等级干旱频率(图4)。从图4中可以看出,轻度干旱发生频率最高,除了西华气象站,其余气象站的轻度干旱发生频率都大于15%;其次是中度干旱,大部分气象站的中度干旱频率都在5%到10%之间;严重干旱和极端干旱的频率较低,基本都在5%以内。56 a来干旱频率最大的地方是郑州(33.10%),共23次;其次是信阳和栾川,分别为32.14%和31.55%,发生频率最小的地方是洛阳和西华,分别为25.10%和25.30%。
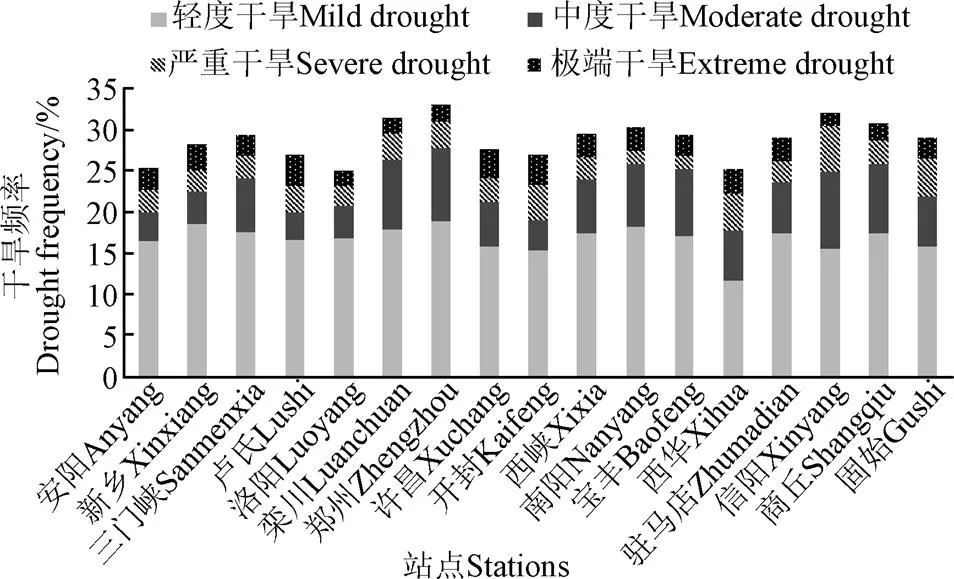
图4 河南省不同等级干旱频率分布特征
3.2 SPEI指数与TVDI的相关性分析
为了研究SPEI与遥感干旱监测的相关性,本文利用MODIS数据产品MOD13A3得到NDVI,时间分辨率为8 d的MOD11A2遥感影像进行月加权平均得到月温度LST数据,根据前面计算方法得到河南省的TVDI分布,以2013年12个月干旱为例,表3表示的是1个月尺度SPEI-1与TVDI每月的相关性,从中可以看出,SPEI-1与TVDI呈负相关关系,即TVDI越小,SPEI-1的值越大,干旱程度越轻;TVDI越大,SPEI-1的值越小,干旱程度越严重。另外,SPEI-1与TVDI的相关性较大,且通过了显著性检验。为了更充分展现SPEI-1与TVDI相关性,对17个气象站点的不同时间也做了相关性分析(表4),从表4中可以看出,同一地点的不同时间中SPEI-1与TVDI也呈现负相关关系,与前面结论一致。TVDI的值介于0~1之间,TVDI的值越小,说明研究区越湿润,其值越大,越干旱,图5中展现了2013年共12个月的河南省干旱状况图,从图5中看出,豫南和豫中发生干旱的频率较高,最低的是豫西地区,从图中可以很清晰地看到河南省干旱的空间和时间变化趋势。

表3 SPEI与TVDI相关性分析

表4 基于不同站点的SPEI与TVDI的相关性

图5 基于TVDI的河南省干旱分布状况
4 讨 论
通过利用SPEI和TVDI对河南省的干旱进行了时空变化分析,且探讨了SPEI和TVDI的相关性。在进行干旱研究中,构建合理的干旱等级标准是一个重要的科学问题,本文统一按照国家干旱等级标准规定的干旱发生等级SPEI值,但是对于农业干旱来说,同一干旱等级,不同时间尺度的SPEI值应存在差异性,其值需用实际受干旱的情况来确定和进行验证。由于存在土壤水分的缓冲作用,短时间尺度的值应该比长时间尺度的值偏高一些,因此,在以后的研究中,需要考虑干旱等级指标的确定问题。
另外,进行SPEI各尺度分析时,要考虑作物的生长季节、作物的耐旱能力,比如冬季,北部地区冬小麦处于越冬期,不存在受干旱影响的问题,但南部不越冬的小麦有可能受旱。所以监测农作物类型的干旱状况可以考虑3个月尺度类型,文中选取的12月的值主要是从年际变化方面来看河南省的干旱变化特征。总体来说,SPEI和TVDI都能够很好地对河南省的干旱状况进行反映。
5 结 论
基于17个气象站点的1961-2016年共56 a的气象数据,利用SPEI定量地分析了河南省不同时间尺度(1、3、6和12个月)的干旱发生的时空变化特征和强度;并采用温度植被干旱指数(TVDI)分析了河南省的区域面积上的干旱空间变化,且探讨了SPEI和TVDI的相关性。得到以下结论:
1)SPEI-1和SPEI-3反映的是短期的干旱过程,SPEI-6和SPEI-12反映的是中长期的干旱过程,不同时间尺度SPEI的值波动规律不同,尺度越小,波动的幅度就越大,根据SPEI值的时间尺度的干旱发生状况可以看出,在季尺度上,冬旱的发生年数比较多,共15次,在年尺度上,发生干旱的年份是:1961、1965、1966、1968、1972、1976、1978、1981、1986、1988、1997、2001、2013共13年,与实际情况较为一致。
2)在干旱发生强度上,56 a来发生干旱次数最多的地区是郑州,共23次;发生次数最少的分别是西华和洛阳,共12次,河南是极易发生干旱的省份。
3)根据SPEI月尺度与遥感干旱监测方法进行相关性研究发现,两者之间呈现负相关关系,即TVDI越小,SPEI-1的值越大,干旱程度越轻;TVDI越大,SPEI-1的值越小,干旱程越严重,且通过了显著性检验,说明SPEI-1与TVDI的相关性较大,也为进一步研究气象干旱指数与遥感监测两者结合之间提供了思路。SPEI虽然考虑的因素较多,但是,干旱易受地形以及人类活动等的影响[32],因此针对此方法的研究还有待进一步的深入。
[1] 王兆礼,黄泽勤,李军,等. 基于SPEI和NDVI的中国流域尺度气象干旱及植被分布时空演变[J]. 农业工程学报,2016,32(14):177-186.
Wang Zhaoli, Huang Zeqin, Li Jun, et al. Assessing impacts of meteorological drought on vegetation at catchment scale in China based on SPEI and NDVI[J]. Transactions of the Chinese Society of Agricultural Engineering (Transactions of the CSAE), 2016, 32(14): 177-186. (in Chinese with English abstract)
[2] Benitez J B, Domecq R M. Analysis of meteorological drought episodes in Paraguay[J]. Climatic Change, 2014, 127(1): 15-25.
[3] Mishra A K, Singh V P. Drought modeling: A review[J]. Journal of Hydrology, 2011, 403(1/2): 157-175.
[4] Wang Qianfeng, Shi Peijun, Lei Tianjie, et al. The alleviating trend of drought in the Huang-Huai-Hai Plain of China based on the daily SPEI[J]. International Journal of Climatology, 2015, 35(13): 3760-3769.
[5] Palmer W. Meteorological drought[Z]. U.S. Department of Commerce Weather Bureau Research Paper, 1965.
[6] Stagge J H, Kohn I, Tallaksen L M, et al. Modeling drought impact occurrence based on meteorological drought indices in Europe[J]. Journal of Hydrology, 2015, 530: 37-50.
[7] Vicente-Serrano S M, Begueria S, Lopez-Moreno J I. A multiscalar drought index sensitive to global warming: The standardized precipitation evapotranspiration index[J]. Journal of Climate, 2010, 23(7): 1696-1718.
[8] 史本林,朱新玉,胡云川,等. 基于SPEI指数的近53年河南省干旱时空变化特征[J]. 地理研究,2015,34(8):1547-1558.
Shi Benlin, Zhu Xinyu, Hu Yunchuan, et al. Spatial and temporal variations of drought in Henan province over a 53-year period based on standardized precipitation evapotranspiration index[J]. Geographical Research, 2015, 34(8): 1547-1558. (in Chinese with English abstract)
[9] 庄少伟. 基于标准化降水蒸发指数的中国区域干旱化特征分析[D]. 兰州:兰州大学,2013.
Zhuang Shaowei. Drought Characteristics in the Regions of China Based on the Standardized Precipitation Evapotranspiration Index[D]. Lanzhou: Lanzhou University, 2013. (in Chinese with English abstract)
[10] 高蓓,姜彤,苏布达,等. 基于SPEI的1961-2012年东北地区干旱演变特征分析[J]. 中国农业气象,2014,35(6):656-662.
Gao Bei, Jiang Tong, Su Buda, et al. Evolution analysis on droughts in northeast China during 1961-2012 based on SPEI[J]. Chinese Journal of Agrometeorology, 2014, 35(6): 656-662. (in Chinese with English abstract)
[11] 孙滨峰,赵红,王效科. 基于标准化降水蒸发指数(SPEI)的东北干旱时空特征[J]. 生态环境学报,2015,24(1):22-28.
Sun Binfeng, Zhao Hong, Wang Xiaoke. Spatiotemporal characteristics of drought in Northeast China based on SPEI[J]. Ecology and Environment Sciences, 2015, 24(1): 22-28. (in Chinese with English abstract)
[12] Potop V, Boroneant C, Mozny M, et al. Observed spatiotemporal characteristics of drought on various time scales over the Czech Republic[J]. Theoretical and Applied Climatology, 2014, 115(3/4): 563-581.
[13] 严建武,陈报章,房世峰,等. 植被指数对旱灾的响应研究:以中国西南地区2009年-2010年特大干旱为例[J]. 遥感学报,2012,16(4):720-737.
Yan Jianwu, Chen Baozhang, Fang Shifeng, et al. The response of vegetation index to drought: Taking the extreme drought disaster between 2009 and 2010 in Southwest China as an example[J]. Journal of Remote Sensing, 2012, 16(4): 720-737. (in Chinese with English abstract)
[14] 王鹏新,孙威. 基于植被指数和地表温度的干旱监测方法的对比分析[J]. 北京师范大学学报:自然科学版,2007,43(3):319-323.
Wang Pengxin, Sun Wei. Comparison study on NDVI and LST based drought monitoring approaches[J]. Journal of Beijing Normal University: Natural Science, 2007, 43(3): 319-323. (in Chinese with English abstract)
[15] Li Zhengguo, Wang Yanglin, Zhou Qingbo, et al. Spatiotemporal variability of land surface moisture based on vegetation and temperature characteristics in Northern Shaanxi Loess Plateau, China[J]. Journal of Arid Environments, 2008, 72(6): 974-985.
[16] Wang C Y, Qi S H, Niu Z, et al. Evaluating soil moisture status in China using the temperature-vegetation dryness index (TVDI)[J]. Canadian Journal of Remote Sensing, 2004, 30(5): 671-679.
[17] 赵杰鹏,张显峰,廖春华,等. 基于TVDI的大范围干旱区土壤水分遥感反演模型研究[J]. 遥感技术与应用,2011,26(6):742-750.
Zhao Jiepeng, Zhang Xianfeng, Liao Chunhua, et al. TVDI based soil moisture retrieval from remotely sensed data over large areas[J]. Remote Sensing Technology and Application, 2011, 26(6): 742-750. (in Chinese with English abstract)
[18] 余卫东,柳俊高,常军,等. 1957-2005年河南省降水和温度极端事件变化[J]. 气候变化研究进展,2008,4(2):78-83.
Yu Weidong, Liu Jungao, Chang Jun, et al. Changes in extreme temperature and precipitation in Henan province during 1957-2005[J]. Advances in Climate Change Research, 2008, 4(2): 78-83. (in Chinese with English abstract)
[19] 陈斐,杨沈斌,王春玲,等. 基于SPEI指数的西北地区春旱时空分布特征[J]. 干旱气象,2016,34(1):34-42.
Chen Fei, Yang Shenbin, Wang Chunling, et al. Spatial and temporal distribution of spring drought in Northwest China based on standardized precipitation evapotranspiration index[J]. Journal of Arid Meteorology, 2016, 34(1): 34-42. (in Chinese with English abstract)
[20] 刘珂,姜大膀. 基于两种潜在蒸散发算法的SPEI对中国干湿变化的分析[J]. 大气科学,2015,39(1):23-36.
Liu Ke, Jiang Dapang. Analysis of dryness/wetness over China using standardized precipitation evapotranspiration index based on two evapotranspiration[J]. Journal of Atmospheric Sciences, 2015, 39(1): 23-36. (in Chinese with English abstract)
[21] Monteith J L. Evaporation and environment[J]. Symp Soc Exp Biol, 1965, 19: 205-234.
[22] Thornthwaite C W. An Approach toward a Rational Classification of Climate[J]. Geographical Review, 1948, 38(1): 55-94.
[23] 丁加丽,彭世彰,徐俊增,等. 基于Penman-Monteith方程的节水灌溉稻田蒸散量模型[J]. 农业工程学报,2010,26(4):31-35.
Ding Jiali, Peng Shizhang, Xu Junzeng, et al. Estimation of rice evapotranspiration under controlled irrigation by using Penman-Monteith method[J]. Transactions of the Chinese Society of Agricultural Engineering (Transactions of the CSAE), 2010, 26(4): 31-35. (in Chinese with English abstract)
[24] 焦醒,刘广全,匡尚富,等. Penman-Monteith模型在森林植被蒸散研究中的应用[J]. 水利学报,2010,41(2):245-252.
Jiao Xing, Liu Guangquan, Kuang Shangfu, et al. Review on application of Penman-Monteith Equation to studying forest vegetation evapotranspiration[J]. Journal of Hydraulic Engineering, 2010, 41(2): 245-252. (in Chinese with English abstract)
[25] 赵林, 于家烁, 薄岩, 等. 基于SPEI的湖北省近52年干旱时空格局变化[J]. 长江流域资源与环境, 2015, 24(7) :1230-1237.
Zhao Lin, Yu Jiashuo, Bo Yan, et al. Temporal and spatial distribution of drought in Hubei province during 1961-2012 based on SPEI[J]. Resources and Environment in the Yangtze Basin, 2015, 24(7):1230-1237. (in Chinese with English abstract)
[26] 齐述华,王长耀,牛铮. 利用温度植被旱情指数(TVDI)进行全国旱情监测研究[J]. 遥感学报,2003,7(5):420-427.
Qi Shuhua, Wang Changyao, Niu Zheng. Evaluating soil moisture status in China using the temperature/vegetation dryness index (TVDI)[J]. Journal of Remote Sensing, 2003, 7(5): 420-427. (in Chinese with English abstract)
[27] Patel N R, Anapashsha R, Kumar S, et al. Assessing potential of MODIS derived temperature/vegetation condition index (TVDI) to infer soil moisture status[J]. International Journal of Remote Sensing, 2009, 30(1): 23-39.
[28] Sandholt I, Rasmussen K, Andersen J. A simple interpretation of the surface temperature/vegetation index space for assessment of surface moisture status[J]. Remote Sensing of Environment, 2002, 79(2/3): 213-224.
[29] 范辽生,姜纪红,盛晖,等. 利用温度植被干旱指数(TVDI)方法反演杭州伏旱期土壤水分[J]. 中国农业气象,2009,30(2):230-234.
Fan Liaosheng, Jiang Jihong, Sheng Hui, et al. Reverse of soil moisture for summer drought period in Hangzhou by using TVDI method[J]. Chinese Journal of Agrometeorology, 2009, 30(2): 230-234. (in Chinese with English abstract)
[30] 杜灵通,侯静,胡悦,等. 基于遥感温度植被干旱指数的宁夏2000-2010年旱情变化特征[J]. 农业工程学报,2015,31(14):209-216.
Du Lingtong, Hou Jing, Hu Yue, et al. Drought variation characteristics in Ningxia from 2000 to 2010 based on temperature vegetation dryness index by remote sensing[J]. Transactions of the Chinese Society of Agricultural Engineering (Transactions of the CSAE), 2015, 31(14): 209-216. (in Chinese with English abstract)
[31] 鲍艳松,严婧,闵锦忠,等. 基于温度植被干旱指数的江苏淮北地区农业旱情监测[J]. 农业工程学报,2014,30(7):163-172.
Bao Yansong, Yan Jing, Min Jinzhong, et al. Agricultural drought monitoring in north Jiangsu by using temperature vegetation dryness index[J]. Transactions of the Chinese Society of Agricultural Engineering (Transactions of the CSAE), 2014, 30(7): 163-172. (in Chinese with English abstract)
[32] 王随继,闫云霞,颜明,等. 皇甫川流域降水和人类活动对径流量变化的贡献率分析——累积量斜率变化率比较方法的提出及应用[J]. 地理学报,2012,67(3):388-397.
Wang Suiji, Yan Yunxia, Yan Ming, et al. Contributions of precipitation and human activities to the runoff change of the Huangfuchuan drainage basin: Application of comparative method of the slope changing ratio of cumulative quantity[J]. Acta Geographica Sinica, 2012, 67(3): 388-397. (in Chinese with English abstract)
Analysis on temporal and spatial variation of drought in Henan Province based on SPEI and TVDI
Chen Shaodan1, Zhang Liping1,2※, Tang Rouxin1, Yang Kai2, Huang Yongqi2
(1.,,430072,;2.,,438000,)
In the context of global warming, drought is the most complex and damaging natural disaster, which becomes more and more frequent, causing negative impacts on agriculture, water resources, natural ecosystems, and society activities. There are several kinds of drought indices derived from station-based meteorological data that are widely used for monitoring drought evolution, mainly including the Palmer drought severity index (PDSI), the standardized precipitation index (SPI) and the standardized precipitation evapotranspiration index (SPEI). The SPEI not only considers precipitation and temperature data, but also integrates the sensitivity of PDSI to changes in evaporation demand and the simplicity of calculation and the multi-scale features of the SPI that identify different types of drought. Therefore, the SPEI was used to describe the drought severity determined by the difference between precipitation and potential evapotranspiration, based on the monthly meteorological data from 1961 to 2016 in Henan Province. And the regional SPEI was obtained at different time scales (1-, 3-, 6-, and 12-month) to characterize the dry or wet conditions in the study area. And the 1-month SPEI can clearly see the subtle changes of drought occurrence and reflect a short-term condition; the 3-month SPEI provides the seasonal drought occurrence; the 12-month SPEI reflects the drought variation at inter-annual time scales. In addition, the remote sensing method, which can provide large coverage, and multispectral and multitemporal observations from satellite sensors at various scales, is another method used to monitor drought conditions on a regional scale, especially in the areas with few meteorological stations. Numerous studies have suggested that a combination of surface temperature, normalized difference vegetation index (NDVI) and land surface temperature (LST) can reveal information on the regional drought conditions. Here, the temperature vegetation dryness index (TVDI) based on the interpretation of the simplified NDVI-LST space for estimating drought conditions was selected to monitor drought conditions on a regional scale, and the moderate resolution imaging spectroradiometer (MODIS) was used, which has many advanced characteristics such as wide spectral range, high temporal resolution and low cost. And the correlation between SPEI and TVDI was calculated. The results showed that SPEI was increasing slightly at different time scales during the period of 1961–2016, indicating that Henan was getting more humid. As the time scale increased, the amplitude of the SPEI decreased. However, the distribution in Henan has been uneven. Annually, droughts occurred in 1961, 1965, 1966, 1968, 1972, 1976, 1978, 1981, 1986, 1988, 1997, 2001 and 2013. Moreover, drought frequency was selected to calculate the probability of drought occurrence. During the period of 1961-2016, Zhengzhou had the highest frequency (33.10%), followed by Xinyang and Luanchuan (32.14% and 31.55%, respectively), whereas Luoyang and Xihua had the lowest frequency (25.10% and 25.30%, respectively). Correlation analysis between monthly TVDI and SPEI showed that there existed negative relationship between 1-month SPEI and TVDI, and as TVDI got smaller, SPEI became higher, reflecting that the severity of drought was lighter, and conversely drought would aggravate as TVDI got larger and SPEI became lower. Therefore, our study on the relationship between SPEI and TVDI can provide a scientific basis for early warning and risk management of water resources and agricultural production.
climate changing; drought; remote sensing; SPEI; TVDI; MODIS; Henan province
10.11975/j.issn.1002-6819.2017.24.017
S127
A
1002-6819(2017)-24-0126-07
2017-07-03
2017-12-08
国家自然科学基金项目(51339004);国家重点研发计划项目(2017YFA0603704);湖北省科技计划项目(2015BCA290)
陈少丹,博士生,主要从事水文水资源研究。 Email:chensd2014@163.com
张利平,教授,博士生导师,主要从事变化环境下水资源与气候变化研究。Email:zhanglp@whu.edu.cn
陈少丹,张利平,汤柔馨,杨 凯,黄勇奇. 基于SPEI和TVDI的河南省干旱时空变化分析[J]. 农业工程学报,2017,33(24):126-132. doi:10.11975/j.issn.1002-6819.2017.24.017 http://www.tcsae.org
Chen Shaodan, Zhang Liping, Tang Rouxin, Yang Kai, Huang Yongqi. Analysis on temporal and spatial variation of drought in Henan Province based on SPEI and TVDI[J]. Transactions of the Chinese Society of Agricultural Engineering (Transactions of the CSAE), 2017, 33(24): 126-132. (in Chinese with English abstract) doi:10.11975/j.issn.1002-6819.2017.24.017 http://www.tcsae.org
猜你喜欢
环球时报(2022-05-05)2022-05-05
四川党的建设(2022年8期)2022-04-28
数学物理学报(2021年6期)2021-12-21
力学学报(2021年7期)2021-11-09
能源工程(2021年1期)2021-04-13
小学生学习指导(低年级)(2020年11期)2020-12-14
苏州科技大学学报(自然科学版)(2020年1期)2020-04-13
趣味(语文)(2019年3期)2019-06-12
作文大王·低年级(2018年10期)2018-12-06
小猕猴智力画刊(2016年5期)2016-05-14
