
线扫描式拉曼高光谱成像技术无损检测奶粉三聚氰胺
2018-01-09 01:22杨桂燕王庆艳黄文倩王晓彬陈立平
农业工程学报 2017年24期
刘 宸,杨桂燕,王庆艳,黄文倩,王晓彬,陈立平
线扫描式拉曼高光谱成像技术无损检测奶粉三聚氰胺
刘 宸1,2,3,4,杨桂燕2,3,4,王庆艳2,3,4,黄文倩2,3,4,王晓彬2,3,4,陈立平1,2,3,4※
(1. 西北农林科技大学机械与电子工程学院,杨凌 712100;2. 国家农业智能装备工程技术研究中心,北京 100097; 3. 农业部农业信息技术重点实验室,北京 100097;4. 农业智能装备技术北京市重点实验室,北京 100097)
为了实现颗粒状样本的大面积无损快速检测,该研究结合拉曼光谱和高光谱技术搭建了一套线扫描式拉曼高光谱检测系统,对奶粉和三聚氰胺颗粒混合样本进行了检测研究。研究通过高斯窗平滑法和airPLS基线校正方法分别消除了拉曼光谱中的噪声信号和荧光背景,选取三聚氰胺主要特征峰(671.71 cm-1)处的单波段图像作为是否含有三聚氰胺颗粒的判断依据。研究首先对三聚氰胺产生的拉曼信号在奶粉颗粒中的穿透深度进行了检测,随后完成了10种不同浓度的三聚氰胺奶粉混合样本的拉曼高光谱采集,对特征单波段图像中各像素点的拉曼强度平均值进行一元线性分析,并对单波段图像进行二值化处理。结果显示,在三聚氰胺特征单波段图像中,感兴趣区域内所有像素点的拉曼强度平均值与三聚氰胺浓度之间线性度较高,其决定系数2达到了0.995 4。在二值图像中,三聚氰胺颗粒的位置信息能够直观的展现。研究结果表明,拉曼高光谱成像技术具有快速、无损和大面积检测的特点,在实际应用中具有巨大潜力。
无损检测;图像处理;光谱分析;拉曼光谱;高光谱成像技术;线扫描式;脱脂奶粉;三聚氰胺
0 引 言
三聚氰胺属于化工原料,是食品非法添加剂的一种,用来虚拟提升奶粉或饲料中的蛋白质含量指标[1]。目前,国内外学者应用高效液相色谱法(HPLC)和表面增强拉曼光谱法(SERS)均实现了奶粉中的三聚氰胺的快速检测[2-5]。但在这2种方法中,奶粉样本都需要先局部取样,再转化成液态形式方能进行下一步操作,检测过程中还需借助一些化学分析纯或增强试剂[6-8]。这2种常用的检测方法均影响了奶粉颗粒的使用性能,属于破坏性检测。此外,经此2种方法得出的检测结果只能代表局部取样的平均情况,无法反映整体样本的浓度信息和三聚氰胺颗粒的具体分布。颗粒状样本与液态样本不同,三聚氰胺颗粒在奶粉中的分布可能并不均匀,局部采样的单点检测方式结果并不准确。拉曼光谱作为一种散射光谱在无损检测方面具有一定优势[9-11]。高光谱成像技术不仅可以获得样本的图像信息,图像中每个像素点均包含了一条完整的光谱谱线。在食品的品质安全检测中,高光谱成像技术已经应用于果蔬、肉制品、乳制品等多个领域,常用来展示样本中某一特定成分的空间分布信息[12-15]。因此,结合拉曼光谱和高光谱成像技术有望实现对奶粉样本的大面积直接检测。目前,Dhakal等对点扫描式拉曼高光谱检测中颗粒状样本的最优厚度进行了研究,结果显示三聚氰胺的拉曼信号能穿透至多3 mm厚度的淀粉颗粒,在面粉颗粒中的穿透深度最高为1 mm,在奶粉颗粒中的穿透深度尚不明确[16]。Qin等分别选取点扫描式和线扫描式,结合拉曼光谱和高光谱成像技术对奶粉中的几种非法添加剂检测进行了相关研究[17-18]。结果表明采用点扫描式的二值图像中,识别为添加剂的像素点的个数与添加剂的浓度呈明显线性关系,而在线扫描方式中,二者之间的关系尚不明确。点扫描式的扫描方式需要花费大量时间,无法实现样本的现场快速检测[19]。因此,本研究搭建了一套线扫描式拉曼高光谱成像系统,针对奶粉中三聚氰胺颗粒的检测优化试验参数,探索拉曼高光谱图像与三聚氰胺颗粒之间的关系,用以实现大面积混合样本的快速无损检测。
1 材料与方法
1.1 线扫描拉曼高光谱成像系统
线扫描拉曼高光谱成像系统由拉曼成像光谱仪(ImSpector R10E,Specim,Finland)、线阵CCD相机(iKon-M 934,Andor Technology plc.,N. Ireland)、一字线激光器(innovative photonic solutions,USA)、成像镜头、二向色镜及滤光片、样品升降台、移动轨道、步进电机、电源以及计算机组成,如图1所示。拉曼成像光谱仪的采集范围是770~980 nm(−261~2539 cm-1),光谱分辨率是0.6 nm,线阵CCD相机的分辨率是512× 1 024 pixels,系统空间分辨率是0.25 mm/pixel。线激光的波长为785 nm,空间线宽2 mm,张角为31°[20]。线激光由半导体激光器产生,具有体积小、寿命长的特点,此外可以有效抑制奶粉产生的荧光背景。采集时线激光通过二向色镜反射到样本表面,线阵CCD相机采集狭缝范围内样本的高光谱图像,然后通过电动位移台水平移动完成整个样本的扫描。

图1 拉曼高光谱成像系统原理图
1.2 样本制备
试验用奶粉共3种,分为全脂奶粉(全脂奶粉,伊利)、低脂奶粉(学生高锌高钙奶粉,伊利)和脱脂奶粉(高蛋白脱脂高钙奶粉,伊利),均购买于北京超市发超市;三聚氰胺分析纯(99%)来自上海晶纯生化科技股份有限公司。
在奶粉样本最佳厚度的试验中,研究制备如图2a所示的双层样本。双层样本上半部为1—5个铝环厚度的奶粉层,高度从1.0 mm至5.0 mm可调,其中铝环尺寸为外径40 mm,内径28 mm;下半部为装满三聚氰胺的培养皿,高度为5.0 mm,培养皿直径35 mm。检测时首先放置5个铝环厚度的奶粉颗粒进行高光谱采集,然后依次去除1个铝环厚度的奶粉层,每次奶粉层的上表面沿铝环外围刮平,重复此步骤直至铝环全部移除完成一组采集。试验依照此流程分别选取全脂奶粉、低脂奶粉和脱脂奶粉填充奶粉层,共完成了3组检测。
在三聚氰胺浓度检测试验中,为了减少脂肪含量的影响,试验选取脱脂奶粉制备不同浓度的三聚氰胺奶粉混合样本共10份,每份10 g,质量浓度范围从0.01%至2.00%。制备过程中先在电子天平上分别称量每份样本所需质量的脱脂奶粉颗粒和三聚氰胺颗粒,随即倒入50 mL离心管中,将离心管放置于旋涡振荡器上运行20 min至二者充分混合,混合均匀后将离心管放置于试管架上。此外,脱脂奶粉和三聚氰胺的纯物质样本也经相同过程制备。在图像采集时,将混合样本颗粒填满于如图2b中的铝合金容器中,沿容器上边面进行刮平。该容器的外部尺寸为100 mm×55 mm×10 mm,内部的凹陷部分尺寸为90 mm×45 mm×2 mm。试验中相同浓度的混合样本重复取样共采集3次。根据之前的试验结果,试验参数设置为激光强度100 mW,曝光时间1 000 ms。

图2 样本制备示意图
1.3 高光谱图像预处理
在采集的高光谱图像中,研究首先进行感兴趣区域选取。在奶粉颗粒样本最佳厚度的试验中,研究选取铝环中心点附近面积为15 mm×15 mm区域作为感兴趣区域,该区域包含60 pixels×60 pixels共3 600个像素点。在三聚氰胺浓度检测试验中,研究从铝合金容器中心区域选取40 mm×80 mm面积范围作为感兴趣区域,该面积内包含160 pixels×320 pixels共51 200个像素点。对于感兴趣区域内每个像素点的拉曼光谱,研究首先采用高斯窗平滑法消除噪声信号,然后采用airPLS基线校正法消除荧光背景[21-24]。预处理后,研究挑选三聚氰胺的特征单波段图像,统计所有像素点的拉曼强度平均值并进行一元线性分析,通过二值化法获取了相应的二值图像[25-26]。高光谱图像的预处理过程在ENVI 5.2(Exelis Visual Information Solutions,Boulder, CO, USA)软件和MATLAB(R2014a, Math Works, Natick, MA, USA)软件中完成。
2 结果与分析
2.1 三聚氰胺的拉曼光谱分析
脱脂奶粉和三聚氰胺纯物质的平均拉曼光谱如图3所示,图中光谱均为纯物质样本感兴趣区域(40 mm× 80 mm)内51 200个像素点的平均光谱。

图3 三聚氰胺纯物质和脱脂奶粉的平均拉曼光谱图
在预处理后的校正光谱中,三聚氰胺主要的拉曼特征峰分别在577.93、671.71、979.01、1 440.82和1 553.86 cm-1位移处。其中577.93和979.01 cm-1处的拉曼特征峰分别由C-N-C键的弯曲振动和对称伸缩振动引起[27];1 440.82和1 553.86 cm-1处拉曼特征峰的由C=N键的伸缩振动以及N-H键的弯曲振动引起;在671.71 cm-1处的为最强拉曼特征峰,形成原因是三嗪环的剪式振动[28-29]。由于脱脂奶粉在671.71 cm-1处并没有明显的特征峰存在,因此研究选取671.71 cm-1位移处的特征单波段图像作为是否能够检测到三聚氰胺颗粒的判断依据。
图4以三聚氰胺1.00%浓度时混合样本的采集结果为例,对特征单波段图像的处理过程进行说明。在671.71 cm-1处的原始图像中,由于受到荧光背景的干扰,每个像素点之间的拉曼强度值差异并不明显。经过光谱预处理后,校正图像中部分像素点的亮度较高,说明该像素点区域含有三聚氰胺颗粒。此时选取纯奶粉样本在671.71 cm-1处出现的最大值作为阈值,对图像进行二值化处理,所获二值图像中含有三聚氰胺颗粒的像素点能够更清晰的展现。研究依照此方法对采集的每张拉曼高光谱图像进行图像处理。
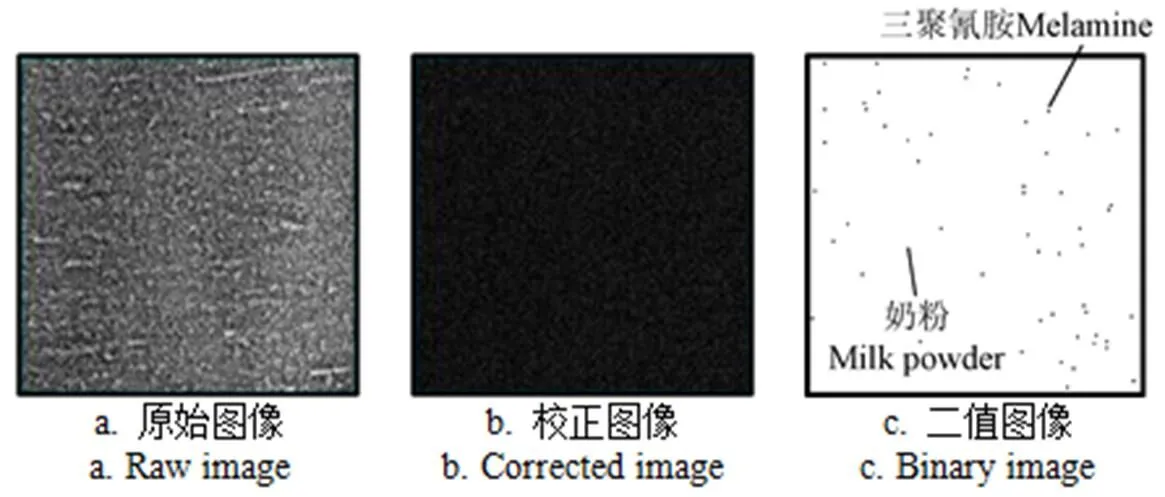
图4 三聚氰胺浓度为1.00%时特征单波段图像的荧光校正和二值化处理结果
2.2 三聚氰胺的拉曼信号在奶粉层中的穿透深度分析
在颗粒状样本的高光谱图像采集中,保证光能穿透整个样本厚度是十分必要的[30]。上节已经得出三聚氰胺的最强拉曼特征峰出现在671.71 cm-1处,为了降低奶粉中三聚氰胺颗粒的检测限,在穿透深度试验中研究依然以671.71 cm-1处的拉曼信号强度作为是否能够采集到底层三聚氰胺产生拉曼信号的判定依据。在穿透深度检测结果中,不同奶粉层厚度下校正图像内的拉曼光谱平均值如图5所示。
图5中可以看出,三聚氰胺纯物质在671.71 cm-1处的拉曼强度值均为最大,随着奶粉层厚度的增加,可采集到的拉曼信号强度逐渐变小。当奶粉层厚度为5 mm时,3组中671.71 cm-1处仍存在微弱的拉曼特征峰,说明三聚氰胺产生的拉曼信号均能穿透5 mm厚度的3种奶粉层颗粒。通过对比,3种类型奶粉的检测结果基本一致。进一步,研究对671.71 cm-1处的校正图像进行了二值化处理,阈值选取为各组纯奶粉样本在该单波段图像中出现的最大值。若有像素点的拉曼信号强度超过了阈值,说明该点检测到了三聚氰胺的拉曼信号,该像素点被标记为黑色;反之说明该像素点只含有奶粉颗粒,像素点被标记为白色,最终的二值图像结果如图6所示。结果显示,当奶粉层厚度在3 mm范围内,3组二值图像中所有像素点均可以采集到三聚氰胺产生的拉曼信号,此时三聚氰胺像素点的占比达到了100 %。但当奶粉层厚度达到4 mm时,3组中均有部分像素点无法采集到三聚氰胺的拉曼信号。当奶粉层达到5 mm时,低脂奶粉组中三聚氰胺像素点的个数最少,占比仅为37 %。考虑到奶粉颗粒之间容易聚集成团,颗粒的密集程度具有一定的随机性,实际中三聚氰胺颗粒的浓度比较低。因此,为了保证混合样本底部的三聚氰胺颗粒能够100 %的检测出,试验制定混合样本的厚度为2 mm。

图5 3种类型奶粉在不同厚度时感兴趣区域内的拉曼光谱平均值对比

图6 不同奶粉层厚度时双层样本在特征波段处的二值图像
2.3 混合样本中三聚氰胺浓度检测
研究根据10种混合样本在671.71 cm-1位移处的校正图像,计算出了同种浓度下3次采集结果中感兴趣区域内所有像素点的拉曼强度平均值,根据对应的三聚氰胺浓度进行了一元线性回归分析,结果如图7所示。由图7可以看出,随着三聚氰胺浓度的升高,校正图像中各像素点的拉曼强度平均值呈线性增长。拟合直线的决定系数达到了0.995 4,说明回归直线对三聚氰胺浓度的拟合程度较高。因此,根据校正图像中各像素点的拉曼强度可以对所选区域内三聚氰胺的浓度进行预测。对于不均匀的混合样本,应用此方法可以获得整体样本在不同区域的三聚氰胺浓度含量。
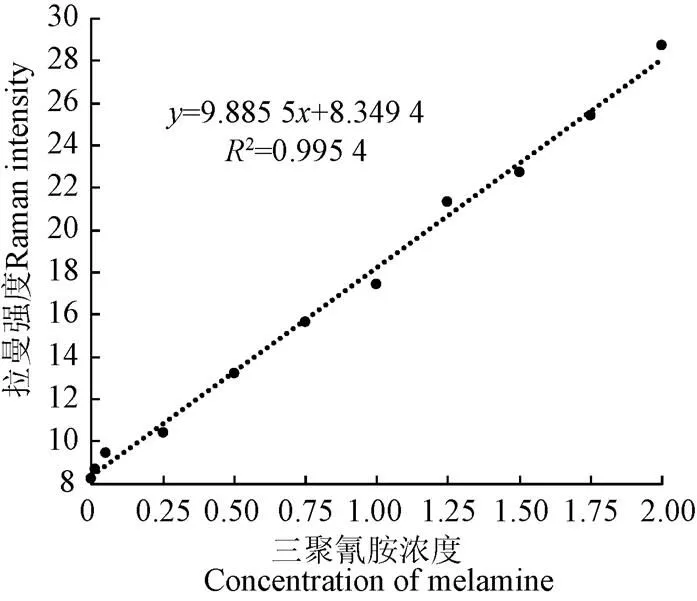
图7 在671.71 cm-1处拉曼强度平均值与三聚氰胺浓度的关系
进一步,研究对每张校正图像进行二值化处理,阈值选取与上节相同,即脱脂奶粉样本在671.71 cm-1处校正图像中出现的拉曼强度最大值。当某一像素点的拉曼强度值大于阈值时,判定该像素点检测到了三聚氰胺,此时称该像素点为三聚氰胺像素点,显示为黑色;反之,当像素点的拉曼强度小于阈值时,视该像素点内只含有脱脂奶粉颗粒,称该点为奶粉像素点,显示为白色。试验中10种浓度混合样本分3次重复取样,图8展示了几种不同浓度混合样本的二值图像结果。当三聚氰胺浓度为0.01%时,3次取样结果中均检测到了若干三聚氰胺像素点,说明在该试验参数下,奶粉样本中三聚氰胺浓度的检测限达到了0.01%。随着三聚氰胺颗粒的不断增加,二值图像中三聚氰胺像素点的个数逐渐变多。检测结果表明应用此方法获取的二值图像能够直观的显示出奶粉样本中三聚氰胺颗粒的多少和具体的位置分布。
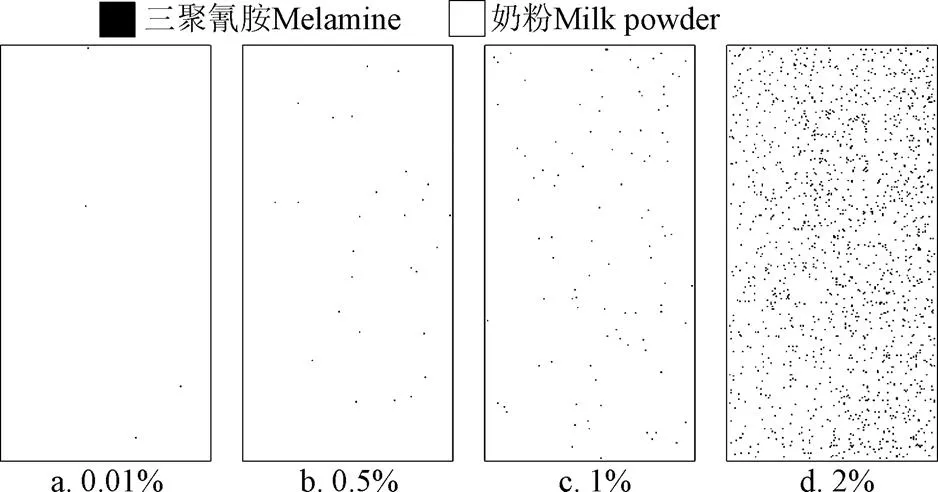
图8 不同浓度脱脂奶粉样本的二值图像结果
研究进一步统计了同浓度3张二值图像中三聚氰胺像素点的总数,它们与三聚氰胺浓度的关系如图9所示。
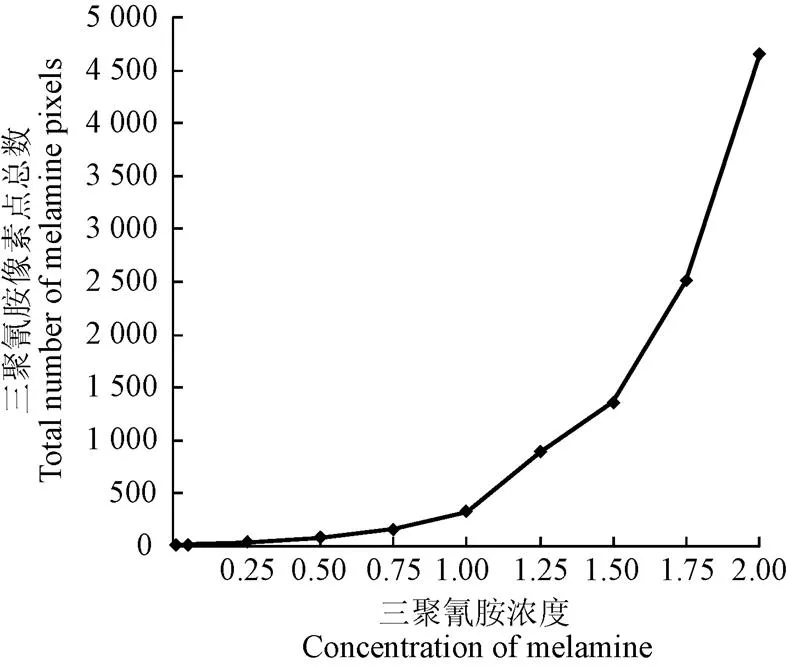
图9 二值图像中三聚氰胺像素点总数与三聚氰胺浓度的关系
在图9中,当三聚氰胺浓度增加时,三聚氰胺像素点的总数呈非线性增长。也就是说,三聚氰胺像素点在感兴趣区域内(3次采集共153 600 pixels)的占比与三聚氰胺的浓度并不一致。造成这种结果的原因可能与拉曼信号在奶粉层中的穿透深度有关。在上节的试验结果中,当奶粉层厚度为2 mm时,三聚氰胺产生的拉曼信号能够100%的穿透奶粉层被系统采集到。由此可见,本章节中混合样本的二值图像代表的是多层样本的采集结果。在低浓度时,检测结果以表层三聚氰胺颗粒为主,深层三聚氰胺颗粒产生的拉曼信号较弱无法被采集到。随着三聚氰胺浓度的升高,越来越多的处在深层的三聚氰胺颗粒被采集到,此时对应的二值图像中三聚氰胺像素点个数会成倍的增加。可以预见的是,当三聚氰胺像素点几乎占满整个感兴趣区域时,其增长速率必定会放缓。综上所述,基于线扫描式拉曼高光谱技术对奶粉中三聚氰胺浓度进行检测时,可以根据671.71 cm-1处的校正图像中所选区域内拉曼强度平均值对该区域三聚氰胺浓度进行预测,对应的二值图像中可以直观地观测到三聚氰胺颗粒的多少和位置分布信息。
3 结 论
本研究结合拉曼光谱与高光谱成像技术,搭建了一套线扫描式拉曼高光谱检测系统,对大面积奶粉样本中的三聚氰胺浓度进行了无损检测研究。研究结果表明:1)奶粉和三聚氰胺混合样本的厚度不宜超过2 mm,以此确保混合样本底部的三聚氰胺颗粒能够被检出。2)校正图像中671.71 cm-1处各像素点的拉曼强度平均值与三聚氰胺浓度呈明显线性关系,拟合结果中决定系数达到了0.995 4。3)对应的二值图像中,三聚氰胺像素点的总数呈非线性增长,三聚氰胺颗粒的位置分布可以直观的展现。4)在该试验参数下,奶粉样本中三聚氰胺的检测限可达0.01%,单次检测总面积达到40 mm×80 mm。与传统的检测方法相比,该系统可直接对颗粒状样本进行检测,无需转化成液态形式,也不必借助任何化学试剂,具有更高的时效性和更简单的操作,在实际应用中具有巨大潜力。
[1] 任东升,周志俊. 三聚氰胺毒理学研究进展[J]. 环境与职业医学,2008,25(6):595-598.
Ren Dongsheng, Zhou Zhijun. Updated information on toxicology of melamine[J]. Journal of Environmental and Occupational Medicine, 2008, 25(6): 595-598. (in Chinese with English abstract)
[2] Venkatasami G, Jr J R S. A rapid, acetonitrile-free, HPLC method for determination of melamine in infant formula[J]. Analytica Chimica Acta, 2010, 665(2): 227-230.
[3] Domingo E, Tirelli A A, Nunes C A, et al. Melamine detection in milk using vibrational spectroscopy and chemometrics analysis: A review[J]. Food Research International, 2014, 60(6): 131-139.
[4] 杨洋,徐春祥,车文军. 高效液相色谱法测定奶粉中的三聚氰胺及其不确定度分析[J]. 食品科学,2010,31(4):250-253.
Yang Yang, Xu Chunxiang, Che Wenjun. Uncertainty evaluation of HPLC determination of melamine in milk powder chromatography[J]. Food Science, 2010, 31(4): 250-253. (in Chinese with English abstract)
[5] 曾甜,陈钱,江茜,等. PVDF微孔滤膜负载金纳米粒子用于牛奶中三聚氰胺的SERS快速检测[J]. 光散射学报,2016,28(3):209-213.
Zeng Tian, Chen Qian, Jiang Qian, et al. Rapid detection of melamine in milk by surface-enhanced Raman spectroscopy with PODF membranes as supports[J]. The Journal of Light Scattering, 2016, 28(3): 209-213. (in Chinese with English abstract)
[6] Craig A P, Franca A S, Irudayaraj J. Surface-enhanced Raman spectroscopy applied to food safety[J]. Annual Review of Food Science & Technology, 2013, 4(1): 369-380.
[7] 汤俊琪,田超,曾崇毅,等. 碱性银胶的表面增强拉曼效应及对牛奶中三聚氰胺的检测[J]. 光谱学与光谱分析,2013,33(3):709-713.
Tang Junqi, Tian Chao, Zeng Chongyi, et al. Alkaline silver colloid for surface enhanced Raman scattering and application to detection of melamine doped milk[J]. Spectroscopy and Spectral Analysis, 2013, 33(3): 709-713. (in Chinese with English abstract)
[8] Wen Y, Liu H, Han P, et al. Determination of melamine in milk powder, milk and fish feed by capillary electrophoresis: A good alternative to HPLC[J]. Journal of the Science of Food & Agriculture, 2010, 90(13): 2178-2182.
[9] 刘燕德,靳昙昙. 拉曼光谱技术在农产品质量安全检测中的应用[J]. 光谱学与光谱分析,2015, 35(9):2567-2572.
Liu Yande, Jin Tantan. Application of raman spectroscopy technique to agricultural products quality and safety determination[J]. Spectroscopy and Spectral Analysis, 2015, 35(9): 2567-2572. (in Chinese with English abstract)
[10] 刘宸,黄文倩,王庆艳,等. 拉曼光谱在食品无损检测中的应用[J]. 食品安全质量检测学报,2015, 6(8):2981-2987.
Liu Chen, Huang Wenqian, Wang Qinyan, et al. Application of Raman spectroscopy technique in food non-destructive determination[J]. Journal of Food Safety and Quality, 2015, 6(8): 2981-2987. (in Chinese with English abstract)
[11] Yang Danting, Ying Yibin. Applications of Raman spectroscopy in agricultural products and food analysis: A review[J]. Applied Spectroscopy Reviews, 2011, 46(7): 539-560.
[12] 金瑞,李小昱,颜伊芸,等. 基于高光谱图像和光谱信息融合的马铃薯多指标检测方法[J]. 农业工程学报,2015,31(16):258-263.
Jin Rui, Li Xiaoyu, Yan Yiyun, et al. Detection method of multi-target recognition of potato based on fusion of hyperspectral imaging and spectral information[J]. Transactions of the Chinese Society of Agricultural Engineering (Transactions of the CSAE), 2015, 31(16): 258-263. (in Chinese with English abstract)
[13] 李江波,饶秀勤,应义斌,等. 基于高光谱成像技术检测脐橙溃疡[J]. 农业工程学报,2010,26(8):222-228.
Li Jiangbo, Rao Xiuqin, Ying Yibin, et al. Detection of navel oranges canker based on hyperspectral imaging technology[J]. Transactions of the Chinese Society of Agricultural Engineering (Transactions of the CSAE), 2010, 26(8): 222-228. (in Chinese with English abstract)
[14] Wang N N, Sun D W, Yang Y C, et al. Recent advances in the application of hyperspectral imaging for evaluating fruit quality[J]. Food Analytical Methods, 2015, 9(1): 1-14.
[15] 黎静,韩鲁佳,杨增玲. 豆粕中三聚氰胺显微近红外成像检测的扫描条件优化[J]. 农业工程学报,2013,29(13):244-254.
Li Jing, Han Lujia, Yang Zengling. Optimization of scanning conditions on near-infrared microscopic imaging for melamine detection in soybean meal[J]. Transactions of the Chinese Society of Agricultural Engineering (Transactions of the CSAE), 2013, 29(13): 244-254. (in Chinese with English abstract)
[16] Dhakal S, Chao K, Qin J, et al. Parameter selection for Raman spectroscopy-based detection of chemical contaminants in food powders[J]. Transactions of the Asabe, 2016, 59(2): 751-763.
[17] Qin J, Chao K, Kim M S. Raman chemical imaging system for food safety and quality inspection[J]. Transactions of the ASABE, 2010, 53(6): 1873-1882.
[18] Qin J, Chao K, Kim M S. Simultaneous detection of multiple adulterants in dry milk using macro-scale Raman chemical imaging[J]. Food Chemistry, 2013, 138(2/3): 998-1007.
[19] Zhang B, Huang W, Li J, et al. Principles, developments and applications of computer vision for external quality inspection of fruits and vegetables: A review[J]. Food Research International, 2014, 62(62): 326-343.
[20] Qin J, Chao K, Kim M S, et al. Line-scan macro-scale Raman chemical imaging for authentication of powdered foods and ingredients[J]. Food & Bioprocess Technology, 2015, 9(1): 1-11.
[21] 郑咏梅,张铁强,张军,等. 平滑、导数、基线校正对近红外光谱PLS定量分析的影响研究[J]. 光谱学与光谱分析,2004,24(12):1546-1548.
Zheng Yongmei, Zhang Tieqiang, Zhang Jun, et al. Influence of smooth, 1st derivative and baseline correction on the near-infrared spectrum analysis with PLS[J]. Spectroscopy and Spectral Analysis, 2004, 24(12): 1546-1548. (in Chinese with English abstract)
[22] Marquez C, Lopez M I, Ruisanchez I, et al. FT-Raman and NIR spectroscopy data fusion strategy for multivariate qualitative analysis of food fraud[J]. Talanta, 2016, 161:80-86.
[23] Xu M L, Gao Y, Han X X, et al. Detection of pesticide residues in food using surface-enhanced Raman spectroscopy: A review[J]. Journal of Agricultural & Food Chemistry, 2017, 65(32): 6719-6726.
[24] Zhang Z M, Chen S, Liang Y Z. Baseline correction using adaptive iteratively reweighted penalized least squares[J]. Analyst, 2010, 135(5): 1138-1146.
[25] Zhang C, Zhao C, Huang W, et al. Automatic detection of defective apples using NIR coded structured light and fast lightness correction[J]. Journal of Food Engineering, 2017, 203: 69-82.
[26] Guo Z, Huang W, Peng Y, et al. Color compensation and comparison of shortwave near infrared and long wave near infrared spectroscopy for determination of soluble solids content of ‘Fuji’ apple[J]. Postharvest Biology & Technology, 2016, 115: 81-90.
[27] Prabhaharan M, Prabakaran A R, Gunasekaran S, et al. Molecular structure and vibrational spectroscopic investigation of melamine using DFT theory calculations[J]. Spectrochim Acta A Mol Biomol Spectrosc, 2014, 123(7): 392-401.
[28] Mircescu N E, Oltean M, Chiş V, et al. FTIR, FT-Raman, SERS and DFT study on melamine[J]. Vibrational Spectroscopy, 2012, 62(9): 165-171.
[29] 郭沫然,任玉,张天幕,等. 基于密度泛函理论的三聚氰胺结构及振动光谱研究[J]. 光谱学与光谱分析,2012,32(3):703-707.
Guo Moran, Ren Yu, Zhang Tianmu, et al. Optimization of melamine structure using density functional theory and vibrational spectra studies[J]. Spectroscopy and Spectral Analysis, 2012, 32(3): 703-707. (in Chinese with English abstract)
[30] Huang M, Kim M S, Chao K, et al. Penetration depth measurement of near-infrared hyperspectral imaging light for milk powder[J]. Sensors, 2016, 16(4): 441-451.
Non-destructive detection of melamine in milk powder using Raman hyperspectral imaging technology combined with line-scanning
Liu Chen1,2,3,4, Yang Guiyan2,3,4, Wang Qingyan2,3,4, Huang Wenqian2,3,4, Wang Xiaobin2,3,4, Chen Liping1,2,3,4※
(1.712100,; 2.100097,; 3.100097,4.100097,)
As a scattering spectrum, Raman spectroscopy has some advantages in non-invasive detecting. The hyperspectral data contain not only conventional image but also spectral information in each pixel. In this study, a line-scanning Raman hyperspectral imaging system was built to detect and quantify the melamine mixed in the milk powder with large sample areas in a fast and nondestructive way. The Gaussian filter smoothing and an adaptive iteratively reweighted penalized least squares (air PLS) method were used to remove noise signal and fluorescence interference. The corrected images at 671.71 cm-1waveband were extracted for detecting the melamine in the milk powder. Firstly, the penetration depth of Raman signal produced by melamine in the milk powder was measured. A designed two-layer sample was applied to measure the Raman signals after passing through milk layers of different thicknesses. According to the results, the optimum thickness of mixed samples was set to be 2 mm. Then, melamine-milk mixtures with 10 different concentrations were prepared for the experiment. Each mixture was collected by a designed aluminium alloy container with a sample thickness of 2 mm. In this case, the melamine particles at the bottom of mixed sample could be collected. After data preprocessing, a linear analysis of the averaged Raman intensity of each pixel was performed, and the concentration and distribution information of the melamine particles were finally obtained using a simple binarization arithmetic in the single-band image of mixtures at 671.71 cm-1waveband. The results showed that there was a linear relationship between the melamine concentration and the average Raman intensity of all pixels in the region of interest of the corrected image at 671.71 cm-1waveband, and the coefficient of determination was 0.995 4. In the binary images, the number and spatial location information of melamine particles could be visually displayed. Meanwhile, the total number of the additive pixels increased nonlinearly. It meant that the binary images from this research represented the accumulation of multiple layers in sample. At low concentrations, the Raman signal generated from the additive particles at the sub-surface is too weak to detect. When the additive concentration increases to a certain degree, the Raman signal generated from the additive particles at the sub-surface can be collected. In these areas, the pixels are identified as additive pixels even if there is no additive particle at corresponding surface. This situation led to a significant increase in the number of additive pixels. The research demonstrates that the Raman intensity in single-band corrected images can be used for quantitative analysis of melamine, and the binary images can reveal the identification and the distribution of melamine particles in the skim milk powder. More Raman active additives in powdered food could be detected in the same way. In our research, the milk powder samples can be scanned directly without any chemical reagents. The process of converting to liquid is dispensable. The limit of detection for melamine concentration was estimated as 0.01% with a total detection area of 40 mm × 80 mm each time. The results show that the line-scanning Raman hyperspectral imaging system has shown a great potential for rapid and non-invasive measurement of samples with large areas.
nondestructive detection; image processing; spectrum analysis; Raman spectroscopy; hyperspectral imaging technology; line scanning; skimmed milk powder; melamine
10.11975/j.issn.1002-6819.2017.24.036
O657.37
A
1002-6819(2017)-24-0277-06
2017-08-22
2017-12-11
国家自然科学基金项目(61605009)
刘 宸,男,黑龙江哈尔滨人,博士研究生,研究方向是农产品品质安全无损检测。Email:xmyliuchen@126.com
陈立平,女,研究员,研究方向为农业信息技术和农业智能装备研究开发和示范推广。Email:chenlp@nercita.org.cn
刘 宸,杨桂燕,王庆艳,黄文倩,王晓彬,陈立平. 线扫描式拉曼高光谱成像技术无损检测奶粉三聚氰胺[J]. 农业工程学报,2017,33(24):277-282. doi:10.11975/j.issn.1002-6819.2017.24.036 http://www.tcsae.org
Liu Chen, Yang Guiyan, Wang Qingyan, Huang Wenqian, Wang Xiaobin, Chen Liping. Non-destructive detection of melamine in milk powder using Raman hyperspectral imaging technology combined with line-scanning[J]. Transactions of the Chinese Society of Agricultural Engineering (Transactions of the CSAE), 2017, 33(24): 277-282. (in Chinese with English abstract) doi:10.11975/j.issn.1002-6819.2017.24.036 http://www.tcsae.org
猜你喜欢
中国化肥信息(2022年2期)2023-01-02
中国化肥信息(2022年8期)2022-11-30
辽宁省博物馆馆刊(2021年0期)2021-07-23
现代电子技术(2021年1期)2021-01-17
物理学报(2020年16期)2020-08-29
上海大学学报(自然科学版)(2018年5期)2018-11-02
中国化肥信息(2018年2期)2018-08-23
电脑知识与技术(2018年35期)2018-02-27
自动化学报(2017年11期)2017-04-04
中国化肥信息(2016年41期)2016-05-17
