Advanced Model Predictions Vs.Test Data in Tilting Pad Bearings for Compressors
2018-07-13 08:25LuisSanAndrsBehzadAbdollahi
风机技术 2018年3期
Luis San AndrsBehzad Abdollahi
(1.Mechanical Engineering Department Texas A&M University College Station,TX,USA;2.LobePro Rotary Pumps Brunswick,GA,USA)
Abstract:The paper details fundamental progress on the analysis of tilting pad journal bearings that includes both pivot flexibility and pad surface deformation due to pressure and pad crowning due to thermal effects.The work introduces a novel model for the mixing of flow and thermal energy at a lubricant feed port that sets the temperature of the lubricant entering a pad leading edge.Precise estimation of this temperature,the inlet oil viscosity,and the flow rate entering a pad largely determines the temperature rise along the pad lubricated surface as well as the drag power loss,and ultimately the bearing load capacity.The model predictions are validated against bearing test data applicable to a compressor.The paper delivers recommendations for a novel feed port efficiency parameter that represents various types of oil supply configurations.Importantly enough,and as is done in actual practice,the model allows the specification of the delivery flow date into the bearing rather than a supply pressure.
Key Words:Fluid film bearing,Groove flow model,Force coefficients,Rotordynamics
Nomenclature
Cxx,CyyBearingdirectdampingcoefficients[N·s/m]
CgrGroove mixing coefficient[-]
Cidemand parameter(Ci)for the ithgroove[-]
cpLubricant specific heat[J/kg°K]
D Shaft diameter[m]
Kxx,KyyBearing direct stiffness coefficients[N/m]
L Bearing pad axial length[m]
N Journalrotationalspeed[RPM],N=Ωπ/30
n Number of pads(=grooves)
Mxx,MyyBearing virtual mass[kg]
Q Lubricant flow[LPM]
T Fluid temperature[°C]
W Static load[N]
Φ Heat flow[W·m2]
α Fraction of total supply flow allocated to each groove[-]
λ Hot oil carry over factor in the conventional model[-]
Ω,ωShaftspeed[rad/s],Excitationfrequency[rad/s]
Subscripts
grChurning lubricant enclosed in the groove region
LE,TELeading edge and trailing edge of a pad
sumpRegion enclosed by back of a pad and housing
supSupply(fresh)lubricant
SLSide leakage
1 Introduction
A tilting pad journal bearing(TPJB)is a type of fluid-film bearing supporting rotating machinery with low shear drag power loss and minimal destabilizing forces.A TPJB,shown schematically in Figure 1,consists of usually three or more pads,each supported by a pivot.Each pad tilts about its pivot and forms a convergent wedge between the pad inner surface and the shaft.During operation,the rotating journal drags a viscous fluid into the wedge to generate a hydrodynamic pressure field that carries a load(W).
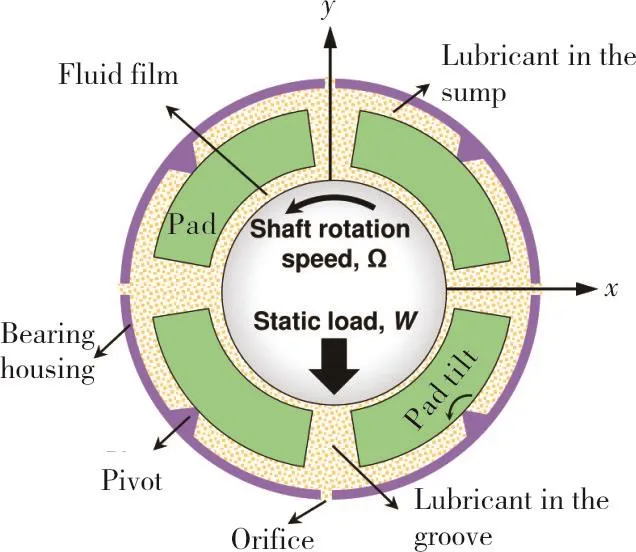
Fig.1 Schematic view of a 4-pad load between pad(LOP)tilting pad journal bearing components and coordinate system.
Figure 2(a)shows a conventional(single orificeII Modern high performance TPJBs employ direct lubrication methods such as spray bars(with blockers)and leading edge grooves.)feed groove in a TPJB.This region is comprised of an orifice supplying cold (fresh) lubricantatsupply temperature(Tsup)into the groove,an upstream pad discharging warm lubricant into the groove along with a layer of hot oil(at temperatureTTE)attached to the journal surface,and a downstream pad that demands a certain amount of lubricant to fill its clearance.The flow within the groove is highly recirculating(churning).Other modern direct lubrication methods include spray bars(with blockers)and leading edge grooves.As shown schematically,in Figure 2(b),mixing of hot and cold flows along with thermal energy exchanges in the lubricant feed groove region set both the temperature and flow rate of the fluid entering the leading edge of a downstream pad[1].The flow rate and temperature of the fluid at a pad leading edge largely determine the film temperature rise along the lubricated pad surface and the temperature field within the pad,both of which ultimately govern the pad and journal thermally induced deformations.

Fig.2(a)Alubricant feed groove region bounded by adjacent pads in a TPJB with a single orifice;(b)Heat fluxes and lubricant flows across the boundaries of a feed groove region.
In spite of the intricate nature of the flows in a lubricant feed groove region,various authors,see Refs.[2-4],developed simple though still physically sound models for the fluid mixing in the feed groove region.Bulk or lumped parameter thermal mixing models,apply the conservation of mass and thermal energy in the groove region through a thermal mixing coefficient or hot oil carry over factor(0 <λ< 1).The parameterλrepresents the fraction of flow leaving an upstream trailing edge(QTE)at temperature TTE.This flow mixes with the supply lubricant flow(Qsup)injected in the groove at (cold) temperatureTsup. Entering the downstream pad is a flow with magnitude(QLE)at temperatureTLE.A lumped parameter mass flow balance and a thermal energy flow balance determine the leading edge temperature(TLE)and flow rate(QLE)as

This simple concept,adapted by virtually all prediction tools,is not accurate for bearings operating under certain extreme conditions,see Ref.[5].Some recent works[5-7]report other models that diminish the influence of empirical coefficients.The following lists several physical phenomena within the groove region that are not accounted for by a simple(conventional)thermal mixing flow model.Note in Fig 2(b),the cold supply flow mixes with the churning oil in the groove region before reaching the(upstream)hot oil layer attached to the rotating shaft.Meanwhile,the adjacent pads exchange heat with the oil in the groove via the bounding side walls.The fluid film entering a pad adds the shear driven flow(dragged by the spinning journal)to the pressure driven(reverse)flow.As the applied load increases the pressure driven flow becomes dominant causing a portion of the lubricant at the pad leading edge to flow in a reverse direction and to re-enter the groove.Finally,a portion of the flow exits the groove region axially(side leakage)depending on whether the bearing has end seals(flooded)or not(evacuated).
Figure 3 shows a load-between-pad(LBP)four pad TPJB operating under a heavy specific load(W/(LD)>2.1 MPa).A high journal eccentricity in the load direction creates a very thin film in the bottom pads while it unloads the upper ones,thus leaving a large gap between the unloaded pads(3,4)and the shaft.The groove in between pads 4 and 1 receives a large flow(QTE)from unloaded pad#4,while discharging only a much smaller flow(QLE)to be carried into the heavily loaded pad#1.The conventional thermal mixing model,Eq.(1)assumes that the supply flow(Qsup)always enters the groove;however in this condition,since(λQTE) >QLEthe model sets the supply flow rate(Qsup)to zero.Ettles[4]defines boundaries for a ratio of upstream flow to downstream flow that prevents a negative supply flow.In this situation Suh and Palazzolo[8]also modify the model in Eq(1).to bypass the flow rate balance.

Fig.3 Aheavily loaded TPJB operating with a large shaft eccentricity(small film thickness).
TPJBs with direct lubrication often operate with no end seals or wide-open seals(evacuated housing)[9],and the excess upstream oil leaves the groove region axially(side leakage)[10].For either a flooded or an evacuated bearing configuration,including the side leakage flow in the groove lubricantmixing modelimproves the temperature prediction(as in Ref.[7]).
In 2012,He et al.[9]investigate the applicability of the original model in[2],i.e.,Eq.(1),to direct lubrication bearings in a thermo-hydrodynamic(TEHD)analysis.In industrial practice the coefficient(λ)is set as,0.7 <λ< 1 for conventional flooded bearings and 0.3<λ<0.7 for directly lubricated bearings and evacuated bearings.The authors set a lower limit for a pad leading edge temperature predicted from Eq.(1),and define a cool oil insertion model.Here,Qsupis known,and without resort to a mixing coefficient,the trailing edge flow(QTE)equals(QLE-Qsup),and

Eq.(2)represents a physical situation where all the available supply oil cools the minimum amount of hot oil in the most efficient way.He at al.[9]then compare TEHD predictions to test data for three direct lubrication bearings(spray bar and leading edge groove)under a specific load ranging from 0.35 MPa to 3.1 MPa.For the largest load,predictions are less consistent with test data,within 10°C maximum difference;shaft speed having little effect on the discrepancy.The thermal mixing coefficient(λ)decreases with an increase in shaft speed.The predicted temperature for the first unloaded pad,downstream of loaded pads,is substantially higher than the measurement which casts doubt on the assumption of an evenly distributed supply oil into each groove,Qsup/Npads.
In a similar way,Suh and Palazzolo[8]in 2015 modify Eq.(1)and use a mixing coefficient(λ=0.8)when the upstream flow is larger than a portion of the(required)downstream flow.This is to prevent a zero or negative supply flow.In this case,the temperature at the leading edge is a weighted average of the temperature at the pad trailing edge and the temperature of the(cold)supplied lubricant,

2 Description of A Novel Thermal Mixing Model
San Andrés and students[11-13]state the general model for the prediction of TPJB load and dynamic forced response based on the coupled solution of an extended Reynolds equations and the thermal energy transport in the thin film along with heat conduction to the pads and the shaft.The elastic deformation of each pad inner surface modifies the film thickness along the radial direction and includesboth thermally induced and pressure induced deformations.
2.1 AbouttheLubricantMixingataFeedGroove
A major drawback of the conventional hot oil carry over model,Eq.(1),is that it predicts a supply flow only based on the upstream flowand downstreamflow adjacent to a groove[2].Therefore,unless the predicted flow rates are close to actual ones,the conventional model gives an inaccurate leading edge film temperature(TLE).Although not always satisfying flow continuity,He et al.[14]assume each groove collects an identical fraction of the total flow supplied,namely
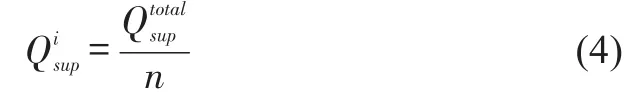
Figure 4 shows an idealized representation of the total supplied flowdividing into separate streamsA deep outer groove on the bearing housing OD(plenum)contains the fresh lubricant at the supply temperature and feeds each orifice based on the groove local pressure on the other side of the hole.Due to the complexity of the flow in the groove region,determining a local pressure for the groove is not practical.Instead,the current model extends Eq.(4)to account for excessive flow demand or a restriction of flow from each groove.

Fig.4 Left:schematic view of a heavily loaded TPJB operating at a large journal eccentricity.Right:a hydraulic network that allocates the supply flow into each feed groove.
Thin film lubrication theory definesthe fluid circumferential velocity as a superposition of a shear driven flow dragged by the motion of the shaft(Couette flow)and a pressure driven flow(Poiseuille flow).The axial flow only comprises a pressure driven flow.The circumferential flow at either a pad leading edge(θLE)or a pad trailing edge(θTE)equals

The first step to quantify the restriction or demand of each groove for fresh(cold)lubricant,introduces a groove demand(Ci)parameter that accounts for the following:ⅡⅡ Note the assumption is valid if all the pads are fully wetted(flooded)and able to maintain a full film throughout every pad.
(a)At a pad leading edge,the shear driven(forward)flow (proportionalto film thickness)increasesthe demand for(cold)supply lubricant.The pads with a large leading edge film thickness,as is the case for unloaded pads#3 and#4),see Fig.4,receive a large flow at their inlet(leading edge).On the otherhand,a large hydrodynamic pressure gradient(on loaded pads#1 and#2)may cause a significant flow in the reverse direction that curtails the flow demand.
(b)At a pad trailing edge,the pressure driven flow adds to the shear flow,pushing the flow in the same direction as the shaft surface motion.A large flow leaving from an upstream padmay provide an excess amount of flow to fill in the gap of the downstream pad leading edge,and this reduces the demand for additional supply flow.The leading edge flow of pads#1 and#2 are about the same(see Fig.4),but pad#1 receives a large flow from upstream(usually hot),reducing its demand for supply oil.Similarly,the leading edge flow of pads#3 and#4 are about the same,but pad#3 receives a very small flow from the upstream which aggravates its need for more supply oil.
Recall that theithgroove faces the trailing edge of an upstream pad(i-1)and the leading edge of downstream pad(i).The demand parameter(Ci)for theithgroove divides the shear flow rateentering ith pad to the total flow that blocks the fresh supply of oil.The latter(blocking)flow adds the flow rate leaving the(i-1)thpad at its trailing edgeto the pressure driven flow exiting(in reverse)the leading edge of theithpadThe demand parameter is

Ci=1 if both downstream pad and upstream pad flows are equal;that is the case of a centered journal(no load).Ci<1 in theithgroove that restricts the supplied flow;whereasCi>1 for theithgroove that demands extra lubricant.The second step addsCi|i=1,…,nto produce a total demand parameter(Ctotal).The available total or global supply flow(Qtotal)meets the total demand by the bearing.

As the final step,a groove receives a portion of the total supply flow based on its demand(Ci)relative to the total demand(Ctotal).Here the grooves with a larger demand receive a greater portion of the supply flow.Letαidenote a fraction of total flow,the supply flow allocated to each groove is,

Figure 5 depicts the predicted fraction of total supply flow(αi)i=1,nversus shaft speed and specific load for a four-pad TPJB tested by Coghlan and Childs[15-16],see later Table 1.The bearing operates in a load between pad(LBP)configuration;the bottom two pads(#1 and#2)supporting the applied load.The dashed red line marks equal flow fractions(=14)for each pad atW/(LD)=0 where the demand parameterCi≈1 for all the grooves and hence each receives(αi≈ 1/n)of the total flow.

Fig.5 Predicted fractions of total supply flow(αi)allocated to each groove in a 4-pad TPJB[15].(Dashed red line specifies an even flow distribution at zero load).
As the load increases,the rotor eccentricity along the load direction-Xincreases and a small inlet film thickness restricts the flow for the loaded pads thus reducing(αi),i.e.,the demand of flow decreases.On the other hand,a large film thickness on the unloaded pads requires more lubricant to create a full film,hence increasingαi.Thus,the difference in flow fraction(αi)for the loaded and unloaded pads grows as the applied load increases.The above-mentioned difference in flow demand is most significant between pad#3 and#1.One can surmise that during a high load operation the flow rate to pad#3 can be significantly reduced without substantial effect on the film temperature and overall bearing performance.
Figure 6 shows the lubricant flows and heat fluxes entering and exiting the boundaries of a control volume that represents a groove region. Cold lubricant is supplied into the bearing at a known flow rate(Qi sup)and temperature(Tsup).Hot oil leaving the trailing edge of the upstream pad with a flow rateand a temperatureloses some of its heat in the groove region and reaches the leading edge of the downstream pad with a flow rateand a temperature
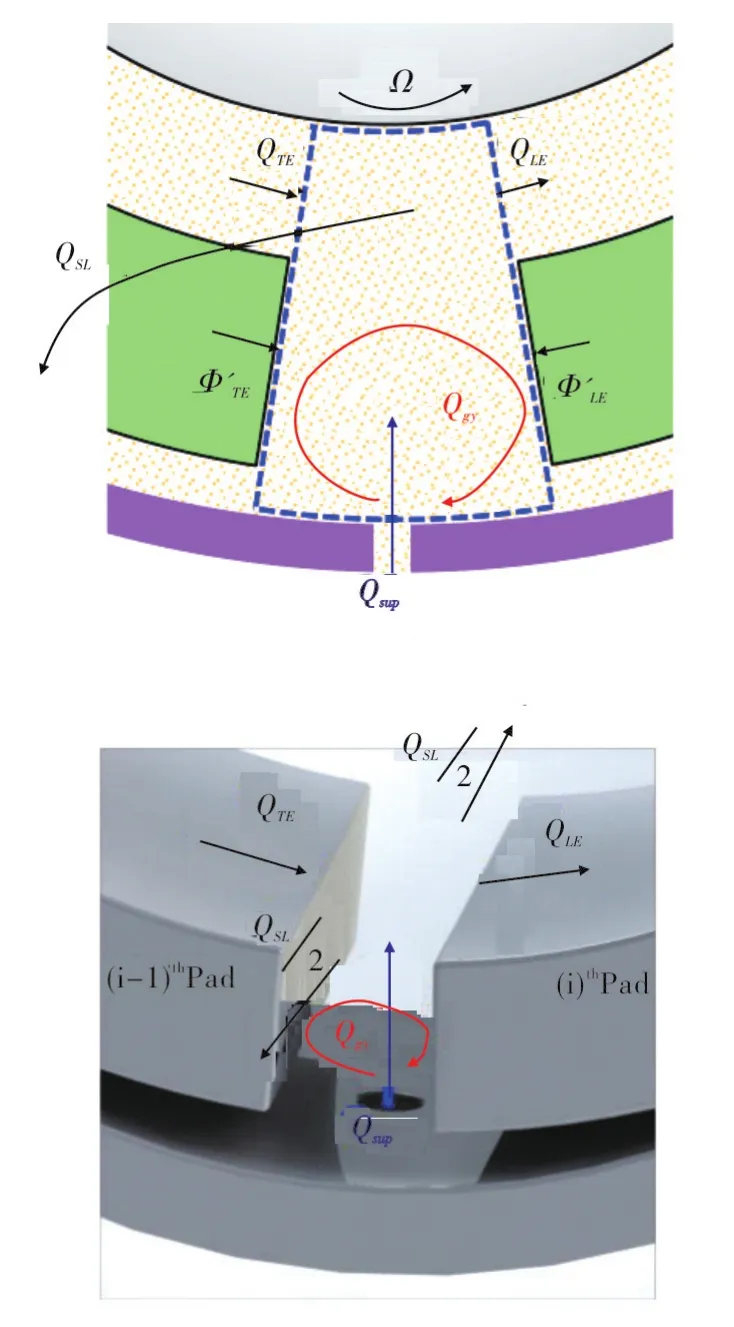
Fig.6 Mixing in a feed groove region of hot oil leaving anupstream padwith a cold supply flowIncluding side leakage flowand groove recirculating flowas well as heat transfer with the bounding pads.

Opposed to the conventional thermal mixing model in Eq.(1),the current model emphasizes the portion of hot oil that does not reach the next pad and either leaks out from the sides or recirculates within the groove.The temperature of the discharge side leakage flowand churning oil in the groovedepend on the upstream oil temperature and flow rateas well as supply temperature and flow rate
In a bearing groove,thermal energy(heat)flows mainly by means of fluid motion,i.e.an advection heat transfer mechanism.Fluid flow(Q)transports energy from onelocation to another.Theheatflow (Φ)transported by the lubricant is where∆Tis the temperature difference,and (ρcpQ)=cpṁ is the fluid thermal capacitance.

Figure 7 shows two versions of the control volume at a groove,the left control volume refers to a situation where side leakage occurs,and the one on the right refers to a condition where oil streams recirculate in the groove.In both,heat flow(Φ)is transported internally by the mixing of the fluid streams.The left sub-control volume(bottom part)assumes that only a portion of the streams that flow into the groove(the hot upstream oil and the cold supply oil stream)carry the thermal energy that is transferred into the side leakage stream.Therefore,the heat flowing into the leading edge section of the downstream pad is omitted.

Fig.7 Groove control volume including fluid streams(solid arrows)and heat flows(hollow arrows).(a):heat flows from a hot upstream oil(ΦTE,SL)and the cold supplied oil(Φsup,SL)into a stream that evacuates from the groove.Right:hotΦTE,grand coldΦsup,grflows into an oil stream that recirculates within the groove.
A mixing efficiency parameter(0<Cgr< 1)represents the ability of a particular oil-feed groove arrangement to lubricate the downstream pad with fresh(cold)supply oil while discharging the upstream hot oil(displacing it to the sides).That is,Cgrspecifies the portion of the heat that flows from the hot upstream section(ΦTE,SL)and the cold supply oil(Φsup,SL).Thermal energy must still be conserved within a sub control volume,thus the sum of two heat flows is nil,or(ΦTE,SL+Φsup,SL)=0.
Recall from Eq.(9),either the side leakage flow(QSL)or the groove churning flow(Cgr)can be present in a groove,but not both.Hence,as shown on the right graph in Fig.7,only a portion of the fluid streams flowing into a groove contribute to transporting thermal energy to the oil stream that churns within the groove and therefore(ΦTE,gr+Φsup,gr)=0.
Conservation of energy dictates that the sum of the thermal energy transferred between the hot upstream oil and the side leakage oil(ΦTE,SL)and that between the side leakage oil and cold supplied oil(Φsup,SL)equals zero.From this balance,the temperatureof the side leakage is

Direct lubrication methods such as a leading edge groove reduce hot oil carry over,henceCgr→1.On the other hand,when the bearing axial ends are sealed(a flooded bearing),Cgr→0.
In the absence of any side leakage flow,a similar transport energy balance establishes that the sum of the thermal energy transferred between a hot upstream trailing edge oil and the churning oil in the groove(ΦTE,gr)and that between the churning oil and a cold supply oil(Φsup,gr)is zero.The temperatureof the recirculating oil in the groove is

The temperature of the churning oil in the grooveis closer toTsupif the majority of the hot upstream oil discharges from the sides(Cgr→1).However,for a flooded bearing a large portion of the upstream oil flow recirculates in the groove,thus increasingto a magnitude close to
Some heat is also transferred from the wetted wall of the pad trailing edge and also from the wetted wall of a pad leading edge into the oil that is recirculating in the groove.These heat flowsare obtained from integrating the convective heatfluxes across the respective fluid-solid boundary,whereLis a pad axial length andhgris the convection coefficient of the lubricant in the groove.See Abdollahi[13]for further details.

An energy balance method takes into account all the aforementioned heatfluxes to determine the film temperature at the leading edge of the downstream padRecall from Eq.(9)thatdo not coexist(or apply simultaneously),only one is present at each groove.The approach is energy conservative,namely at theithgroove

Finally,from the above relation,the leading edge temperatureof the fluid entering theithpad is

Unlike the conventional model,Eq.(1),the equation above includes the thermal energy from the side and churning fluid flows,as well as the heat convected from the pad metal surfaces into the lubricant.The above equations are easily integrated into a predictive model solving for the bearing pads hydrodynamic pressure and temperature fields, and including pad elastic deformations due to both mechanical(pressure)and thermal effects(expansion and crowning).
3 Comparison of Predictions Against Test Data
Coghlan and Childs[15-16]conducted an extensive test program to study the effects of various lubrication(oil feed)configurations,as shown in Figure 8,on the static and dynamic force performance of a spherical seat TPJB for use in centrifugal compressors in the O&G industry.

Fig.8 Schematic of lubrication delivery methods-taken from Ref[15].

Tab.1 Characteristics of a four-pad TPJB tested by Coghlan and Childs[15-16].
Table 1 details the bearing geometry and operating conditions.The oil feed/exit arrangements are:
·Flooded single-orifice(SO),labyrinth end seals with nominal clearance of 170µm
·Evacuated leading edge groove(LEG),no end seals
·Evacuated spray-bar(SB),no end seals
·Evacuated spray-bar blocker(SBB),no end seals
Coghlan and Childs measured pad surface temperature(embedded in the Babbitt layer),journal eccentricity,hot bearing clearances,and a complex stiffness for each feeding arrangement and for operation with a shaft speed ranging from 7 kRPM and 16 kRPM(ΩRs=85m/s),and under a specific load,0.7 MPa to 2.9 MPa.The authors then curve fit a frequency independent[K,C,M]model to the complex stiffnesses data to extract the stiffness(K),damping(C),and virtual mass(M)coefficients of the bearing.
The following predictions pertain to a TPJB with spray bars(SB)delivering the supply oil and having no end seals(retainers)to evacuate the housing from recirculating lubricant.Buffer seals prevent oil axial leakage from the test bearing into the adjacent support bearing chambers and guide it to oil outlet pipes.
Figure 9 shows the pad surface temperature for operation at 7 kRPM and 16 krpm,shaft speed 37 m/s and 84 m/s,and under three magnitudes of specific load(alongydirection);0.7 MPa to 2.9 MPa.Following the bearing provider recommendation,the flow rate is fixed at 42 L/min suitable for the highest shaft speed(16 kRPM)during all the test operating conditions.Hence,the bearing is over-flooded at 7 kRPM causing substantial amounts of fresh lubricant to axially discharge from a groove.A groove efficiencyCgr=0.6 delivers pad surface temperature predictions agreeing with the test data for the TPJB equipped with spray bars.Since the known supply flow rate is utilized to obtain the predictions using the novel oil thermal mixing model,a constantCgrprovides accurate pad surface temperatures.

Fig.9 Pads'surface temperature rise versus circumferential location.Predictions compared against test data in Ref.[15].(Spray Bar,Evacuated,Tsup=49°C,N=7 and 16 kRPM,W/(LD)=0.7,2.1,2.9,MPa,andCgr=0.6)
The agreement between the predictions(TEHD)and the measurements is remarkable.Table 2 shows the predicted flows in the groove region delivered by the current and conventional oil thermal mixing models for operation atN=7 kRPM and low load(W/(LD)=0.7 MPa),and at a high speedN=16 kRPM and a high specific load(2.9 MPa).For the low speed and load load operation,note the large amounts of side leakage flow(QSL)and absence of groove flow(Qgr)predicted by the current model as the bearing is evacuated(without end seals).The conventional thermal mixing model predicts=19L/min since it does not account for the excessive suppliedoil(42L/min).Thecurrentmodelsets=42L/min,and calculates the amount of extra supplied oil that leaves the groove as a side leakage(QSL).Pad#3(unloaded)demands 41%of the supplied oil(42 LPM)since it receives a diminished flow from upstream pad#2.On the other hand,(loaded)pad#1 demands the least amount of supply oil as it is immediately after an unloaded pad(#4).
At the high speed and high load,N=16 kRPM andW/(LD)=2.9MPa),the conventionalmodelpredicts=48L/min,slightly larger than the actual test condition(42 L/min).For the first pad,thus the conventional model predicts a nil supply flow rate.Conceivably,a portion of the extra lubricant coming from the upstream unloaded pad#4 axially discharges as a side leakage and does not enter pad#1.The novel thermal mixing model predicts the large side leakage flow14.6 L/min).On the other hand,a large magnitude of groove flow(=4.3 L/min)for an evacuated bearing is not physically achievable and suggests occurrence of oil starvation.In this situation,the available supply flow(5.7L/min)is not enough to create a full film at the pad#4 leading edge;thus,a full film develops further along the pad arc length.As shown in Table 2,unloaded pad#3 demands the majority(66%)of the supplied flow,while the flow for loaded pad#1 reduces to just 6%.This is due to a highly eccentric journal position produced by the large load.Pad#2(loaded)and pad#4(unloaded)equally demand 14%;one pad receives the least amount of hot oil carry over,while the other receives the most.

Tab.2 Flow rates[L/min]in the feeding grooves of bearing in Ref.[15].Predictions from current model(Cgr=0.6)and conventional model(λ=0.8).(Spray Bar,Evacuated)
Figure 10 compares the maximum predicted pad#2 surface temperature to the measured one for various operating conditions,versus speed and load.A fixed groove efficiency parameter(Cgr=0.6)delivers predicted temperatures that best fit the test data for all operating conditionswithamaximumdiscrepancyof4°C.Theability to accurately predict the temperatures with a singleCgris a notable improvement over the earlier thermal mixing model in which the hot oil carry over factor(λ)needs to be tailored for each operation(in particular shaft speed).Recall that during the tests reported in Ref.[15],the total supply flow rate is kept constant(42 LPM)for all operating conditions.

Fig.10 Maximum inner surface temperature on pad#2 versus shaft speed and for specific load,W/(LD)=0.7,2.1 and 2.9 MPa.Current predictions and test data in Ref.[15].
Figure 11 shows the predicted total flow rate produced by the conventional oil mixing thermal model withλ=0.8 versus shaft speed for three specific loads.For most operating conditions,the predicted total supply flow rate is less than the actual one.During the tests,the excess supply flow likely discharged axially from the bearing grooves(wide open seals)and did not lubricate the pads.However,the excess flow contributes to reducing the temperature of the hot oil that travels across each groove.Since the conventional model does not account for side leakage flow,a smallerⅢⅢFrom Eq.(1)Qsup=QLE-λ QTE;a decrease in λ produces an increase in the required supply flow.λmust be selected for low shaft speeds to fit the predicted temperatures to the test data.The current thermal mixing model,as shown in Fig.11,delivers accurate film temperatures for a range of operating conditions with a fixed total supply flow using a constantCgr.
Fig.11 Predicted flow rate versus shaft speed and specific load W/(LD)=0.7,2.1,2.9 MPa.Conventional thermal mixing model(λ=0.8).Constant flow rate in tests[15]for spray-bar with evacuated housing.
Coghlan and Childs[16]use a frequency independent[K,C,M]model to extract the bearing static stiffness[K],viscous damping[C],and virtual mass[M]coefficients from curve fits to the experimentally derived complex stiffnesses[H].The imaginary part of the complex stiffness is approximately linear and the slope defines the bearingdamping,i.e.ℑ(H)⇒ωC.Themagnitudeofcomplex stiffness real part at zero excitation frequency is the bearing stiffness and a quadratic curvature represents the bearing virtual mass,i.e.ℜ(H)⇒K-ω2M.His identified over the frequency range 10 to 250 Hz.
Figures 12-14 depict the measured and predicted bearing direct force coefficients(stiffness,damping,and virtual mass)versus specific load,0.7 MPa to 2.9 MPa,for shaft speeds ranging between 7 kRPM and 16 kRPM.The predicted cross-coupled force coefficients are very small and not shown.
Figure 12 shows that the bearing stiffnesses(Kxx,Kyy)increase with an increase in the static load at a given shaft speed.On the other hand,an increase in shaft speed reduces the bearing stiffness(Kxx,Kyy)at a constant specific load.The model predicts isotropic stiffnesses(Kxx=Kyy),but the test data show significant orthotropy(Kyy>Kxx),and which is not expected for a LBP configuration with identical pads.Also,the stiffness orthotropy in the test data increases with an increase in specific load.PredictedKyy,Kxxare in a good agreement with the measurements with a maximum difference not exceeding 25%,with an average difference of 17%along theloaddirection(y)and8%intheorthogonaldirection(x).

Fig.12 Direct stiffness coefficients(Kyy,Kxx)versus specific load for operation at four shaft speeds,7 kRPM to 16 kRPM.TEHD prediction and test data in Ref.[16].

Fig.13 Direct damping coefficients(Cyy,Cxx)versus specific load for operation at four shaft speeds,7 krpm to 16 krpm.tehd prediction and test data in ref.[16].
Figure 13 shows predicted damping coefficients(Cxx,Cyy)in comparison with the test derived coefficient.The bearing damping decreases with an increase either in the static load or the shaft speed.As the shaft speed or specific load increase,the predicted damping coefficients decline more rapidly compared to test data.Compared to the stiffnesses,the predicted(Cxx,Cyy)show a consistent large discrepancy with the measurements.The maximum difference between predictions and test data is 59%and 45%forCyyandCxx,respectively.The average difference is 25%in the load direction and 41%in the orthogonal direction with respect to the test data.
Judging from the similar trends in the TEHD predictions and the test data for stiffness and damping coefficients and observing a consistent difference,it is surmised that the pivot stiffness(412 MN/m)used in the predictions is not sufficiently large.The discrepancy between the predicted damping coefficients and the test data is more pronounced than that for the stiffnesses since pivotflexibility hasamorepronounced effecton reducing the bearing damping coefficients than the stiffness coefficients.

Fig.14 Direct virtual mass coefficients(Myy,Mxx)versus specific load for operation at four shaft speeds,7 krpm to 16 krpm.TEHD prediction and test data in Ref.[16].
Figure 14 depicts predicted virtual mass coefficients(Mxx,Myy)and compares them against the test force coefficients.A negativeMindicates that the real part of the complex stiffness(ℜ(H))increases with excitation frequency.This‘hardening effect’is common in TPJBs.Unlike the bearing stiffness and damping from the test data,the test identified virtual mass magnitudes carry a significant uncertainty(up to 50%).Hence,one cannot rely on the exact magnitudes of the reported test virtual masses.
4 Conclusions
An accurate characterization of the static load performance in a bearing is paramount to also predict accurate rotordynamic force coefficients.An analysis that couples pressure generation to thermal effects in a bearing requires an accurate prediction of film and pad temperatures.This work introduces a simple yet effective thermal flow mixing model for the lubricant in a supply groove region that rectifies some limitations associated with the conventional hot oil carry over mode towards delivering improved temperature predictions at the inlet of a pad.The novel model includes the influence of the sides flow and churning flows in a supply groove.An important feature is the ability to impose the actual lubricant supply flow,specifically when the bearing is operating in either an over-flooded or a reduced flow condition.
The model introduces an empirical groove efficiency parameter(Cgr)that regulates the temperature of the above-mentioned flows to represent conventional and direct(LEG,spray bars)lubricant feeding arrangements as well as end-sealed(flooded)or evacuated bearing configurations.This parameter does not depend on the applied specific load or surface speed,for example.Table 3 shows approximate ranges forCgrfor various feeding arrangements and end seal configurations that deliver pad surface temperature prediction which best fit test data in Ref.[15-16].Ref.[18]also presents comparisons of the model predictions to a large size test TPJB.Please consult it.

Tab.3 Recommended approximate range of groove efficiency parameter(Cgr)for various lubrication methods.Symbol★marksCgrmagnitudes recommended for design use.
5 Acknowledgments
The authors thank the support and continued interest of the Texas A&M Turbomachinery Research Consortium(TRC).