
Method for Detecting Fluff Quality of Fabric Surface Based on Support Vector Machine
2020-10-27 08:15LINQiangqiang1JINShoufeng1MAQiurui
LINQiangqiang1,2,JINShoufeng1,2,MAQiurui
1 College of Mechanical and Electrical Engineering, Xi’an Polytechnic University , Xi’an 710048, China2 Key Laboratory of Modern Intelligent Textile Equipment, Xi’an Polytechnic University, Xi’an 710048, China3 College of Fashion and Art of Design, Xi’an Polytechnic University, Xi’an 710048, China
Abstract: In order to improve the accuracy of using visual methods to detect the quality of fluff fabrics, based on the previous research, this paper proposes a method of rapid classification detection using support vector machine(SVM). The fabric image is acquired by the principle of light-cut imaging, and the region of interest is extracted by the method of grayscale horizontal projection. The obtained coordinates of the upper edge of the fabric are decomposed into high frequency information and low frequency information by wavelet transform, and the high frequency information is used as a data set for training. After experimental comparison and analysis, the detection rate of the SVM method proposed in this paper is higher than the previously proposed back propagation (BP) neural network and particle swarm optimization BP (PSO-BP) neural network detection methods, and the accuracy rate can reach 99.41%, which can meet the needs of industrial testing.
Key words: wool fabric; machine vision; support vector machine (SVM) ; optical imaging
Introduction
In recent years, people’s pursuit of clothing style and comfort has been continuously improved. The raising process (such as erosion and brushing) is currently the most commonly used industrial method to change the fabric style and comfort. The fluff fabrics have different styles after fluffing, so manual inspection requires a lot of time and efforts.
At present, machine vision is widely used in various inspection industries[1-3]. At the same time, it is also widely used in the detection of fabric fuzzing and pilling. Dongetal.[4]applied the edge detection algorithm to calculate the area of the pilling area, and used the area as the evaluation level. Maketal.[5]used Gabor function filters that can match multiple levels to detect fabric defects. Jingetal.[6]used mean shift filter algorithm, wavelet transform and neural network fusion algorithm to effectively extract the detailed features of fabric defects. Lietal.[7]used directional gradient histogram and low rank decomposition algorithm to achieve rapid separation of fabric defects, and effectively extracted the features of fabric defects. Yangetal.[8]used the two-dimensional Otsu algorithm to quickly detect fabric defects while effectively retaining the edge information of the fabric image. Heetal.[9]proposed a window skip morphology method for texture fabric defect detection algorithm. The detection speed of this method exceeded 80 m/min, and the defect detection accuracy was 0.1 mm. Kim and Ppar[10]took advantage of the periodicity of the fabric texture and used Fourier transform to transform the fabric image into the frequency domain, and completed the effective segmentation of the fabric surface pilling in the frequency domain. Wangetal.[11]applied wavelet transform and Gabor filtering to realize the segmentation of fabric hairballs. Zhouetal.[12]established the fabric fuzzing and grading evaluation index on the basis of completing the image segmentation of the fabric in the frequency domain. There is less evaluation of the fluffing state of the fleece fabric, and the measurement theory and method are not perfect. Therefore, it has not been widely used in practical industrial production. And in response to the actual needs of a company’s project, it is necessary to test whether the produced fluff fabric is qualified. It is of great significance to propose methods for detecting fluff quality of fabric surface.
Support vector machine(SVM) was the first proposed in Ref.[13]. It is not only suitable for classification, but also for nonlinear regression. The main calculation idea is to use classification hyperplane for classification and regression[14]. It is widely used in different fields such as risk warning[15], fault detection[16], and medical detection[17].
In order to improve the efficiency of fabric inspection, experimental visual inspection replaces manual inspection. In this paper, a rapid recognition inspection is proposed based on the method of SVM classification. We obtained the fabric image through the light-cut imaging and the region of interest by grayscale horizontal projection. Then the edge coordinates of the fabric are decomposed by wavelet transform, using high frequency information as the training data set, the qualified fabric label is 1, and the unqualified fabric label is 0. The fabric is detected through the trained SVM classifier.
1 Technical Solutions
The raising process is the finishing process of the fabric, which directly affects the style and quality of the fabric. Fabric fluffing is a dynamic physical change process. As shown in Fig. 1(a), the raising roller wrapped with the hairpin cloth is circumferentially distributed on the cylinder, and the raised fabric is close to the cylinder, due to the two traction rollers between the cloth. There is a speed difference in the cloth, and the fabric has a certain tension on the surface of the raising roller. The raising roller rotates with the cylinder at the same time as the rotation. Due to the relative movement between the raising roller and the raised fabric, the raising action can be produced. The resulting raised fabric is shown in Fig.1(b), and there are four typical fabrics provided by the company. Among them, sample 1, sample 2 and sample 3 are qualified, which are tested by
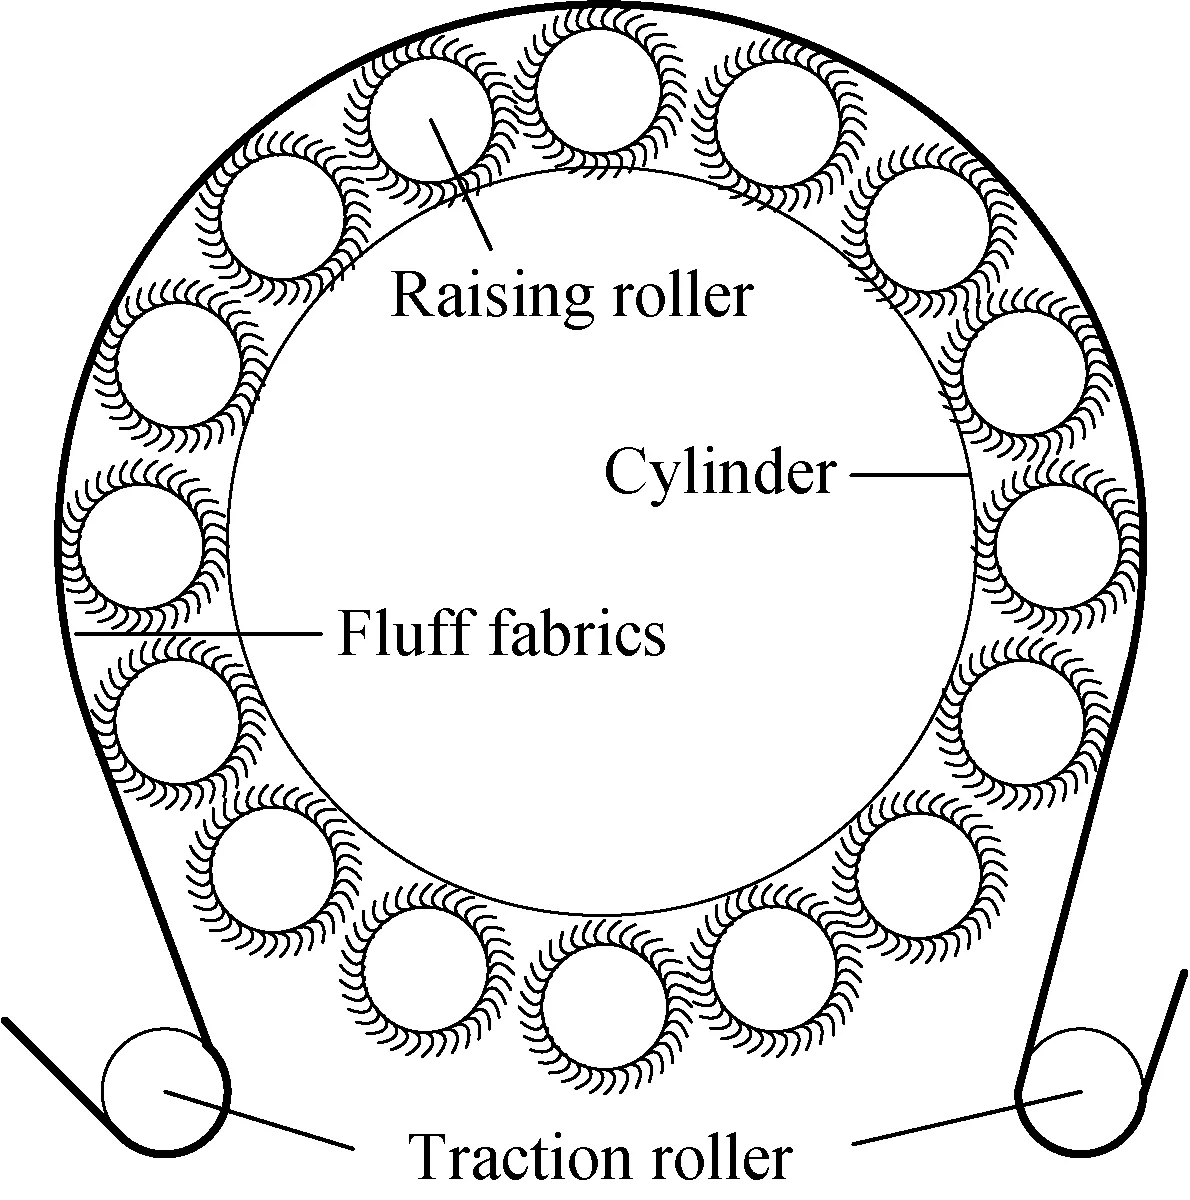
(a) Process of fluff fabric
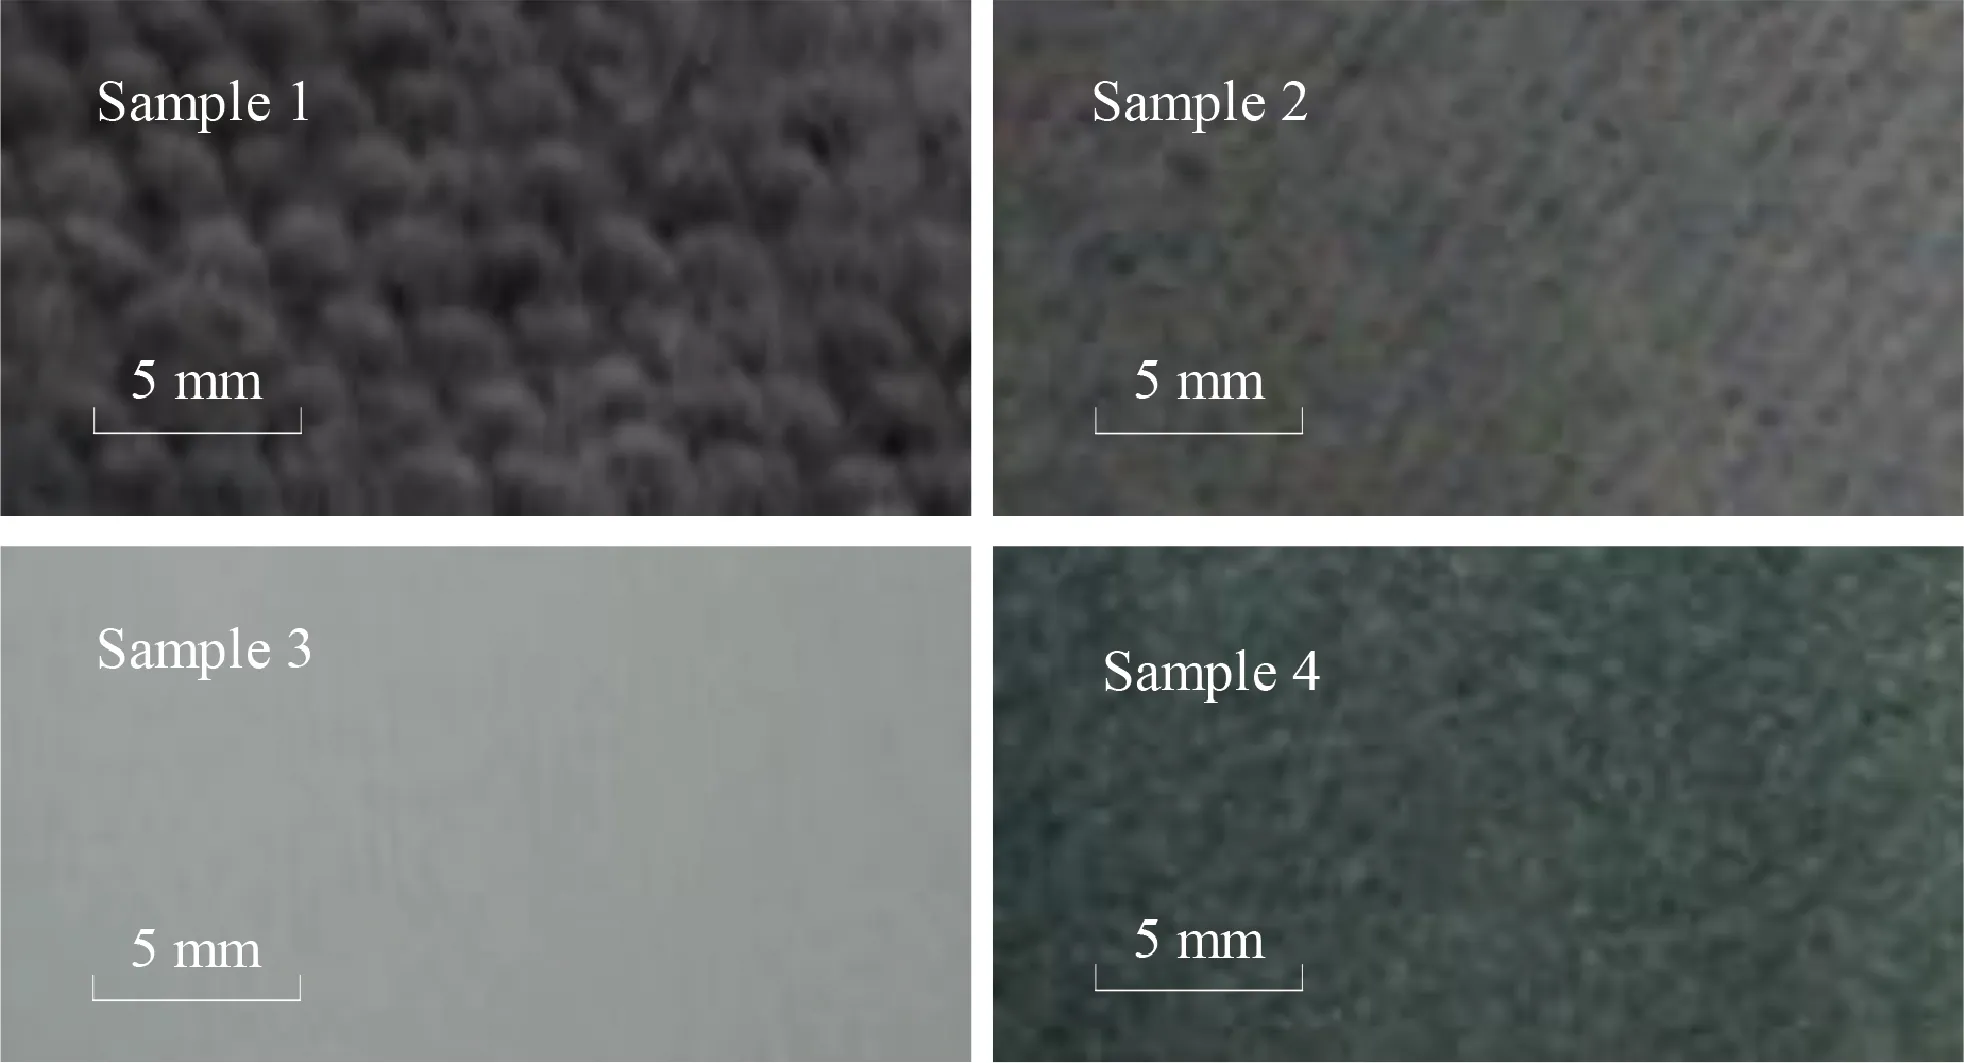
(b)Typical samples provided by enterprises
the enterprise factory, and sample 4 is the unqualified fabric. According to the needs of enterprises, this paper needs to test whether the above four types of fabrics are qualified.
The vision acquisition system uses the AVT GE1050 industrial camera with a resolution of 1 024×1 024 pixels. The lens is a computar lens with a focal length of 8 mm.Through the raising process, the dense fluff with a certain thickness is formed on the surface of the fabric. In order to obtain information on the thickness and distribution of the fluff on the surface of the fabric, the principle of light-cut imaging shown in Fig. 2 is used in this paper. The camera and the strip light source are placed on both sides of the fabric under test. The strip light source is placed directly under the roller to make the light tangent to the axial contour edge of the roller. The use of background light imaging can avoid interference with the surface texture and color characteristics of the fabric. The fabric is coated on the surface of the roller and rotates at a constant speed with the roller. When the film is rotated to the shooting position, the thickness and distribution of the fluff on the surface of the fabric are the most obvious under the tension of the roller. The image size obtained by applying the device is 1 024×1 024 pixels.
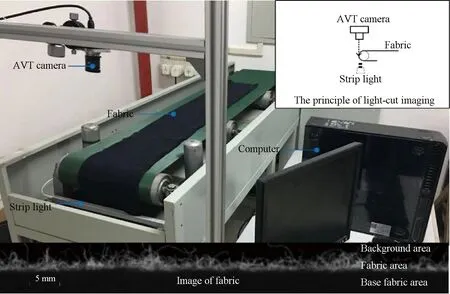
Fig. 2 Principle of light-cut imaging
2 Experiments
2.1 Region of interest extraction
The size of the collected fluff fabric image is 1 024×1 024 pixels, but the fluff fabric only occupies 100 pixels in the vertical direction, and the remaining 924 pixel values of the sound system are all useless areas. The size of the area of interest for extracting the fabric is only 1 024× 100 pixels.
According to the characteristics of the collected fabric image, the gray value of the fluff area is larger than the other areas. This paper uses the accumulation method of the horizontal gray value to obtain the ROI of fluff fabrics. The maximum value of the gray value accumulation is taken as the apex of the crop. The interception process is shown in Fig. 3. The calculation formula of horizontal gray value accumulation is shown as[18]
(1)
whereCk(j) is the grayscale accumulated value,j= 1,2, …,M;Mis the vertical size of the image, andMis 1 024 pixels;fk(i,j) is the gray value at the point (i,j).
2.2 Feature extraction
After obtaining the region of interest in the fabric image, the image is pre-processed by filtering to eliminate noise caused during the acquisition process. After binarizing the image, the principle of Freeman chain code is used to extract the coordinates of the upper edge of the fabric[19]. The binarization process is shown in Fig. 4.
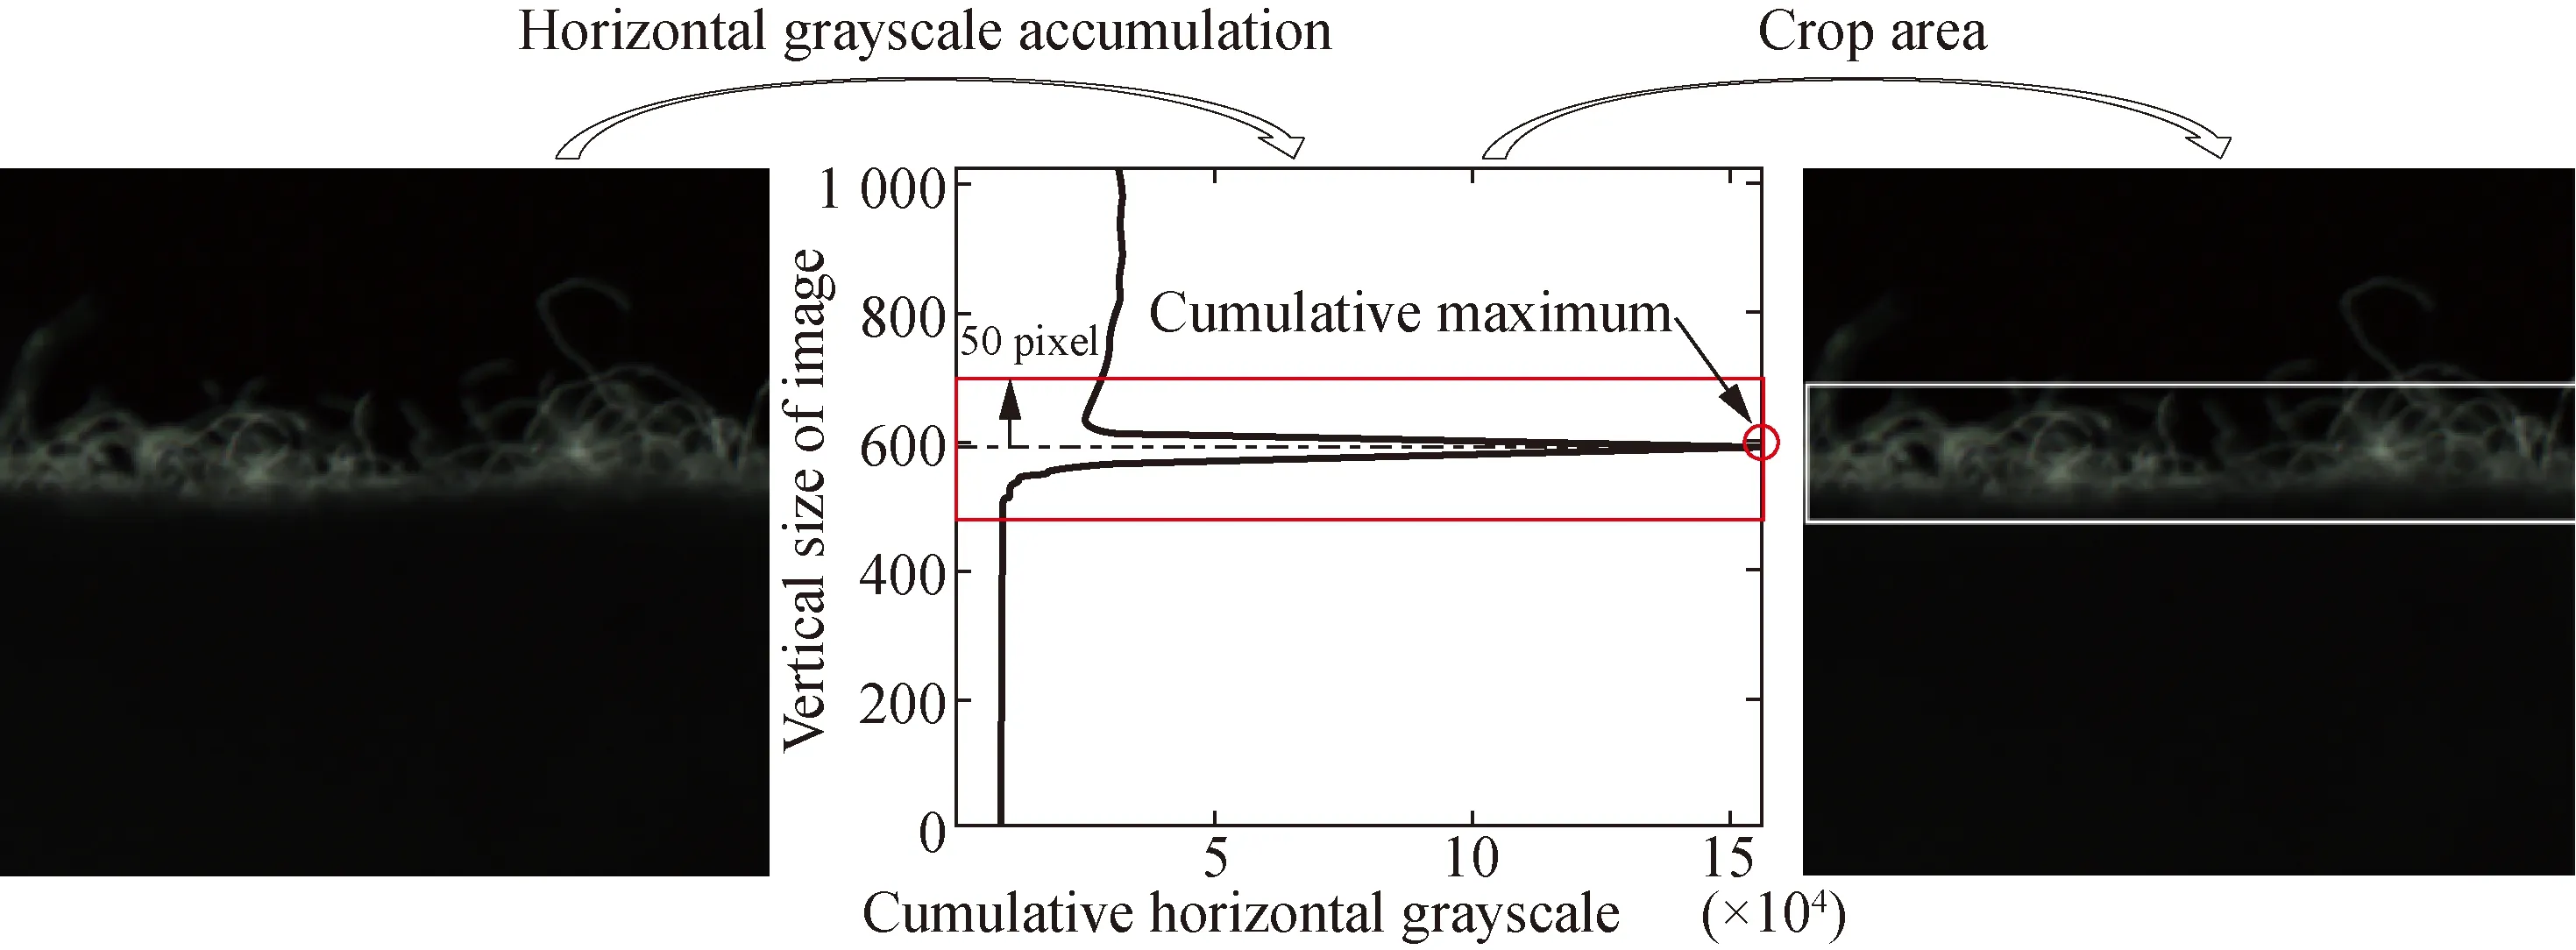
Fig. 3 Region of interest extraction
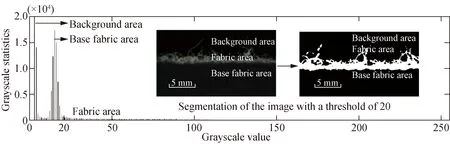
Fig. 4 Grayscale histogram
Wavelet transform plays a very important role in the time domain and frequency domain transform, and wavelet transform also plays a huge role in the image processing process[20-22]. After comparison, the upper edge coordinate features of the fabric are decomposed by wavelet, and the accuracy obtained by using high frequency information to train the neural network is
higher than the coordinate training set[18]. Therefore, this paper continues to use the high frequency information after wavelet transform as the data set. And the label of qualified fabric is recorded as 1. The label of unqualified fabric is recorded as 0. The process of edge information on the fabric of wavelet transform is shown in Fig. 5.
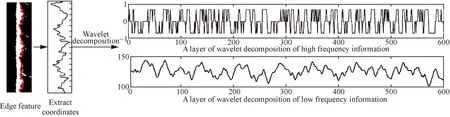
Fig. 5 Wavelet decomposition of edge information
It can be seen from Fig. 5 that, after a layer of wavelet decomposition, the high frequency information is significantly different from the original coordinate information and the low frequency information, the data of the high frequency information is evenly distributed on both sides of 0, and the characteristic fluctuation is obvious. This is because the wavelet analysis breaks the upper edge into two parts: low frequency information and high frequency information. Low frequency information is a slow-changing part; high frequency information is a rapidly changing part (such as jumping from black to white), which reflects the details of image coordinates. Therefore, it is more suitable to train SVM as a training set.
The characteristic of the dbNwavelet is that the order of the vanishing moment increases with the increase of the order (sequenceN), where in the higher the vanishing moment, the better the smoothness, the stronger the localization ability of the frequency domain, and the better the band division effect, and db1 is used as the wavelet base for decomposition[23].
The high frequency information of qualified fabrics and unqualified fabrics is shown in Fig.6. The high frequency information distribution bandwidth of qualified fabrics is narrow, appearing as needles, while the high frequency information bandwidth of unqualified fabrics is wide, appearing as columns. It can be seen from Fig. 6 that the high frequency information of qualified fabrics is evenly distributed, which is quite different from the high frequency information of unqualified fabrics, so it can be identified and detected by SVM.
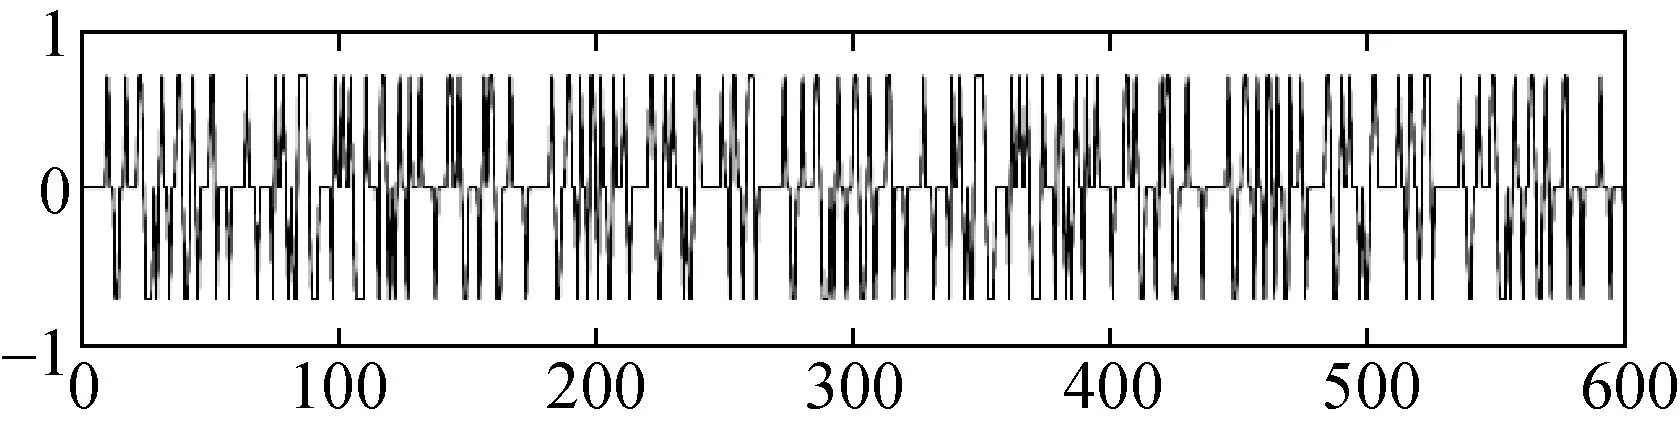
(a) Qualified fabric with db1 filter
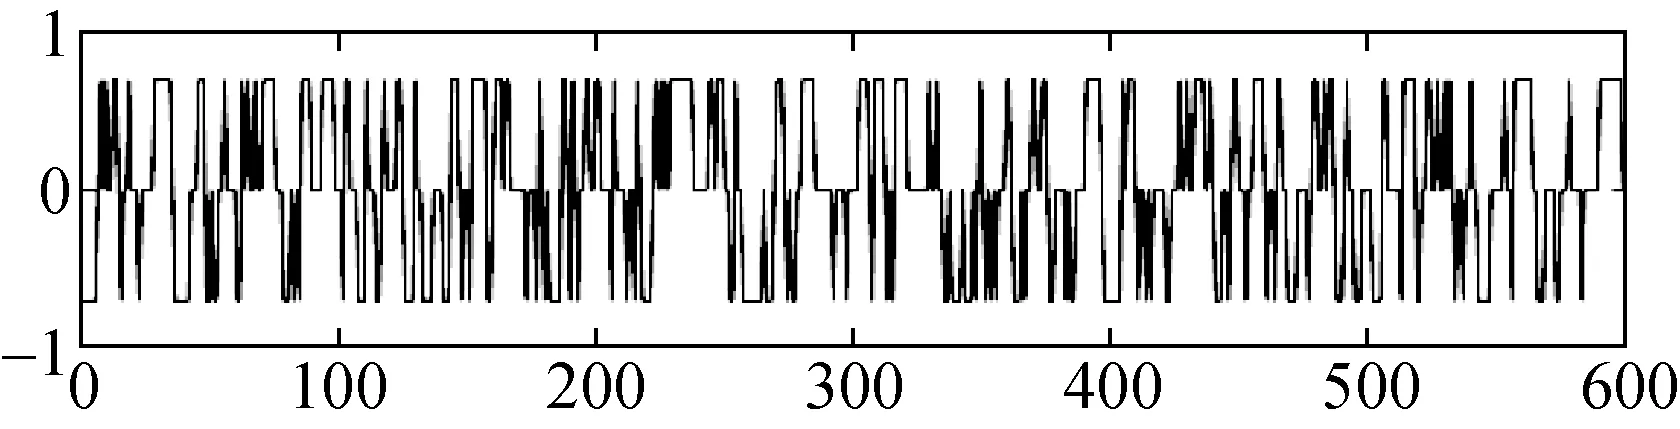
(b) Unqualified fabric with db1 filter
The size of the obtained data set is 2 058×601, of which 200 groups are used for testing, and the remaining part is used as a training group for training.
2.3 SVM detection models
The structure of the SVM is shown in Fig.7. SVM uses the hinge loss function to calculate empirical risk and adds a regularization term to the solution system to optimize structural risk. It is a classifier with sparsity and robustness. SVM can perform non-linear classification through the kernel method, which is one of the common kernel learning methods.
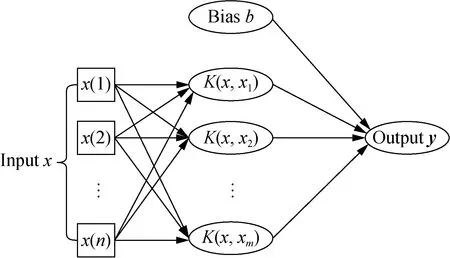
Fig. 7 Structure of SVM
As shown in Fig. 7,bis the bias of SUM andKis the kernel function. There are four main types.
K(x,xi)=(γxTxi+r)p,γ>0,
(4)
K(x,xi)=exp(-γ‖x-xi‖2),γ>0,
(5)
K(x,xi)=xTxi,
(6)
K(x,xi)=tanh(γxTxi+r) ,
(7)
wherer>0. Equation(4) is a polynomial kernel function, Eq. (5) is a radial basis kernel function, Eq.(6) is a linear kernel function, and Eq.(7) is a two-layer perceptron kernel function.
3 Results and Discussion
The svmtrain function in the libsvm toolbox is used for training. The main parameters of this function are kernel function -t, penalty function -c, and kernel function parameter -g. Different kernel functions are used for training, and the results are shown in Table 1.
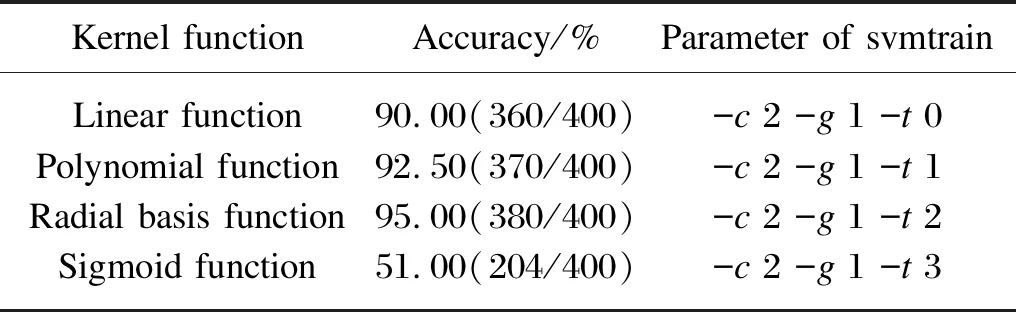
Table 1 Comparison of different kernel functions
In Table 1, we obtain that when the kernel function is radial basis function, the detection accuracy is the highest, but the penalty function -cand kernel function parameter -gare not calculated, and we randomly assign values to -cand -g.
In order to select the optimal kernel function parameter -gand penalty parameter -c, the particle swarm optimization (PSO) algorithm is used to optimize the SVM. The speed parametersC1 andC2 of the PSO acceleration algorithm are 1.5 and 1.7, the number of iterations is 200, and the number of population is 20. The process of PSO to optimize SVM is shown in Fig. 8.
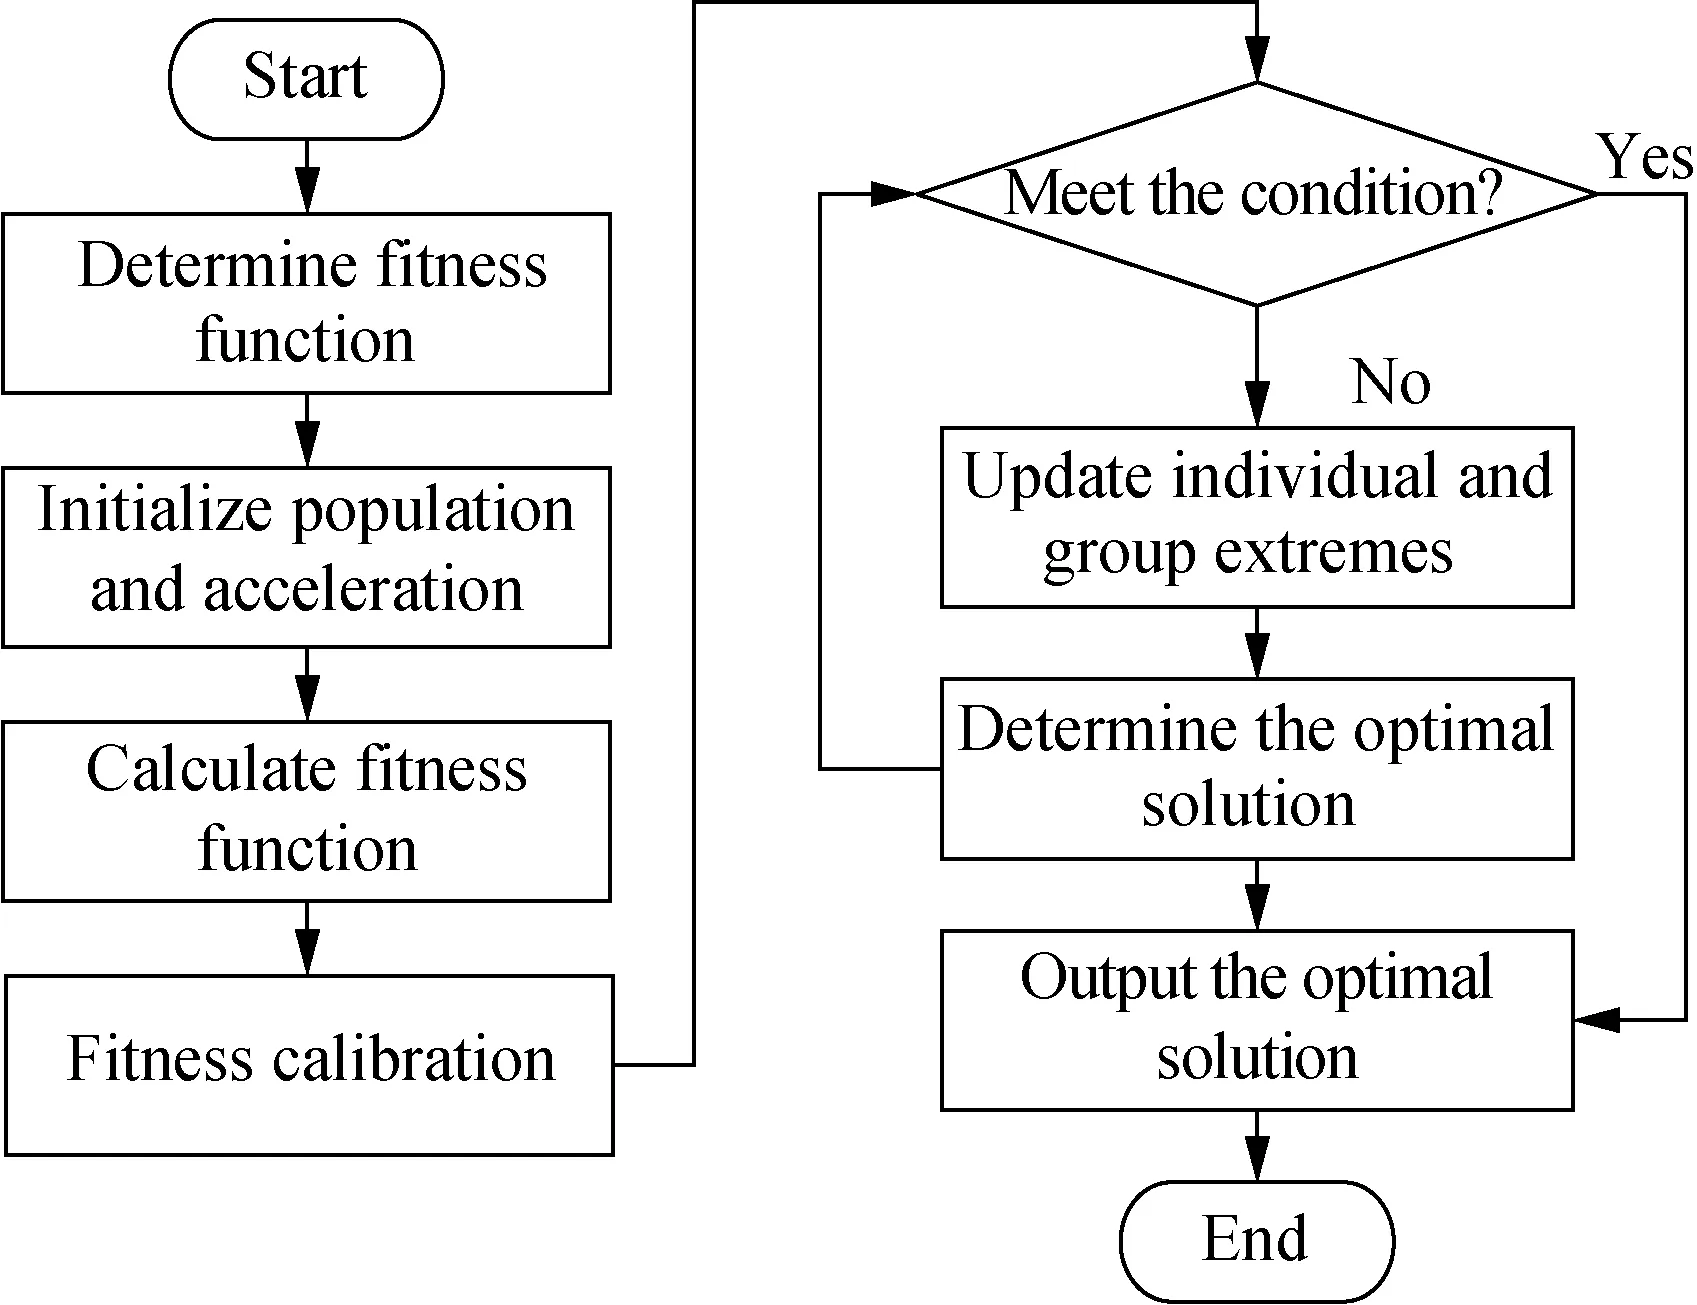
Fig. 8 Optimization process
The PSO process is shown in Fig. 9.
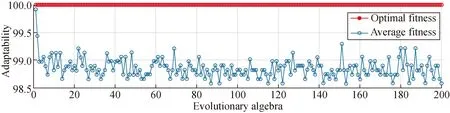
Fig. 9 The best parameter fitness curve
After optimizing the SVM through PSO, it can be obtained that when the SVM training parameter is “accuracy [PSO method] (parametersC1=1.5,C2=1.7, termination algebra=200, population pop=20), best parameter of svmtrain -c=0.281 24, -g=829.314, CV accuracy=100%” , the detection accuracy is the maximum, and the actual classification and predicted classification chart of the test set is shown in Fig. 10.
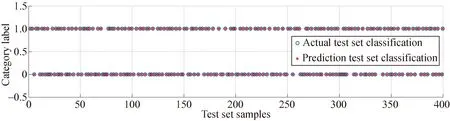
Fig.10 SVM test results
When selecting a data set, this article uses artificially judged fabrics for data collection, and then uses the algorithm proposed in this article to compare the detection results with manual labor. The evaluation criteria are mainly based on manual evaluation results. In the previous research process, we applied the back propagation (BP) neural network and the BP neural network optimized by the PSO algorithm to detect the fluff fabric[23-24]. Although the detection accuracy is high, there are still some errors, so this paper proposes to apply the SVM algorithm for detection . The selected data set is exactly the same as the data set applied by the first two methods. In addition, it only takes 0.001 3 s to detect a single image using the SVM method. The detection accuracy of the three methods is shown in Table 2.
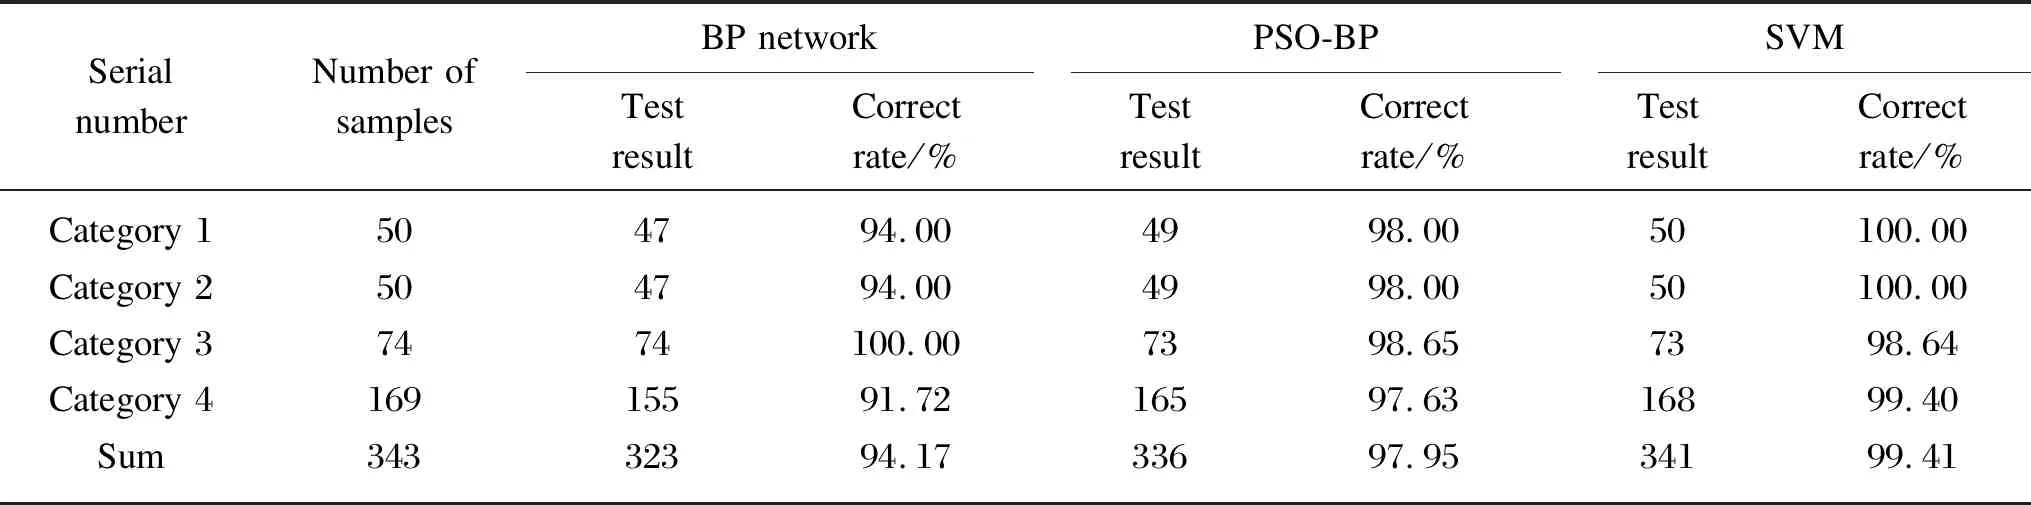
Table 2 Test results for each category
4 Conclusions
In order to improve the detection accuracy of fluff fabrics, this paper proposes the application of SVM classification methods to achieve detection based on previous research. After experimental verification, the SVM classification method proposed in this paper can meet the detection of qualified and unqualified fabrics.
(1) Using the method of gray scale horizontal projection, the maximum position of the projection is taken as the midpoint of the segmentation, and the region of interest of the pile fabric image is obtained. The high frequency information extracted from the upper edge of the fabric is used as a training sample to obtain a training data set.
(2) Construct the SVM classification detection model, mark the label of qualified fabric as 1 and the label of unqualified fabric as 0, and apply PSO to optimize the parameters of SVM to obtain the best training parameters.
(3) After experimental verification, the accuracy of the detection method of SVM proposed in this paper is 99.41%, and the accuracy of detection is higher than that of BP neural network and PSO-BP neural network.
(4) In the following research, we plan to collect pile fabric data under various production conditions, and then apply SVM to classify, in order to achieve faster fabric defect detection. In addition, we plan to collect dynamic data sets and build a three-dimensional model of the fabric to improve the visualization of the fabric.
 Journal of Donghua University(English Edition)2020年4期
- Journal of Donghua University(English Edition)的其它文章
- Preparation of ZnO Nanomaterials and Their Photocatalytic Degradation of Organic Pollutants
- Improved Fibroblast Adhesion and Proliferation by Controlling Multi-level Structure of Polycaprolactone Microfiber
- Zero-Sequence Current Suppression Strategy for Open-End Winding Permanent Magnet Synchronous Motor Based on Model Predictive Control
- Preserving Data Privacy in Speech Data Publishing
- Comprehensive Evaluation Method for Safety Performance of Automobile Textiles
- Undrained Stability Analysis of Three-Dimensional Rectangular Trapdoor in Clay