
Characterization on the formation of porosity and tensile properties prediction in die casting Mg alloys
2022-09-26 03:07ZixinLiDejingLiWenkeZhouBoHuXingfengZhoJingyWngMingQinJingkunXuXioqinZeng
Journal of Magnesium and Alloys 2022年7期
Zixin Li,Dejing Li,*,Wenke Zhou,Bo Hu,Xingfeng Zho,Jingy Wng,Ming Qin,Jingkun Xu,Xioqin Zeng,c,*
a National Engineering Research Center of Light Alloy Net Forming,School of Materials Science and Engineering,Shanghai Jiao Tong University,800 Dongchuan Road,Shanghai 200240,China
b Hitachi(China)Research & Development Corporation,Rui Jin Building,No.205 Maoming Road(S),Shanghai 200020,China
c The State Key Laboratory of Metal Matrix Composites,Shanghai Jiao Tong University,800 Dongchuan Road,Shanghai 200240,China
Abstract The 3D visualization of the porosity in high-pressure die casting(HPDC)Mg alloys AZ91D and Mg4Ce2Al0.5Mn(EA42)was investigated by X-ray computed tomography.It was demonstrated that the volumetric porosity at the near-gate location for alloy EA42 was significantly higher than that far from the gate location.This difference resulted from the low valid time during intensified casting pressure conditions.Specimens of alloy EA42 exhibited a narrow pore distribution in the side view(~0.5mm)compared to the wide distribution(~1.8mm)of alloy AZ91D,which was mainly attributed to the formation mechanism of the defect band.The formation of microporosity in the defect band of alloy EA42 was inhibited because of the significant latent heat released by a large amount of the Al11Ce3 phase segregated in the defect band during solidification.Additionally,an effective estimator(Z-Propagation)was introduced,which is proposed to predict the projected area fraction of the porosity(f)involved during tensile failure with better effectiveness compared with traditional methods based on the actual fractured surface.By coupling the Z-Propagation method with the critical local strain model,the logarithmic fracture strain and true fracture stress of the specimens were predicted within 3.03% and 1.65% of the absolute value of the average relative error(AARE),respectively.
Keywords:High-pressure die casting;Porosity;Tensile property;Magnesium alloy;X-ray computed tomography.
1.Introduction
Mg alloys have applications in aerospace,military,electronic communication,transportation and other fields due to their low density,high specific strength,and high shock absorption,among other advantages[1,2].In light of the global shortages in iron,aluminum,zinc,and other metal resources,Mg has emerged as an abundant engineering material,with a low price and other product advantages.High-pressure die casting(HPDC)remains the most efficient technology for the development of Mg alloys.However,in the conventional HPDC process,some unique microstructures,such as external solidified crystals(ESCs)[3–8],are incubated in the shot sleeve at the slow shot stage and defect bands are formed in the cavity at the end of the filling[9–16].Laukli et al.[5]found that the presence of ESCs could be attributed to the pre-solidification of the melt in the shot sleeve at the early stage of the HPDC process,and tended to aggregate in the center of the casting,resulting in microstructure inhomogeneity[8].The formation mechanism and characteristics of the defect bands in Mg-Al and Al-Si based alloys have been studied by Dahle et al.[9,10,14,15,17].During the filling pro-
cess,ESCs gather toward the center due to the force of liquid metal flow.In addition,during the solidification process,liquid metal solidifies from the center towards the cavity surface adhered to ESCs.Then,the solidification front of the residual liquid metal near the cavity surface moves forward to the center of the casting due to the chilling effect of the mold.Last,shrinkage occurs due to the lack of liquid metal feeding in the final solidification area where the two solidification fronts meet.At this time,a band-like microstructure is formed parallel to the cavity surface with micropores and macrosegregations aggregated.These unique microstructures are one of the main factors that affect the formation and distribution of pores,affecting the mechanical properties of the casting.For example,Li et al.[3,4]pointed out that the presence of ESCs could lead to the formation of shrinkage pores.In this case,these pores would act as crack initiation site,and the crack would propagate along the grain boundaries of ESCs.In addition,Li et al.[11,13]reported coarse ESCs would promote the formation of defect bands,composed of several micropores and macrosegregations.These micropores would play a role in crack propagation route and accelerate the fracture of the specimen.Moreover,Song et al.[18]detected that cracks tended to originate from large pores or cluster micropores during in situ tensile test of HPDC AM50 alloy.Thus,in recent decades,researchers have attempted to relate the porosity of die casting Al and Mg alloys to their tensile properties.It has been posited that the projected area fraction of the porosity(f)on the fracture surface is the main factor affecting the tensile properties.For example,Cáceres considered no relationship between the tensile properties and the volumetric porosity in Al-Si-Mg alloys.Instead,they argued that the tensile properties monotonously decreased with increasingf[19].The study showed that the tensile properties of these alloys can be calculated by a critical local strain model based on the porosity of the fracture surface.Accordingly,some researchers have attempted to correlate the failure of samples with the measurement offusing a quantitative fractography method.However,precisely measuringffrom an uneven fractured surface is challenging.Hence,Weiler et al.[20]predicted the tensile fracture strain and the tensile fracture stress from the critical local strain model in die casting AM60B alloy with an error range of 22% and 11%,respectively,using the tomographic plane containing the maximumfperpendicular to the principal stress axis.These errors may stem from neglect of the complex three-dimensional morphology of the pores,since it may seem unreasonable to assume thatfin tensile failure will lie on a two-dimensional tomographic plane.Using this plane is likely to result in an underestimation of the true value off.Recently,a novel estimator(Z-Project)[21]was proposed to estimatefusing a series of superimposed images within a specified distance ofalong the principle stress axis,whereis the tomographic plane containing the maximum projected area of the porosity.Unfortunately,this is often problematic because it is hard and tedious to precisely capture such a tomographic plane using countless images.A better modified approach is therefore needed for the estimation off.

Fig.1.Geometric sketch of the critical local strain model.
The critical local strain model was established by Ghosh,and considers only one sphere as the imaginary pore in ductile metal specimens[22].Cáceres[23]predicted the fracture stress of Al7Si0.4Mg cast alloy based on this model using the geometry shown in Fig.1.The cuboid is the gauge length portion of a tensile specimen,whereA0is the cross-sectional area of the gauge length andAiis the area of the section containing a pore reduced by a fraction,f.The static force equilibrium is satisfied after applying the axial tensile forceF:

whereσi,εiandσh,εhare the true stress and logarithmic strain within the pore region(subscript i)and the homogeneous stress and strain outside the pore region(subscript h)[24].For most ductile metals,the tensile curves can be fully expressed by constitutive equations,and defined as;

whereσandεare the true stress and logarithmic strain,respectively.The valuenrepresents the strain hardening exponent,andKis a constant.The effect of strain rate was ignored in this work.Substituting Eq.(2)into Eq.(1)gives Eq.(3)below:

Eq.(3)gives the strain within the pore region,εi,as a function of homogeneous strain,εh,when the values offandnare obtained.Therefore,according to Eq.(3)and the model,a section containing a pore will reach the logarithmic fracture strain earlier because of the reduced effective bearing area.In other words,the tensile specimen loses its energy when the logarithmic strain within the pore region reaches the critical logarithmic strain.The strain outside the pore(homogeneous strain),εh,is the measured strain from the tensile test[25],in which case can be calculated whenεireaches the critical logarithmic strain.

Fig.2.Schematic diagram of(a)a casting and(b)a tensile specimen.

Fig.3.An effective f estimator along the maximum crack propagation path range for alloy EA42:(a)photograph of the maximum crack propagation path,(b)3D reconstructed model with the same maximum crack propagation path as Fig.3(a)and(c)overview of the Z-Propagation method.
Subsequently,the logarithmic fracture strain,εf,can be obtained for any values offandn.It follows that the true fracture stress(true ultimate tensile strength),σf,can also be obtained from:

whereσ*andε*are the average true ultimate tensile strength and the critical logarithmic strain of all sound specimens,respectively.

Fig.4.True stress-strain curve of a sound specimen obtained from alloy EA42.
An alloy system with high thermal conductivity and excellent ductility,which was systematically studied in our previous work,with the nominal composition(in wt.%)Mg4CexAl0.5Mn(x=0,1,2,3,4,5,6)was developed based on the influence of the alloying element on the thermal and tensile properties.With the Al content increasing from 0wt.% to 2wt.%,the thermal conductivity decreased slightly while the elongation rapidly increased.With further increase of the Al content,the thermal conductivity dropped quickly while the elongation slowly decreased.Thermal conductivity is mainly determined by the content of solute atoms while the remarkable improvement of ductility was due to the optimization of the second phase type and the morphology[26].Thus,the new alloy,designated as“EA42”,exhibits an excellent comprehensive performance(high ductility[27]and high thermal conductivity[28]),with great potential in communications and automobile applications,compared with commercial AZ91D Mg alloys[29–31].However,the application of alloy EA42 to thin-walled communication devices did not exhibit the excellent ductility in trial production as reported previously[27].We found that porosity is the main factor affecting its performance.Thus,relevant research must be conducted to investigate the porosity of such alloys.Recently,it was determined that the pore distribution of alloy EA42 was different from that of AZ91D.Therefore,comparative analysis the pore distributions of the two alloys would make a contribution to the in-depth understanding the formation mechanism of the porosity on alloy EA42,as well as its tensile properties.
The development of X-ray computed tomography(XCT)techniques enables us to characterize the three-dimensional microstructure without any damage to the sample.Accordingly,in this work,the first section was dedicated to comparatively characterizing the visualization of the porosity of alloys EA42 and AZ91D using XCT techniques.The second section presents an effectivefestimator to alleviate the spatial constraints,which,coupled with the critical local strain model,was used to predict the tensile properties of die casting EA42 alloy containing natural pores.
2.Experimental procedure
2.1.Specimen preparation
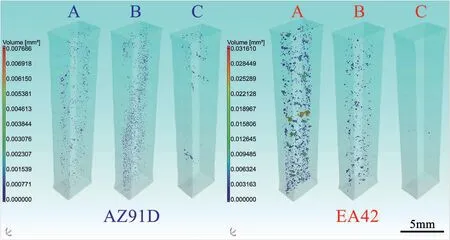
Fig.5.The 3D visualization of the porosity of the tensile specimens within the gauge region of alloys AZ91D and EA42 at locations A,B,and C.
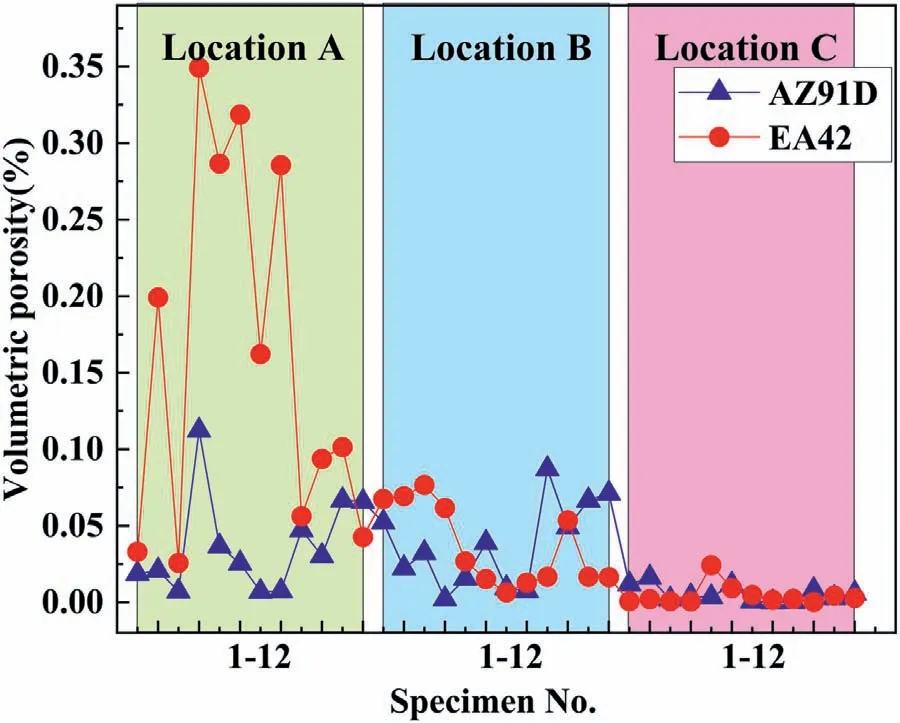
Fig.6.Volumetric porosity of all specimens in the gauge region described at locations A,B,and C.
The castings of alloys EA42 and AZ91D were prepared by a horizontal cold chamber die casting machine(TOYO/BD-350V5).The chemical composition of the two alloys was determined by inductively coupled plasma optical emission spectrometer(ICP-OES,PerkinElmer Optima 8300),and the results are listed in Table 1.The schematic diagram of the casting and corresponding process parameters are shown in Fig.2(a)and Table 2,respectively.The tensile specimens with a gauge length of 15mm long,3.5mm wide,and 2.5mm thick used in this work were taken from the rectangular frames marked in red in Fig.2(a).The geometry and dimensionsare shown in Fig.2(b).The tensile specimens(36)were taken from 6 castings of each alloy,and divided into three groups(A/B/C,12 in each group)according to the position in Fig.2(a),and numbered“AZ91D/EA42-(A–C)-(1–12)”.Location“A”was closest to the inner gate and location“C”was farthest away.
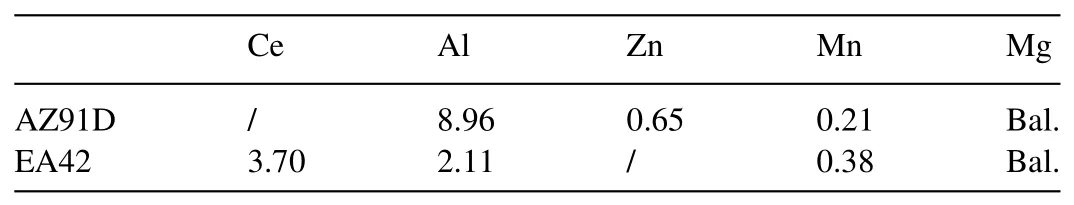
Table 1Chemical composition of alloys used in this work(wt%).
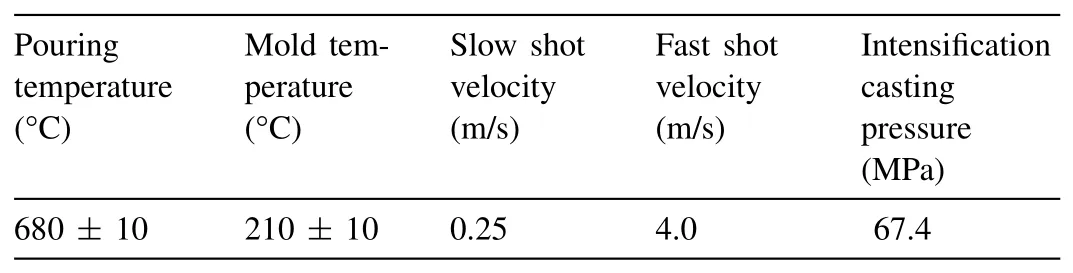
Table 2HPDC processing parameters adopted in this work.

Table 3Detailed values of the predicted and experimental results in Fig.11.
2.2.X-ray Computed Tomography(XCT)
All XCT experiments were conducted in the YingHua Non-Destructive Testing Laboratory(Shanghai,China),using a 300kV voltage and 500W power micro CT scanner(phoenix V|tome|x m).The specimens were scanned with a beam energy of 205kV/20.5W and the voxel size was 12.8μm.Specimen regions were reconstructed with 2D scanning slice images using VG Studio Max 3.3 software.The parameters of the identified pores(diameter,volume,sphericity,surface area,among others.)were extracted from this software.
2.3.Tensile test and microstructure characterization
After the XCT inspection,tensile tests were performed on the specimens described above at a 0.5mm/min cross-head separation rate and with a monotonically increasing load at room temperature,using a Zwick/Roell test machine.The microstructure analysis was performed on a scanning electron

Fig.7.Pore distribution in the side view of two representative specimens within the gauge region obtained from XCT results:alloy(a)AZ91D and(b)EA42.

Fig.8.Volumetric porosity of the specimens in Fig.7 from the centerline to the cavity surface.
microscope(SEM,Hitachi SU-70)coupled with an Energy Dispersive Spectrometer(EDS).Optical microscopy(OM,Zeiss Axio Observer A1)was used to observe the microstructure after the specimens were mechanically ground,polished,and etched with a special etchant for Mg alloys(4mL nitric acid and 96mL alcohol)for 5s.
2.4.Estimating f based on the crack propagation path
Considering the inherently complex three-dimensional morphology of the pores,it may seem unreasonable that a two-dimensional tomographic plane could be used to determinef.Thus,a more effective estimator(Z-Propagation)is presented to overcome spatial constraints,in which several images within the maximum crack propagation path range are superimposed to estimate the value off.The specific methods are as follows.First,the specimens were marked in the gauge region with an interval of 1mm before tensile testing.Then,after the tensile test,the actual maximum crack propagation path of the specimen(shown in Fig.3(a))was found and reconstructed by the 3D model obtained using VG Studio Max 3.3 software.Fig.3(b)shows the reconstructed image of a specimen with the same maximum crack propagation path as that of the specimen in Fig.3(a),marked with a red curve.The segmentation ability of this software was used to cut the model along the maximum crack propagation path(outlined with blue in Fig.3(b))and obtain new 3D data.Finally,twodimensional slice images perpendicular to the principal stress axis from the new 3D data were extracted with an interstitial spacing of 26μm.Then,all images were superimposed onto a single image as shown in the bottom image of Fig.3(c)andfwas estimated from it.
2.5.Critical local strain model
In order to describe the strain hardening behavior of alloy EA42,a region without porosity was found at location A in the casting and machined to act as a sound specimen.The XCT results confirmed that no pores were detected inside the machined specimen.The true stress-strain curve is shown in Fig.4.The strain hardening exponent,n,was obtained from the true stress-strain curve within the region of uniform plastic deformation,i.e.,from the region of yielding to the maximum load of a sound specimen according to the log-log scale,which was converted from Eq.(2):

wherencan be measured as the slope of the fitted line.

Fig.9.Characterization of the microstructure of the specimens in the transverse section at location A along the flow direction:(a)Overall view of alloy AZ91D,(b)Microstructure of the surface of alloy AZ91D,(c)Microstructure of the center of alloy AZ91D,(d)Microstructure of the defect band of alloy AZ91D at a higher resolution,(e)Overall view of alloy EA42,(f)Microstructure of the surface of alloy EA42,(g)Microstructure of the center of alloy EA42 and(h)Microstructure of the defect band of alloy EA42 at a higher resolution.

Fig.10.Logarithmic strain within the pore region(εi)as a function of logarithmic strain outside the pore region(εh)with the projected area fraction of the porosity in the range of 0 to 13% for alloy EA42.
3.Results
3.1.Characterization on the formation of porosity
Fig.5 depicts a 3D visualization of the porosity of six representative tensile specimens within the gauge region of these two alloys.Statistically,the volumetric porosity in alloy EA42 at location A was significantly high,and then,decreased monotonically with increasing distance to the gate.On the contrary,the pores in alloy AZ91D were relatively uniform,distributed across the three positions,as shown in Fig.6.
Interestingly,alloy AZ91D had a wider pore distribution(~1.8mm)in the side view,however,alloy EA42 was clustered(~0.5mm)in the center(Fig.7).Additionally,Fig.8 shows the distribution of the volumetric porosity of the specimens in Fig.7 from the centerline to the cavity surface.Statistically,the volume porosity levels of the two alloys decreased substantially from the centerline to the cavity surface.However,in the distance range from 0.75 to 1mm,the volume porosity level of alloy AZ91D showed a leaping increase but pores in alloy EA42 existed near the centerline,with only a few pores present in the remaining positions.Thisphenomenon is confirmed in Fig.9.As shown in Fig.9(a)and(d),microporosity and macrosegregation were found at the defect bands(marked in yellow lines),with micropores interconnected,which is in good agreement with previous reports on Mg-Al based alloys[9–13,16].On the contrary,only macrosegregation was observed in the defect bands of alloy EA42,and microporosity was hardly detected,as shown in Fig.9(e)and(h).
3.2.An effective f estimator(Z-Propagation)based on the critical local strain model
According to the fitted line in Eq.(5),the strain hardening exponent of alloy EA42 was found to be 0.24.Using the critical local strain model,the sections containing the pores will reach the critical logarithmic strain first due to the reduced effective force area.In other words,the fracture will occur whenever the logarithmic strain within the pore region reaches the critical logarithmic strain.Measuring the sound specimen of alloy EA42,the critical logarithmic strain was found to be 8.58%.
Considering that Eq.(3)is an implicit function,and therefore has a zero point of function(Fzero),it can be solved with Matlab software.As a result,Fig.10 showsεiplotted againstεh,with annvalue for alloy EA42 infranging from 0 to 13%.For any givenf,the logarithmic fracture strainεfcan be obtained as the intercept using the critical logarithmic strain described above.The relationship betweenfand the calculated results(εf,σf)can be plotted according to Eq.(4).Because of the large number of two-dimensional slice images,theZ-Propagationmethod requires a lot of effort and resources;therefore,only specimens obtained from location A were analyzed in this work.Fig.11 shows the logarithmic fracture strain(εf)and the true fracture stress(σf)plotted against the projected area fraction of the porosity(f),for both the predicted results calculated by the model and the experimental results.Detailed values of the predicted and experimental results in Fig.11 are list in Table 3.It can be observed that the predicted results fitted the experimental data points well with an absolute value of the average relative error(AARE)[24]of 3.03% for the logarithmic fracture strain and 1.65% for the true fracture stress,revealing the feasibility of theZ-Propagationmethod to estimatef.
4.Discussion
4.1.Formation mechanism of porosity in die casting AZ91D and EA42 alloys
The difference in the 3D visualization of the porosity of the two alloys is attributed to the different solidification patterns.Firstly,such a difference reflected discrepancies in the freezing temperature range(FR).The FR of the alloys were calculated based on the CALPHAD method through the Scheil model in the Thermo-calc software,as shown in Fig.12[32,33].Combined with previous calculations performed in Pandat’s Mg database,the FR in alloys AZ91D and EA42 were determined to be 180°C and 75°C,respectively,evincing that the FR of alloy AZ91D was almost as twice as that of alloy EA42[28,34].During intensified casting pressure conditions,the inner gate was briefly closed in the high-temperature range due to the small FR of alloy EA42.At the end of the injection stage,high-temperature liquid metal was present near the gate,which favored the formation of pores due to lack of liquid metal feeding during solidification.This led to a high porosity near the inner gate region of alloy EA42(see Fig.5).In contrast,alloy AZ91D remained in the liquid-solid phase region due to its large FR,which allowed for sufficient time to intensify casting pressure,resulting in a uniformly distributed low porosity level.
Secondly,the different solidification patterns were reflected in the discrepancy of the defect bands.Therefore,a detailed analysis of the microstructure of the defect bands is indispensable.Fig.13(a)and(b)present the SEM images of these alloys in the defect band regions,outlined in red,and their corresponding EDS elemental mapping regions outlined in yellow.Microporosity can easily be detected in alloy AZ91D,but hardly observed in alloy EA42,as demonstrated in Fig.13(i)and(j).The EDS elemental mapping results indicate that the defect band region was enriched with Al and Ce particles.Moreover,it was determined that these particles correspond to the Mg17Al12phase[35,36]in alloy AZ91D and the Al11Ce3phase[27,28]in alloy EA42,according to previous reports.Additionally,a reasonable explanation was that no microporosity was found in the defect bands of alloy EA42 because of the difference in the enthalpy of mixing of the Mg-Al(~-3KJ/mol)and the Al-Ce systems(~-32.6KJ/mol)[27].Negative enthalpy of mixing values favor the formation of intermetallic phases rather than solid solutions.In other words,the enthalpy of mixing of the Al11Ce3phase is more negative than that of the Mg17Al12phase,which indicates that Al11Ce3intermetallic phases are more likely to be formed under the same conditions.Moreover,the more negative the enthalpy of mixing between the two elements,the higher thermal stability of the formed intermetallic phase[37–39],i.e.,more latent heat will be released during the formation process.

Fig.11.Predicted and experimental(a)logarithmic fracture strain(εf)and(b)true fracture stress(σf)plotted against the projected area fraction of the porosity(f)of alloy EA42.

Fig.12.Scheil simulation results of the freezing temperature range(FR)of alloys AZ91D and EA42.
According to the filling theory of HPDC,the defect band region containing the remaining melt is the last area to be solidified[9,10,12,14,15].Therefore,microporosity can easily be formed since this area lacks sufficient liquid metal feeding in Mg-Al die casting alloys[9–13,35].However,a large amount of Al11Ce3particles were segregated in the defect bands and released significant latent heat,which improved the feeding process of the local solidifying microstructure from the remaining melt.Therefore,no clear pores were observed in the area outside the center for alloy EA42.

Fig.13.EDS elemental mapping analysis of alloys AZ91D and EA42 at the defect bands:(a)SEM images and EDS elemental mapping region of AZ91D(outlined in yellow),(b)SEM images and EDS elemental mapping region of EA42(outlined in yellow),(c)Al map for AZ91D,(d)Al map for EA42,(e)Zn map for AZ91D,(f)Ce map for EA42,(g)Mn map for AZ91D,(h)Mn map for EA42,(i)SEM images in the defect band of alloy AZ91D shown with a higher resolution and(j)SEM images in the defect band of alloy EA42 shown with a higher resolution.

Fig.14.Schematic illustration of the three stages of the formation mechanism of the defect band in the two alloys:(I)filling,(II)nucleation and(III)solidification.
The formation mechanism of the defect bands in the two alloys is schematically illustrated in Fig.14.The formation of the microstructure in die casting is mainly divided into three stages:filling,nucleation,and solidification.During the filling process,the force of the metal fluid pushed the ESCs particles toward the center of the cavity,which were subsequently distributed in the center of the casting during the fast shot stage.Then,in the nucleation process,the molten metal in the center of the cavity started to solidify around these ESCs particles,and the liquid-solid interface translated from the center to the surface of the cavity.At the same time,the remaining molten metal immediately solidified to form a skin layer after contacting the wall of the mold.Another solidification process was initiated from the surface of the cavity to the center due to heat transfer from the metal.In the last process,the two liquid-solid interfaces formed a defect band at the position where the die casting finally solidified.Therefore,microporosity can be detected in the defect band of alloy AZ91D but was hardly observed in alloy EA42 due to the difference in the latent heat between the Mg17Al12and Al11Ce3phases.
4.2.The validity of the Z-Propagation method based on the critical local strain model
Fig.15 shows tensile properties plotted against the volumetric porosity for specimens obtained from location A of alloy EA42.There exists little correlation between the decrease in tensile properties and the volumetric porosity content.However,in Fig.11,an inverse parabolic relationship between the tensile properties andfobtained from theZPropagationmethod was observed.The tensile properties dropped monotonically with an increase off.In other words,the largerf,the lower the tensile properties of the specimens were.

Fig.15.Relationship between volumetric porosity and tensile properties of alloy EA42 obtained from location A.

Fig.16.Projected area fraction of the porosity(f)estimated from a representative specimen using(a)the actual fractured surface,and(b)the ZPropagation method.
On the other side,Fig.16(b)illustratesfestimated from a representative specimen using theZ-Propagationmethod,which demonstrated an extremely similar contour to the pores of the fractured surface shown in Fig.16(a),confirming the validity of theZ-Propagationmethod.Moreover,measuringfprecisely from a bumpy fracture surface is challenging.The regions of the fracture surface that contain intact dendrites are essentially the areas occupied by the shrinkage pore.Gas pore can be easily identified because of their round structure with a smooth inner surface[40].Therefore,the contrast between the pores and the tearing edges or the dimples is very small on the fracture surface,so it is difficult to discriminate between them based on the gray value on the fracture surface.However,several two-dimensional slice images obtained from the XCT results can be used to easily discriminate pores using the threshold segmentation ability of VG Studio Max 3.3 software,therefore eliminating the influence of uneven factors on the fracture surface.Moreover,compared with theZ-Projectmethod proposed by Lordan et al.[21],theZ-Propagationmethod has demonstrably estimatedfmore efficiently because there is no need to capture the tomographic plane containing the maximum projected area of the porosity.Then,it should be noted that theZ-Propagationmethod is more applicable for specimens without obvious necking behavior during tensile test because the size and morphology of the pores change after the specimens undergo necking.
5.Conclusion
In this study,the 3D visualization of the porosity of alloys AZ91D and EA42 were comparatively characterized by XCT.In concert,an effective estimator(Z-Propagation)was proposed to predict the projected area fraction of the porosity.The validity of the estimator was investigated based on the relationship between the porosity and the tensile properties of alloy EA42.The main conclusions can be summarized as follows:
(1)The volumetric porosity at the near gate location for alloy EA42 was significantly higher than that at other locations because of the low valid time during the intensified casting pressure conditions,while pores formed in alloy AZ91D were uniformly distributed in the castings.
(2)Alloy AZ91D exhibited a wider pore distribution(~1.8mm)in the side view,however,those of alloy EA42 were clustered(~0.5mm)in the center.This difference was mainly attributed to the formation mechanism of the defect band.The formation of microporosity in the defect band of alloy EA42 was inhibited because of the significant latent heat released by the Al11Ce3phase segregated in the defect band during solidification.
(3)An effective estimator(Z-Propagation)was proposed to predict the projected area fraction of the porosity(f).Compared with the traditionalfestimating method based on the actual fractured surface,theZ-Propagationmethod can easily discriminate pores using the threshold segmentation ability of VG Studio Max 3.3 software and eliminate the influence of uneven factors on the fracture surface.By coupling theZ-Propagationmethod with the critical local strain model,the logarithmic fracture strain and true fracture stress were predicted within
3.03% and 1.65% of AARE,respectively.
Data availability
The raw/processed data required to reproduce these findings cannot be shared at this time as the data also forms part of an ongoing study.
Declaration of Competing Interest
The authors declare that they have no known competing financial interests or personal relationships that could have appeared to influence the work reported in this paper.
Acknowledgments
This work was financially supported by the Major Science and Technology projects in Qinghai province(2018-GX-A1)and Shanghai Science and Technology Committee(No.18511109302).The National Key R&D Program(No.2016YFB0301002)supported by the Ministry of Science and Technology of China is also acknowledged.This work was co-funded by the National Natural Science Foundation of China(No.51825101).The author would also like to extend sincere gratitude to Dr.Jingya Wang for guidance in thermodynamic calculation.
 Journal of Magnesium and Alloys2022年7期
- Journal of Magnesium and Alloys的其它文章
- High-performance magnesium-based thermoelectric materials:Progress and challenges
- Effects of heat treatment on the corrosion behavior and mechanical properties of biodegradable Mg alloys
- Multi-solute solid solution behavior and its effect on the properties of magnesium alloys
- Calcium phosphate conversion technique:A versatile route to develop corrosion resistant hydroxyapatite coating over Mg/Mg alloys based implants
- The role of solutes in grain refinement of hypoeutectic magnesium and aluminum alloys
- Biomass-derived carbon doping to enhance the current carrying capacity and flux pinning of an isotopic Mg11B2 superconductor