
Hand-feel soil texture observations to evaluate the accuracy of digital soil maps for local prediction of soil particle size distribution:A casestudy in Central France
2023-10-16 13:27AnneRICHERdeFORGESDominiqueARROUAYSLauraPOGGIOSongchaoCHENMarineLACOSTEBudimanMINASNYZamirLIBOHOVAPierreROUDIERVeraMULDERHervLECGuillaumeMARTELET0BlandineLEMERCIERPhilippeLAGACHERIEandHocineBOURENNANE
Pedosphere 2023年5期
Anne C.RICHER-de-FORGES ,Dominique ARROUAYS ,Laura POGGIO ,Songchao CHEN ,Marine LACOSTE ,Budiman MINASNY ,Zamir LIBOHOVA,Pierre ROUDIER,Vera L.MULDER,Hervé NÉDÉLEC,Guillaume MARTELET0,Blandine LEMERCIER,Philippe LAGACHERIE and Hocine BOURENNANE
1INRAE(Institut national de recherche pour l’agriculture,l’alimentation et l’environnement),Info&Sols Unit,Orléans 45075(France)
2ISRIC(International Soil Reference and Information Centre)Wageningen,P.O.Box353,Wageningen 6700(The Netherlands)
3Zhejiang University-Hangzhou Global Scientific and Technological Innovation Center,Hangzhou 311200(China)
4The University of Sydney,SydneyInstitute of Agriculture.Eveleigh NSW 2015(Australia)
5The University of Sydney,School of Life and Environmental Sciences,Eveleigh NSW 2015(Australia)
6USDA-ARS(United States Department of Agriculture-Agricultural Research Service),Dale Bumpers Small Farms Research Center,6883 S.State Hwy.23,Booneville AR 72927(USA)
7Landcare Research-Manaaki Whenua,Palmerston North 4442(New Zealand)
8Soil Geography and Landscape Group,Wageningen University,P.O.Box47,Wageningen 6700(The Netherlands)
9Chambre d’Agriculture du Loiret,Orléans F-45000(France)
10Bureau de Recherches Géologiques et Minières,BP 36009,Orléans cedex2,Orléans 45060(France)
11UMR SAS(Unité Mixte de Recherche“Sol Agro et hydrosystème Spatialisation”)Institut Agro,INRAE,Rennes F-35000(France)
12UMR LISAH(Unité Mixte de Recherche“Laboratoire d’Etude des Interactions entre Sol-Agrosystème-Hydrosystème”),INRAE,Institut Agro,IRD(Institut de Recherche pour le Développement),Montpellier F-34000(France)
ABSTRACT Digital maps of soil properties are now widely available.End-users now can access several digital soil mapping(DSM)products of soil properties,produced using different models,calibration/training data,and covariates at various spatial scales from global to local.Therefore,there is an urgent need to provide easy-to-understand tools to communicate map uncertainty and help end-users assess the reliability of DSM products for use at local scales.In this study,we used a large amount of hand-feel soil texture(HFST)data to assess the performance of various published DSM products on the prediction of soil particle size distribution in Central France.We tested four DSM products for soil texture prediction developed at various scales(global,continental,national,and regional)by comparing their predictions with approximately 3 200 HFST observations realized on a 1:50 000 soil survey conducted after release of these DSM products.We used both visual comparisons and quantitative indicators to match the DSM predictions and HFST observations.The comparison between the low-cost HFST observations and DSM predictions clearly showed the applicability of various DSM products,with the prediction accuracy increasing from global to regional predictions.This simple evaluation can determine which products can be used at the local scale and if more accurate DSM products are required.
Key Words: digital soil mapping products,easy-to-understand tool,hand-feel observation,local use,map uncertainty,prediction performance,spatial extent,visual assessment
INTRODUCTION
Digital soil mapping(DSM)(McBratneyet al.,2003)has moved from the research stage to the operational stage(Minasny and McBratney,2016;Arrouayset al.,2017a;Zhanget al.,2017;Arrouayset al.,2020).Consequently,gridded maps of soil properties are freely available online.However,this swift development has provided end-users with several DSM products generated using different models,calibration/training data,and covariates at spatial scales,varying from global to local (Padarianet al.,2020;Chenet al.,2022).Users of DSM products include soil scientists,agronomists,climate change modelers,biodiversity conservation specialists,economists,hydrologists,landuse planners,governments,and policymakers.Stakeholders,such as farmers or forest managers,are also interested in using DSM products for their farms,but they require fineresolution soil information that can assist land management decisions.
Most of the predicted performances of DSM products have been evaluated using various cross-validation methods (Liuet al.,2020;Chenet al.,2022) or independent probability sampling,as recommended by Bruset al.(2011)and Helfensteinet al.(2022).Although many DSM products now provide estimates of uncertainties using various methods (Chenet al.,2022),these uncertainties remain largely ignored by end-users(Richer-de-Forgeset al.,2019;Arrouayset al.,2020).Therefore,there is an urgent need to provide easy-to-understand tools to communicate map uncertainty and help end-users assess the reliability of using DSM products at local scales.
Some studies have compared DSM products with existing soil maps(Bazaglia Filhoet al.,2013;Bishopet al.,2015;Ellili-Bargaouiet al.,2020;Rossiteret al.,2021) and/or point measurements(Ungaroet al.,2010;Tifafiet al.,2018;Ellili-Bargaouiet al.,2019,2020).However,few studies have used soil survey information acquired during soil mapping campaigns as input to DSM models or to evaluate DSM products.This soil information can be obtained from legacy or recent survey data.Extensive information is obtained during surveys(e.g.,soil colour,hand-feel soil texture,and reaction to hydrogen chloride),which could be useful for the rapid assessment of DSM prediction performance.
Soil texture(ST),the relative proportions of sand,silt,and clay,is one of the most frequently determined soil properties.It can be assessed in the laboratory or estimated manually by soil surveyors in the field(NSSC-NRCS-USDA,2012).The main differences between hand-feel ST(HFST)and laboratory-measured ST(LAST)were summarized by Salleyet al.(2018).Briefly,HFST is estimatedviasensory tests between the fingers and thumb of a sample taken from a horizon(or a fixed depth layer)to allocate the soil sample to an ST class.Laboratory-measured ST is characterized by the contents of clay,silt,and sand using a standardized method of physical separation based on size and density after pre-treatments(e.g.,removal of organic matter).Both results can be plotted in the soil“texture triangle”,which can differ between and even within countries(Richer-de-Forgeset al.,2008a).
Compared with LAST,HFST is conditional on uncertainty and subjectivity.However,in conventional soil surveys,legacy observations of HFST outnumber those of LAST(Richer-de-Forgeset al.,2022).Furthermore,when evaluated by experienced soil surveyors,HFST often correlates well with LAST(Voset al.,2016;Salleyet al.,2018;Malone and Searle,2021).A previous study conducted in Central France(Richer-de-Forgeset al.,2022)showed that well-trained and professional soil surveyors could predict ST classes with much higher accuracy(overall accuracy:73%)than that previously reported in the literature (Voset al.,2016;Salleyet al.,2018;Malone and Searle,2021).This result was attributed to experienced surveyors who knew the pedogenic context of their studied area well and conducted collaborative fieldwork with neighbouring regions.
Rossiteret al.(2015) posited that “An obvious check is how well new observations fit an existing soil-landscape model used for DSM”.However,for local applications,only a small amount of quantitative data are available,which limits the assessment of the accuracy of DSM predictions.Thus,in the present study,we attempted to use a large amount of HFST data to assess the performance of published DSM products in the prediction of soil particle size distribution at a local scale.
In the present study,we used the HFST observed during soil survey campaigns to produce a new semi-detailed map at a 1:50 000 scale(overca.55 000 ha)in Central France(the same region as Richer-de-Forgeset al.(2022)).We evaluated the accuracy of several DSM products that were obtained at several geographical extents:global,continental(Europe Union(EU)),national(France),and French department(ca.,6 000 km2),using various covariates.Aiming to develop an easy-to-understand indicator of the local performances of various DSM predictions based on the differences between LAST predictions and HFST observations,the present study capitalized on a large amount of HFST data,which are cheap and easy to measure.The proposed method can be used as a general scheme for evaluating the applicability of DSM products.
MATERIALS AND METHODS
Studyarea
The study area (Fig.S1,see Supplementary Material for Fig.S1) covers the 1:50 000 soil map of Pithiviers in the Loiret Department,France,produced by Nédélec(2015)using conventional soil mapping.This map and associated soil point data were neither used to develop the global,national,or regional DSM products,nor used to create the conventional 1:250 000 soil map of the Loiret Department(Richer-de-Forgeset al.,2008b).
The Loiret Department is located in Central France as one of the flattest departments in France,with an altitude ranging from 70 m above sea level(asl)in the northeast to 270 m asl in the southeast(Richer-de-Forgeset al.,2008b).It has a continental-oceanic climate with a mean annual temperature of 11.5°C and a mean annual rainfall of 700 mm.The Loire River crosses this department from southeast to southwest.In the north of Loiret,soils belong to the agricultural Beauce region and are mainly developed from periglacial loess deposits that cover limestone bedrocks.In the south of the Beauce region and from north to south,the main soils encountered are Vertisols developed on marl,followed by Arenosols,Planosols,luvic Cambisols,and Cambisols developed on complex ancient deltaic deposits,which are mainly composed of clay and sand.The Loire Valley crosses these deposits,where sandy Fluvisols are developed,and the surrounding quaternary ancient terraces,on which various luvic Cambisols are found,more or less differentiated depending on their age(Richer-de-Forgeset al.,2008b).Pithiviers is located in the north of the Loiret Department(Fig.1)and mainly includes Cambisols(except for dystric Cambisols)developed on periglacial loess deposits on limestone,Vertisols developed on marl,and various soils developed on complex sandy and clayey deltaic deposits in the extreme southwestern part(Nédélec,2015).
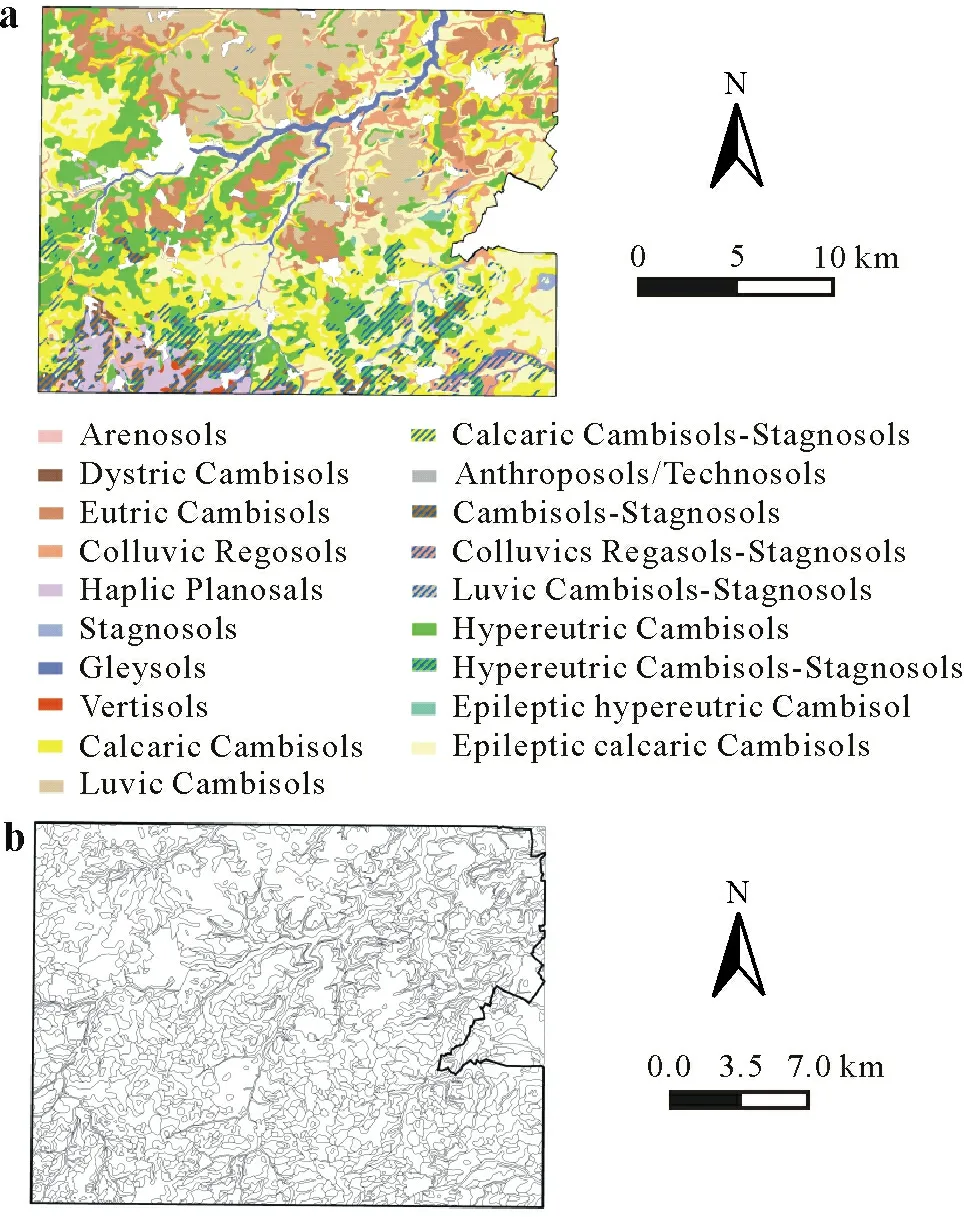
Fig.1 Conventional soil map(1:50 000)of Pithiviers,France,showing dominant soil types per polygon(a)and the original polygons of this soil map(b).
Using HFST data to evaluate the accuracyof the Pithiviers soil map
We selected 3 263 HFST soil observation points on the Pithiviers map with HFST estimates using the Aisne texture triangle(Jamagne,1967)at two depths:0—30 and 30—60 cm(Fig.2).For the HFST at 0—30 cm,we selected the HFST of the upper horizon(excluding the O horizon).Most soils were cultivated;therefore,they corresponded to the plough layer.For forest and very rare grassland soils,we selected the dominant HFST values observed at 0—30 cm(excluding O horizon).

Fig.2 Hand-feel soil texture of 3 263 soil points in Pithiviers,France estimated using the Aisne texture triangle.ALO=heavy clay;A=clay,AL=silty clay;AS=sandy clay;LA=clayey silt;LAS=sandy clayey silt;LSA=clayey sand silt;SA=clayey sand;S=sand;SL=silty sand;LL=silt;LS=sandy silt;LMS=sandy medium silt;LM=medium silt;LLS=sandy medium silt.Points in black indicate no data.

Fig.3 Spatial distribution of soil particle size classes in Pithiviers,France,extracted using the SoilGrids model.
Broad-scale DSM predictions
Three broad-scale DSM products of ST prediction covering the soil map of the Pithiviers area were selected.They included the global product SoilGrids 2.0 map(Poggioet al.,2021),the EU map developed by Ballabioet al.(2016)that utilizes the land use and coverage area frame survey(LUCAS-Soil) topsoil data (LUCAS-Soil map),and the GlobalSoilMap product for France(GlobalSoilMap-France)(Mulderet al.,2016).Their primary characteristics are described as follows.
SoilGrids 2.0 map.SoilGrids 2.0 map is a global digital soil map developed using a tri-dimensional machine learning method that predicts the spatial distribution of several soil properties at various depths,as defined by the GlobalSoilMap specifications(Poggioet al.,2021).We used clay,silt,and sand content maps at depths of 5—15 and 30—60 cm.As most of the region is intensively cultivated and ploughed,we hypothesized that the ST at 5—15 and 0—30 cm would be similar.However,this may not always be true,as in the case of forested areas.The grid spacing was 250 m.
LUCAS-Soil map.The LUCAS-Soil included the main properties of topsoil(0—20 cm)in 23 member states of EU(Orgiazziet al.,2018).Ballabioet al.(2016)used LUCASSoil data to predict DSM of particle size distribution(i.e.,clay,silt,and sand contents)over Europe based on a grid spacing of 500 m.
GlobalSoilMap-France.The methodology of GlobalSoilMap-France product has been detailed by Mulderet al.(2016).Digital maps were created following the Global-SoilMap specifications using point observations from legacy data of France(Arrouayset al.,2014a,b).Grid spacing was 90 m.
Regional-scale DSM product
We built a regional DSM model only using soil LAST data of 988 soil profiles in Loiret to predict clay,sand,and silt contents.Particle size distribution was measured according to the French standard,the pipette method(Afnor Editions,2003).The map was generated using the quantile regression forest (QRF) model in the R package “quantregForest”(Meinshausen,2006)with the covariates listed in Table I.The performance of the model was evaluated using a 10-fold cross-validation procedure.Grid spacing was 25 m(Table I).
However,the maps were incomplete in certain areas owing to missing values of some covariates,particularly in built-up areas.These covariates were those obtained by airborne gamma-rays(U,K,Th,and total count;Table I).They were not available in cities and small military airports because the aircraft was not allowed to fly at a very low elevation and/or to take images over these areas.To overcome this limitation,missing data were filled in by modelling using the ranger package (Wright and Ziegler,2017) and other covariates.We randomly selected 10 000 samples from the map to build a model and systematically filled in the missing values.Mulderet al.(2016)could not use this method in France because the spatial coverage of the entire territory was incomplete.
Comparison between modelled LAST predictions and observed HFST classes
Plotting LAST prediction against each observed HFST class.For each observed HFST class,we plotted the corresponding DSM prediction of clay,silt,and sand contents in the texture triangle.For each HFST class,we calculated the density of predicted LAST points in the triangle using the function“kde2d:Two-Dimensional Kernel Density Estimation” of the R package “soiltexture” (Moeyset al.,2018)(version 1.5.1).This allowed a visual evaluation of the distribution of each LAST prediction for each corresponding observed HFST class in the texture triangle.

TABLE IEnvironmental covariates used to generate the map using the quantile regression forest model in the R package quantregForest
Calculation of the shortest distance between predicted LAST and observed HFST.To assess the accuracy of the DSM prediction of clay,silt,and sand contents,we calculated the shortest distance from the predicted LAST to the limits of the observed HFST class using the R packages“soiltexture”(Moeyset al.,2018)and“rgeos”(Bivandet al.,2021).If the predicted LAST was consistent with the observed HFST,the distance was equal to 0.We then calculated the mean value of this distance for each HFST class and used it as an indicator of the consistency between the observed HFST and predicted LAST values.We normalized the distance by transforming its maximal value to 1 and its minimum value to 0.This normalized distance had no units.
RESULTS
Visual comparison of the various DSM products
Four DSM products of clay,silt,and sand contents in Pithiviers were obtained at the global,continental,national,and regional levels.In the following subsections,we briefly described each map and then provided a comparison of the patterns observed in these maps.
SoilGrids 2.0. map.Figure 3 shows the spatial distribution of mean clay,silt,and sand contents predicted by SoilGrids 2.0(Poggioet al.,2021).Overall,this spatial distribution was characterized by a relatively large homogeneous area.The spatial distribution patterns of the topsoil(5—15 cm)and subsoil(30—60 cm)were also similar.
LUCAS-Soil map.Figure 4 shows the spatial distribution of mean clay,silt,and sand contents from a European DSM product calibrated using the LUCAS-Soil data(Ballabioet al.,2016).The predicted values were more variable than those of the SoilGrids2.0 map.However,there were some prominent spatial patterns,such as the sandy area in the southwestern part of the map and rather large valleys in the northern part of the silt and sand maps.
GlobalSoilMap-France.The distribution by Global-SoilMap-France (Mulderet al.,2016) showed a largely uniform pattern (Fig.5).The sand maps were relatively similar to those predicted by SoilGrids 2.0.
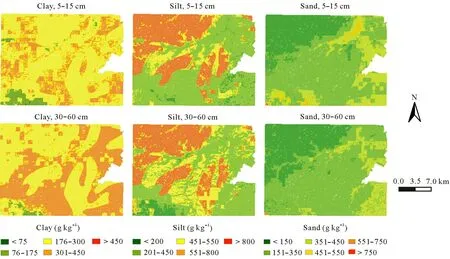
Fig.5 Spatial distribution of soil particle size classes in Pithiviers,France,extracted using the GlobalSoilMap for France model.
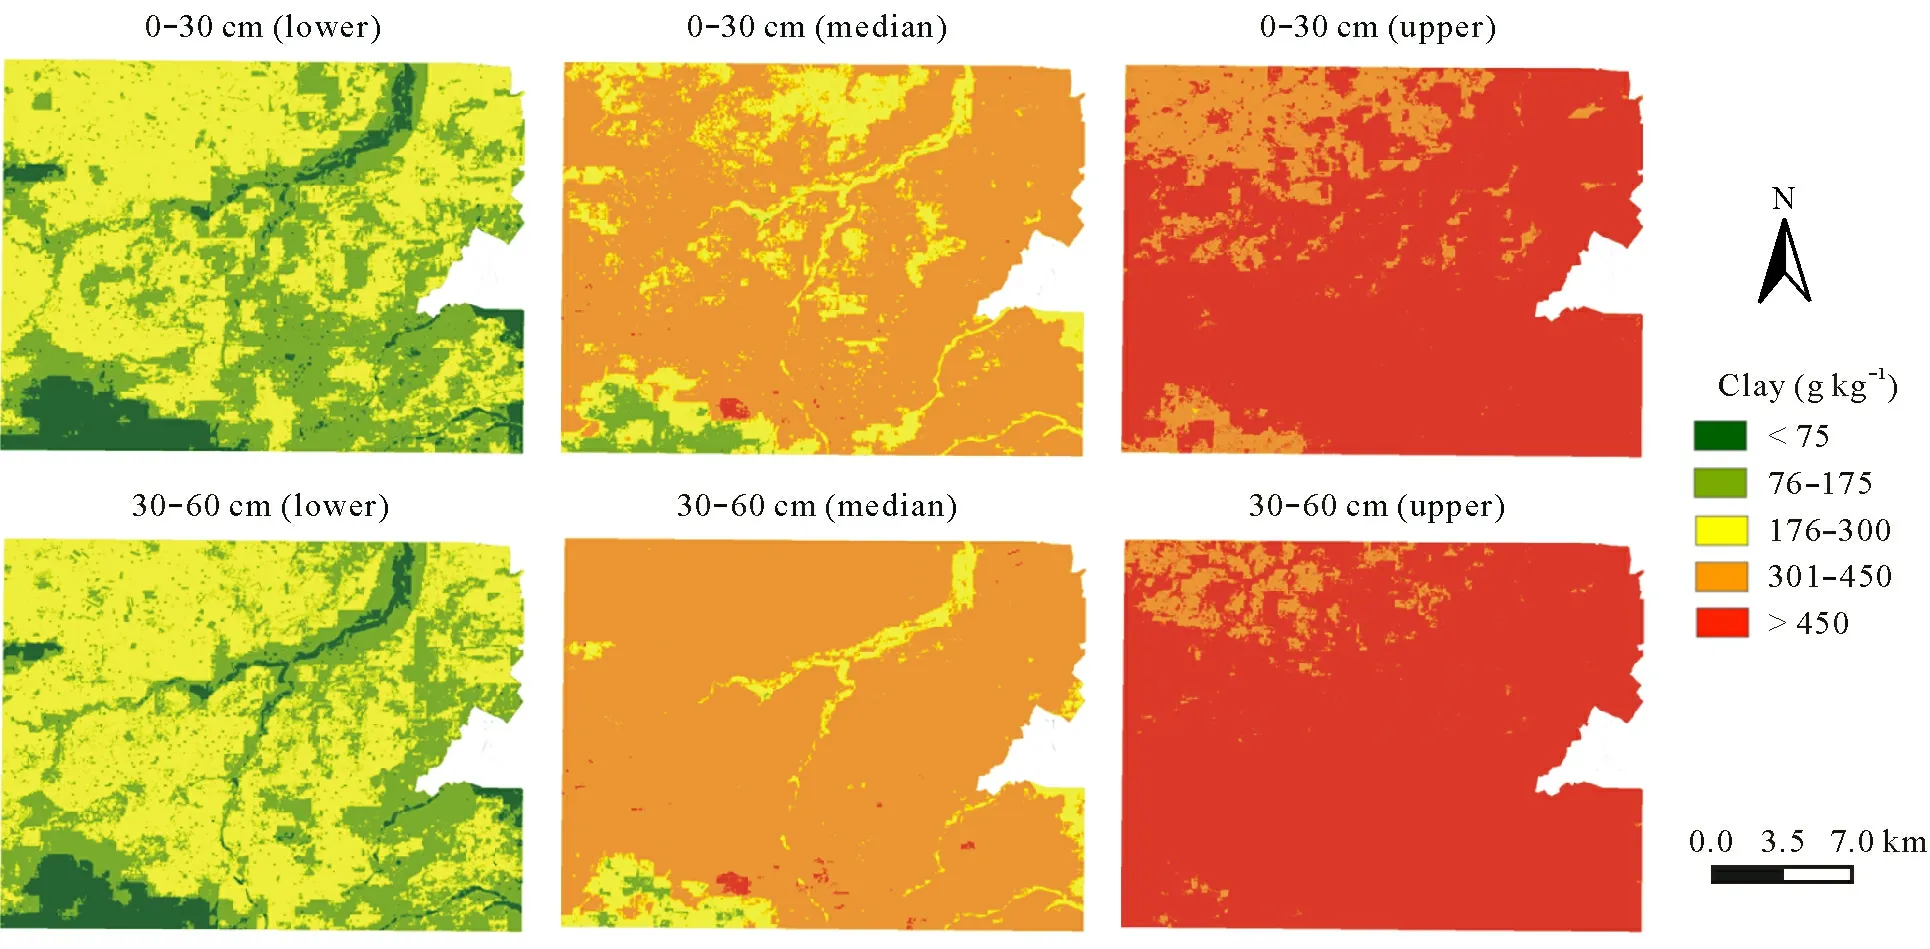
Fig.6 Spatial distribution of particle size classes for soil clay in Pithiviers,France,extracted using the regional model.Lower and upper maps correspond to the 5%and 95%percentiles,respectively.
Regional maps.Figures 6,7,and 8 show the spatial distribution of median clay,silt,and sand contents generated using the regional model,together with their lower and upper prediction intervals(5%and 95%percentiles).The silt maps(Fig.7)showed the most contrasting patterns in the north-eastern part.The valleys were clearly visible on most of the maps,and the sandiest area in the southwest was more clearly delineated.

Fig.7 Spatial distribution of particle size classes for soil silt in Pithiviers,France,extracted using the regional model.Lower and upper maps correspond to the 5%and 95%percentiles,respectively.

Fig.8 Spatial distribution of particle size classes for soil sand in Pithiviers,France,extracted using the regional model.Lower and upper maps correspond to the 5%and 95%percentiles,respectively.
Comparison between maps.There were similarities and discrepancies between the four DSM products.All maps clearly showed a siltier zone in the northwestern region,especially in the topsoil.The GlobalSoilMap-France exhibited some large polygons with sharp boundaries because of the 1:1 000 000 soil parent material map used as a covariate and some artifacts(large square patterns)due to coarse climate data,as pointed out by Mulderet al.(2016).A more sandy area was predicted using the SoilGrids 2.0,GlobalSoilMap-France,and regional model than the LUCAS-Soil data in the extreme southwestern part of the map,mainly for subsoils.This sandy area was also predicted using LUCAS-Soil for the topsoil and using regional model for both depths.Patterns linked to rivers were not well identified by SoilGrids 2.0,although some were clearly evidenced in the regional model.The prediction intervals were quite large(Figs.6 and 7).The maps of the regional model corresponded to a finer resolution(25 m×25 m).As the regional model used GlobalSoilMap-France as covariates,some of the regional maps exhibited artifacts.The gamma-ray and digital elevation model(DEM)derivative covariates resulted in finer map details.
Densityof LAST DSM predictions for each observed HFST class
We present the LAST DSM predictions for each HFST class observed from the soil survey data for the 1:50 000 map.
Topsoil.Figure S2(see Supplementary Material for Fig.S2),from left to right,shows how the LAST values predicted by each model distributed on each observed HFST class.All the predictions tended to underestimate the clay content for the HFST heavy clay(ALO)class,even in the regional model.SoilGrids showed a very compact cluster on the left side of the silty clay(AL)class.The LAST AL class was better predicted by the regional,LUCAS-Soil,and SoilGrids models.For the clay(A)class,the regional model gave a good prediction,whereas the predictions of GlobalSoilMap-France and LUCAS-Soil were scattered,and SoilGrids identified A as AL.The LAST sandy clay(AS)class was not well predicted by the models,and their predictions worsened with the increasing geographical extent of the model.The clayey silt(LA)class was not well predicted but the predictions of all four models were consistent and were mainly located in adjacent classes,especially in AL.In this study area,the texture of the topsoil was mostly LA and AL;therefore,the discrepancy between classes does not necessarily imply a large difference in LAST.For the sandy clayey silt (LAS) class,the predictions of GlobalSoilMap-France were the best,whereas the clayey sand silt(LSA)class showed considerable dispersion in the regional model and was more clustered in other models.The regional model predicted the sandy clay (SA) class quite well,but this class was poorly predicted by GlobalSoilMap-France and LUCAS-Soil and was completely missed by SoilGrids.The sand (S) class was underestimated by all the models (especially by SoilGrids),whereas the three remaining HFST classes(medium silt,sandy silt,and sandy medium silt) were not predicted by any of the models.Figure S2 revealed that SoilGrids had a strong tendency to predict very compact or similar LAST values for all HFST classes,most of them within or adjacent to the AL class.In general,the regional model performed slightly better than the GlobalSoilMap and LUCAS-Soil models;however,this was not the case for all HFST.In all cases,the extreme values at the corners of the triangle tended to be underestimated,particularly in SoilGrids.In general,the regional model performed better than the other models,whereas GlobalSoilMap-France and LUCAS-Soil map gave a rather similar distribution for topsoil.
Subsoil.For the subsoil(Fig.S3,see Supplementary Material for Fig.S3),the LUCAS-Soil DSM product had no data;however,for the other models,the results were consistent with those obtained for the topsoil.The tendency for SoilGrids to overestimate the AL class was also evident here,whereas predictions were generally better for the regional model than for GlobalSoilMap-France,with noticeable exceptions for HFST LA and LAS.
Distance between predicted LAST and observed HFST
To calculate the accuracy of the DSM product predictions for each ST class by comparing with soil survey HFST observations,we calculated the normalized distance between the predicted points and the closest boundary of their corresponding HFST(Fig.S4,see Supplementary Material for Fig.S4).
In general,the regional model predictions were the closest to HFST classes(mean distance=0.21 for topsoil and 0.27 for subsoil),followed by GlobalSoilMap predictions(mean distance=0.28 for topsoil and 0.32 for subsoil).The LUCAS-Soil (mean distance=0.24 for topsoil) and SoilGrids (mean distance=0.32 for topsoil and 0.36 for subsoil)presented the farthest distances.
Most models did not predict the extreme sandy and silty classes well.This situation was worse for SoilGrids,particularly for sandy HFST.Nevertheless,SoilGrids performed well for the HFST adjacent to AL.However,SoilGrids mostly predicted ST in the area as AL and nearby ST classes(Figs.S2 and S3).The LUCAS-Soil model performed well for the central values of the HFST classes.
DISCUSSION
Limitations of the study
Can we draw conclusions from a local example? This study was limited to an area located in Central France(518.4 km2).Therefore,the results may not be generic,and the conclusions may not be valid for other parts of the world.Nevertheless,our results are consistent with the existing evaluations of local or national DSM products(Bishopet al.,2015;Guevaraet al.,2018;Vitharanaet al.,2019;Ellili-Bargaouiet al.,2020;Roudieret al.,2020).In general,maps built from broader data perform worse on local predictions(Caubetet al.,2019;Chenet al.,2020).This is not surprising as broader models generally capture large trends on the scale they are produced.This is logical if the following points are considered: the relative importance of the controlling factors of soil properties differ according to the scale at which they are studied,the density of the training points(soil observations) is often lower when geographical coverage increases,and the nature and resolution of covariates also depend on the scale at which they are used.In this study the number of soil profiles available to generate SoilGrids products in France was limited.The observations of LUCASSoil were also less dense than those of the GlobalSoilMap and were limited to the topsoil.The GlobalSoilMap-France(Mulderet al.,2016) did not capture all soil variability in France.The regional model performed better than the national product (GlobalSoilMap-France),as it included new data that became available but the latter was produced in 2014.This point advocates a regular update of DSM products when new data become available(Arrouayset al.,2017a,b).Note that this possibility has been frequently maintained as an advantage of DSM compared to traditional soil mapping(McBratneyet al.,2003;Arrouayset al.,2020).Although mentioned in several papers (Henglet al.,2014;Mulderet al.,2016;Arrouayset al.,2017a),the automated updating of such products is still not operational.As computational power increases(Padarianet al.,2019,2020),incorporating new covariates and building new models as new data become available through a well-documented code,and the procedure should be straightforward.Therefore,automated updating of DSM predictions should become a standard practice in the near future.The proposed method is influenced by the relative areas of the ST classes in the triangle.Thus,it is difficult to hypothesize how this method could be performed with triangles having a different number of ST classes.According to Richer-de-Forgeset al.(2022),most triangles used worldwide have 12—18 classes,but the range is from 3 to 47 classes.A map with a few large classes may appear more accurate than that with many classes mostly because of the simpler legend.Therefore,we should keep in mind that the areas covered by classes(and thus the range of particle size values) differ among triangles.In other words,a ST class with a large area would lead to a higher probability of a DSM prediction to be allocated to that class and could create a false impression of high accuracy,e.g.,the ALO(heavy clay)class can have a clay content between 50%and 80%.Nevertheless,because DSM products predict sand,silt,and clay contents(not ST classes),anomalous predictions,such as those observed for SoilGrids in which very large areas are predicted as AL,would be visible.Therefore,the proposed method can be used as a general scheme for evaluating the applicability of DSM products.In contrast,the calculation and illustration of distance between predicted points and HFST will be more affected by the ST class area,i.e.,the larger the ST class area,the shorter the distance to the limit of the class.
Is our example a worst-case scenario? As described in the previous section,the training data used for global modelling(SoilGrids and LUCAS-Soil)were sparse and/or restricted to topsoil.Another important point is that Loiret is the flattest department in France.Therefore,it seems logical that coarse-resolution DEMs,such as those used for global modelling,are not effective in capturing local soil variability.In addition,a regional model was developed using detailed covariates that were not available for larger areas(detailed DEM and airborne gamma-ray data).These detailed covariates proved very efficient in other parts of France(Lacosteet al.,2011;Marteletet al.,2013;Loiseauet al.,2020)and many other parts of the world(Megumi and Mamuro,1977;Wilford,2012;Dierke and Werban,2013;Grayet al.,2016;Padarianet al.,2019).Evidently,some soil processes and controlling factors occur at more detailed scales than those captured by global models using coarseresolution covariates.Hence,the global models were unable to capture the north-western plateaus with the siltiest topsoil texture.The regional model underestimated the silt content and overestimated the clay content of the topsoil of these plateaus.This is likely because the number of training points in the plateaus was rather small.However,the spatial pattern of the map allowed us to delineate this specific soilscape with greater accuracy.This is consistent with the results of Chenet al.(2021),who showed that using fine resolution covariates,the thickness of loess(TOL)over the calcareous area was larger in the northern flat plateaus,and soils with large TOL are prone to illuviation resulting in lower clay content and siltier topsoil.Overall,these results advocate using more relevant and detailed covariates for regional or local DSM when available and ensuring the data cover the whole soilscape.
Inconsistencybetween covariates and data support.A general issue in evaluating DSM prediction performance is that in many cases,the training and evaluation data are point measurements,whereas the covariates are areal data.Defining an“optimal”grid size is still being discussed(Bishopet al.,2015;Biggset al.,2021;Szatmáriet al.,2021) to deliver DSM products using more relevant spatial supports(farms,soil mapping units,watersheds,administrative units,etc.)and convey their uncertainties to decision makers(Heuvelink and Pebesma,1999;Vaysseet al.,2017).In the present study,we evaluated the prediction performance using point data.Further research should use other supports for this evaluation.However,we should stress that our objective was to assess if the predictions were useful at the local scale,and therefore a too large spatial support could be impractical for use in soil management.
HFST has more uncertainty than LAST.We used HFST data to evaluate the performance of the LAST predictions.We made the overwhelming assumption that HFST observations were the true values.However,this was not the case.Although for the same ST class,HFST may lead to different results when compared to the LAST projected(Fosset al.,1975;Hodgsonet al.,1976;Akamigbo,1984;Postet al.,1986;David,1999;Carlileet al.,2001;Minasny and McBratney,2001;Franzmeier and Owens,2008;Voset al.,2016;Salleyet al.,2018;Malone and Searle,2021),this was not the case for most observations.In the French Central region,Richer-de-Forgeset al.(2022)showed that the overall accuracy of LAST predictions using HFST was 73%.This was even larger when adjacent ST classes were considered.Even if HFST carries an inherent uncertainty,the present results showed that HFST was increasingly consistent with DSM LAST predicted values when the models were less global and used more local covariates.
Practical application of this study
Using field HFST observations as data to evaluate the prediction performances of various DSM LAST predictions may help to provide a first assessment of the goodness of these predictions.When the training area is large and covariate resolution is high,predictions tend to be smooth.Such a quick check may help end-users decide which product to use or if a soil map is adequate.For DSM practitioners,this method can reveal whether a map is uncertain and requires a higher training point density or new detailed covariates.This study also advocates storing raw HFST values in soil databases and recording both HFST and LAST values,even when they are available at the same locations.The HFST data can be used to check whether DSM products are adequate or over-smoothing ST variability,considering the scale at which end-users intend to use these data.
Nevertheless,we caution against incorporating uncertain HFST values that may come from citizen science(Rossiteret al.,2015;Salleyet al.,2018;Headet al.,2020).We must stress that very experienced soil surveyors collected the HFST data used in the present study.Salleyet al.(2018)demonstrated that training was important for HFST allocation.
Our results do not imply that global predictions are unusable but caution their use on a local scale.Moreover,the results advocate the need for local DSM at a finer scale and using more relevant and finer-resolution covariates depending on the local pedological context.This may involve having a more precise DEM at different spatial and vertical resolutions,using some relevant covariates that are not available at the global scale(e.g.,accurate lithological maps,airborne gamma-ray data,high-resolution remote sensing data,and vegetation maps)(Lagacherieet al.,2012;Poggioet al.,2013;Loiseauet al.,2020;Heitkampet al.,2021),exploring spatial disaggregation for broader scale maps,or incorporating local pedological knowledge (Nauman and Thompson,2014;Odgerset al.,2014a,b;Holmeset al.,2015;Machadoet al.,2018;Vincentet al.,2018;Ellili-Bargaouiet al.,2019,2020;Maet al.,2019;Mølleret al.,2019).Our results also support the future strategy of DSM in France,i.e.,to produce more local DSM maps at the local scale,as recommended by Voltzet al.(2020).A future study will explore whether spatially dense HFST data could be used to produce digital LAST maps and/or to improve existing DSM products.
CONCLUSIONS
Predicting particle size distribution is a common objective of DSM,as texture influences many soil processes.However,the relevance of using global or continental DSM products for local use is questionable.Conducting independent validation at a local scale implies the high cost of laboratory measurements.Here,we proposed a cheap and straightforward assessment of the performance of predictions by using HFST over an area that was underrepresented in global,continental,national,and regional DSM predictions.The comparison between the low-cost observed HFST and DSM predictions clearly showed the applicability of various DSM products,with prediction performance decreasing from global to regional predictions.This simple evaluation can determine which products can be used at a local scale and if more accurate DSM products are required.The visual interpretation of the predicted maps and the scattering of the predicted ST on a texture triangle for each observed HFST class may help to determine whether a DSM product is locally usable.It can also help to identify areas with a higher density of LAST measurements and/or if more relevant covariates are necessary.The example presented in this study stresses that some global and continental DSM products may not be sufficiently accurate for local use.A higher training point density and more precise and relevant covariates for local soilscapes are required to produce an accurate local DSM.
ACKNOWLEDGEMENTS
Anne C.Richer-de-Forges,Guillaume Martelet,Philippe Lagacherie,and Hocine Bourennane are collaborators,Budiman Minasny,Laura Poggio,Pierre Roudier,Vera L.Mulder,and Zamir Libohova are members,and Dominique Arrouays is the coordinator of the Global Digital SOIL MAP Consortium supported by LE STUDIUM Smart Loire Valley Institute for Advanced Studies through its LE STUDIUM Research Consortium Program.The 1:250 000 soil map of Loiret benefited from funding from INRAE and the Ministère de l’Agriculture et de l’Alimentation(MAA),France.The 1:50 000 soil map of Pithiviers was funded by MAA,INRAE,and Chambre d’Agriculture du Loiret (CDA45),France.The present study was co-funded by MAA,INRAE,and CDA45.We thank ISRIC and Joint Research Centre for providing SoilGrids and LUCAS-Soil ST predictions.The airborne gamma-spectrometric data used were co-financed by the Région Centre-Val de Loire BRGM,and the“Fonds européen de développement regional”European funds.This study was conducted under the framework of CES CNS Théia for DSM.The authors thank Dr.David Rossiter and the two anonymous reviewers who provided helpful comments for improving this article.
SUPPLEMENTARY MATERIAL
Supplementary material for this article can be found in the online version.

- Pedosphere的其它文章
- Carbon farming by recarbonization of agroecosystems
- Root exclusion methods for partitioning of soil respiration:Review and methodological considerations
- Utilization of lignocellulosic plant residues for compost formation and its role in improving soil fertility
- A critical review of microbially induced carbonate precipitation for soil stabilization:The global experiences and future prospective
- Influence of soil physicochemical properties,particle size fractions and mineralogy on the leaching potentials of arsenic and antimony in abandoned mine soils
- Viscoelasticity and shear resistance at the aggregate scale of structured and organic carbon-free Chernozems