
Viscoelasticity and shear resistance at the aggregate scale of structured and organic carbon-free Chernozems
2023-10-16 13:27ChristophHAASRainerHORNPhilippSAGGAUandRainerDUTTMANN
Pedosphere 2023年5期
Christoph HAAS ,Rainer HORN ,Philipp SAGGAU and Rainer DUTTMANN
1Institute for Plant Nutrition and Soil Science,University of Kiel,Kiel 24118(Germany)
2Department of Geography,Division of Landscape Ecologyand Geoinformation Sciences,University of Kiel,Kiel 24118(Germany)
ABSTRACT Soil rheology characterises the flow behaviour of soils at the particle-particle to aggregate scale.Amplitude sweep tests(ASTs)are often the method of choice for parameterizing soil flow properties,such as the shear strain values at the end of the linear viscoelastic range(i.e.,the deformation is mainly elastic)and at the yield point(i.e.,elastic equals plastic deformation).Samples from seven soil profiles and five soil depths of Chernozems,collected in the Maidanetske study area,close to Uman City of Ukraine,were analysed to evaluate the effect of soil organic carbon(SOC)on the parameters related to soil microstructural stability derived from ASTs.Soil organic carbon was removed with H2O2 to determine the soil texture-dependent values of soil rheological properties,which were compared to the values determined for samples with intact water-stable aggregates.The shear resistance-related parameters increased for aggregated soil samples compared to SOC-free soil samples,indicating an increase in soil stability due to SOC.In contrast,the values of the overall viscoelasticity and the shear strain were reduced for aggregated soil samples,indicating decreased soil stability.Pedotransfer functions were applied to predict the shear strain-dependent loss and storage moduli and shear stress values as a function of SOC depletion.Coarse particles(630—2 000 μm)and volumetric water content improved the models.We conclude that increased SOC content,through the gluing and cementing effects of SOC and altered aggregate shapes compared to SOC-free soil materials,contributes to higher microstructural strength.However,the increased water content in the SOC-containing soil samples reversed soil strengthening effect.This was due to the fact that a more rapid increase in positive water pressure under shear stress weakened the samples and the spherical aggregates began to rotate more easily,thus loosing energy,when compared to platy particles of the SOC-free soil materials.
Key Words: aggregation,rheology,shear strain,shear stress,soil organic carbon depletion,soil stability
INTRODUCTION
Chernozems are characterised by a soil organic carbon(SOC)-rich surface layer and available calcium ions bound to soil particles.The soil is typically formed from loess,a predominantly silt-sized and carbonate-containing aeolian sediment.The surface layer has a thickness of up to 2 m and develops in areas with continental dry climate and grassland vegetation,where little or no leaching occurs.Gluing and binding agents such as SOC,chalk,and iron oxides further promote aggregate formation and stabilization(Totscheet al.,2018).Chalk and iron oxides cement primary particles together (Bronick and Lal,2005),whereas SOC plays an essential role in soil structure formation.Particulate organic matter acts as a nucleus for aggregate formation(Sixet al.,2004)and reduces clay dispersion(Dexteret al.,2008)when it is glued to minerals by exudates of microorganisms.These soils are highly prone to soil degradation processes such as wind and tillage erosion,owing to their natural productivity and intense agricultural use.This results in the loss of SOC and altered physical and chemical soil properties such as water-holding capacity and soil strength.
In the case of a mechanical stress application,soils undergo volume changes,which alters the water and air storage and fluxes as well as their interactions.The interactions between soil mechanics and soil hydraulics are described by the effective stress equation proposed by Bishop(1960):
whereσ′is the effective stress,σis the total stress,χis the factor that describes the water-filled surface area of the pore system at an imaginary cross-section through the(un-)saturated soil,anduwis the pore water pressure(with negative values for unsaturated and concave water menisci).
Concave water menisci cause soil strength increase,because the primary particles are pulled together and form stronger aggregates.Convex water menisci push primary particles apart and decrease their binding forces(Huanget al.,2021).Organo-mineral binding through SOC enhances soil structure formation and increases soil hydraulic capacities and intensities,such as total porosity,plant-available water,and(un-)saturated hydraulic conductivity,which improves site properties and supports plant growth.At the same time,however,water may act as a lubricating fluid,reducing the internal soil strength when dynamic forces are applied(Zhai and Horn,2018).
Soils are viscoelastic substances(Markgraf and Horn,2006),and rheometry(derived from Greek‘rheo’—to flow)determines the flow and deformation behaviour of matter,and parameterizes soil properties related to soil microstructural stability.Using amplitude sweep tests(ASTs),microstructural stiffness of soil samples is gradually degraded by applying small deformations to small soil volumes.The soil behaviour to the applied shear strains(γ)can be divided into three phases(Fig.1):i)within the linear viscoelastic range(LVR),elastic (i.e.,reversible) deformations occur;ii) in the transitional zone,located between the end of LVR and the yield point (YP),elastic behaviour prevails over plastic/viscous behaviours;and iii)viscous behaviour prevails over elastic behaviour withγvalues larger than YP.Following the pattern of the stress strain ratio,soil samples can be characterised by the well-established rheological parameters,namely storage modulus(G′)and loss modulus(G′′),loss factor(tanδ,defined as the ratio ofG′′toG′),the values ofG′at the end of LVR(GLVR)and at YP(GYP)(i.e.,whereG′equalsG′′),and the corresponding values ofγat which they occur(γLVRandγYP,respectively).
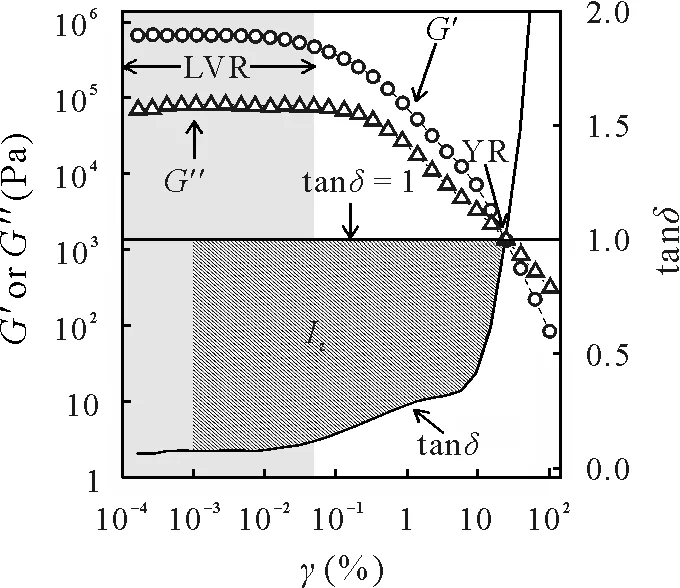
Fig.1 Exemplary curves of storage modulus(G′),loss modulus(G′′),and loss factor (tanδ) as a function of shear strain (γ),showing linear viscoelastic range(LVR)(shaded area),yield point(YP)(i.e.,where G′equals G′′and tanδ equals 1),and the summarizing soil stability parameter integral z(Iz)(hatched area).
To further compare the quasi-elastic range(tanδ <1)in absolute terms,Markgraf and Horn(2009)introduced a summarizing parameter of soil stability,integralz(Iz).As a summarizing parameter of the loss factorvs.γrelationship,Izquantifies the structural strength in terms of elasticity losses due to increasingγover time with tanδ <1(Eq.2).
The higher the value ofIzis,the more elastic or rigid the soil is(Markgraf and Horn,2009).In addition to rheological parameters,shear stress-related parameters can be derived from AST,namely shear stress (τ) at the end of LVR(τLVR)and at YP(τYP),and the maximal shear stress applied (τmax) (Holthusenet al.,2019).Based on AST,aggregate stability depends on numerous factors,such as the effective stresses applied,the quality and quantity of soil organic matter(Stoppe,2015;Khaidapovaet al.,2016;Haaset al.,2018;Pértileet al.,2018;Buckaet al.,2019;Batistãoet al.,2020),and the content of electrolytes(Markgraf and Horn,2006;Markgrafet al.,2006;Holthusenet al.,2010).Additionally,aggregate size impacts aggregate stability(Tisdall and Oades,1982)—microaggregates are more stable than macroaggregates from which they originate(Baumgartl and Horn,1990).The detailed effects of SOC depletion on the deformation behaviour of soils are unknown.Knowledge about the(micro-)structural soil stability and deformation behaviour of soils is essential for sustainable soil management because plastic deformation irreversibly alters soil properties and soil functions(Haaset al.,2016).
This study aimed to investigate the effects of SOC and SOC-induced aggregation in interaction with physical and chemical soil properties on the values of soil rheological and shear parameters to better understand the effect of SOC depletion on the mechanical stability of Chernozems.To the best of our knowledge,this is the first statistical evaluation of the potential interactions between SOC depletion and soil physical and chemical properties.This was achieved by comparing the parameter values derived from ASTs for soil samples repacked from disturbed soil materials with intact aggregates (<2 mm) or with organic carbon-free primary particles and by statistically evaluating these values in combination with parameter values of soil physical and chemical properties.We hypothesized that rheological and shear parameters will indicate increased soil stability for aggregated soil samples,as compared to SOC-free soil materials and that soil physical and/or chemical properties will be helpful for the prediction of such parameters.
MATERIALS AND METHODS
Sampling site
The sampling site was located in the Maidanetske study area,close to Uman City in western central Ukraine(48°48′N,30°38′E,192—216 m above sea level).According to Köppen(2011),the climate is classified as humid continental(7.1°C mean annual temperature,616 mm average precipitation),with distinct seasonality of warm summers and cold and wet winters.The topography of the area is characterised by a mosaic of small plateaus,slightly inclined slopes,and smooth valleys.The loess of the plateaus and slopes was deposited during the last glaciation between 27 000 and 11 000 BP(Kirleis and Dreibrodt,2016),and the valley fills are composed of younger alluvial and colluvial sediments (Dreibrodtet al.,2020).Soils in this area are managed by conservation tillage using disc harrows,grubber cultivators,and other equipment for ploughless tillage.The dominant rotation crops are winter wheat(Triticum aestivumL.),soybean(Glycine maxL.),and sunflower(Helianthus annuusL.),partly diversified by silage corn(Zea maysL.).
Soil sampling,pretreatment and sample preparation
Soil samples from seven soil profiles (SPs),all under agricultural use,were excavated.Six soils were classified as Haplic Chernozems(Fig.2).The seventh soil(SP 1A)at the slope toe revealed colluvial material until>140 cm soil depth that formed a well-developed Terric Anthrosol(IUSS Working Group WRB,2006).The investigated catena represents a typical soil sequence for the Maidanetske region with different stages of soil degradation at backslope positions with truncated soil profiles and reduced Ah-horizon depths,indicating severe soil erosion in ancient and recent times.Additionally,disturbed soil samples were collected in 2017 from each SP at soil depths of 0—30(depth I),30—50(depth II),50—70 (depth III),70—100 (depth IV),and>100 cm(depth V).After sampling,the soil materials were air-dried,sieved(<2 mm),and stored in darkness at 4°C.Thus,soil aggregates<2 mm in diameter remained intact.

Fig.2 Soil profile descriptions and relative spatial positions of soil profiles along the investigated catena.
Two pretreatments of the soil materials included: (i)dispersion of the air-dried soil in demineralized water and horizontal shaking for 2 h at 190 r min-1(Zimmermann and Horn,2020),which ensured that only water-stable aggregates remained intact;and(ii)dispersion of the primary particles by the removal of soil organic matter.Soil organic matter was removed by the repetitive addition of 30 mL 30%H2O2to soil samples in a water bath at 70°C until no further gas generation(frothing)was observed.For each soil and pretreatment,the air-dried soil was rewetted to a gravimetric water content of approximately 20%,hermetically sealed,and left to equilibrate overnight.The water content was then determined,and a defined mass of soil needed to achieve a bulk density(ρb)of 1.3 Mg m-3was placed in a cylinder(0.036 m in diameter,around 0.03 m for Chernozem and 0.02 m for Anthrosol in height,the bottom covered with a nylon gauze),consisting of six (for Chernozems) or four(for Anthrosol)separate metal rings(0.036 m in diameter and 0.005 m in height),each attached to other metal rings by two vertical stripes of adhesive tape.The soil material was repacked by applying slight vertical pressure to the entire surface area to achieve the definedρb.The repacked samples were then placed on nylon mesh and saturated with deionised water by capillary rise to attain quasi-saturated conditions(0 kPa).To extrapolate the results underin situconditions,the consistent bulk density of 1.3 Mg m-3was chosen to compare with field bulk density with a mean value of 1.23 Mg m-3and a standard deviation of 0.09 Mg m-3(unpublished data).
Rheometryand AST
A profiled parallel plate measurement system(0.025 m diameter) was used for AST with a rheometer MCR300(Anton Paar,Stuttgart,Germany) and rheometer-inherent software RheoPlus(RHEOPLUS/32 V3.21)(Anton Paar).The adhesive tapes,holding the metal rings together,were carefully removed,and the uppermost subsample was cut offfrom the remaining samples using a nylon cord and carefully placed on the lower plate of the rheometer.The samples were then trimmed to the final height of 0.004 m(using a nylon string)and diameter of 0.025 m(using a bevelled ring),as illustrated by Pértileet al.(2018).Sample trimming was done to avoid excessive lateral material affecting the measurement and to minimize the variability in vertical stresses due to different sample heights(Holthusenet al.,2017).The removed soil was used to determine the volumetric water content.
The lower plate was fixed to the rheometer,whereas the upper plate was moved in an oscillating manner with successively increasing amplitudes at a constant frequency of 0.5 Hz.The strains were applied with a logarithmic ramp of 30 steps and increasingγvalues from 0.0001%to 100%(Table I)related to the measuring gap(0.004 m).More detailed information is available in Markgrafet al.(2006).The following rheological parameters(Fig.1)were determined:the end of LVR and YP,which are characterized by the values ofG′andG′′,the correspondingγandτ,the maximum shear resistance(τmax),and the summarizing soil stability parameter integralz(Iz),calculated as described by Haaset al.(2021a).Raw data were automatically extracted from the rheometer-inherent software using a software tool(Haaset al.,2021b).
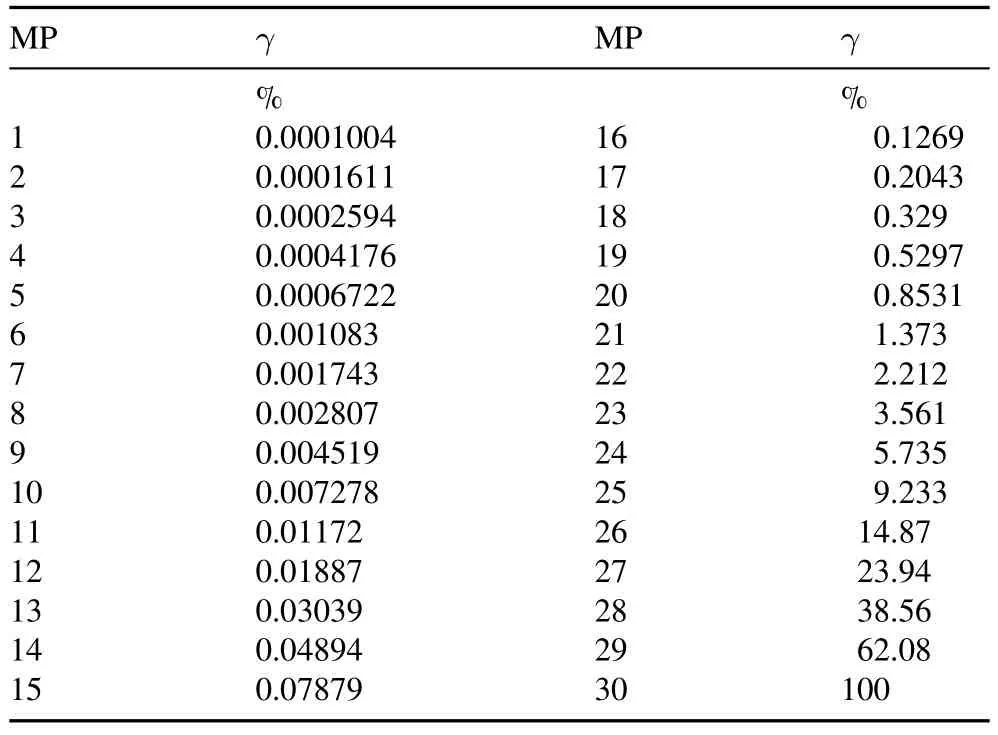
TABLE IMeasurement points(MP)and applied shear strains(γ)
Water content and additional soil analyses
The volumetric water content (θ) of each sample was determined prior to the rheological measurement and immediately after drying at 105°C for 24 h after the measurement was finished.Theθvalue was calculated by relating the weight loss to the dry sample weight,multiplied by the initial value ofρb(1.3 Mg m-3).Disturbed,air-dried,and sieved soil (<2 mm) was used for standard soil analysis.The pH value was determined in 0.2 mol L-1CaCl2.Total nitrogen was assayed photometrically by flow injection analysis according to Kjeldahl(Blumeet al.,2010).Inorganic carbon was determined using Scheibler analysis.The SOC concentration was calculated by subtracting the inorganic carbon concentration from total carbon concentration determinedviadry combustion at 1 200°C(Coulomat 702)(Ströhlein Instruments,Kaarst,Germany).Soil texture was determined according to Schlichtinget al.(1995)by combining sieving and sedimentation processes(pipette method)after the removal of cementing substances and the addition of 10 mL dispersion agent(0.5 mol L-1Na3(PO3)3).
Statistical analysis and used software
Statistical software R(R Development Team,2021)was used for data processing and evaluation,and ggplot2(Wickham,2009)was applied for visualization.To evaluate the application of theγvalues on the values of storage and loss moduli(G′andG′′,respectively)and shear stressτ,an appropriate statistical mixed model was defined(Laird and Ware,1982;Verbeke and Molenberghs,2000).The statistical model included shear strains (qualitative as measurement points(MPs)1—30),SP(qualitative as 1B,2A,2B,...,and 4B),sampling depths (qualitative as depths I,II,III,and IV;SP1 and depth V were not considered due to missing data),pretreatment (H2O2) (quantitative as 0 for samples pretreated without H2O2and 1 representing SOC-free primary particles),and corresponding interaction effects,which were included as fixed factors.The investigated replicates(A/B),subsamples(increment 1,increment 2,...,and increment 6),and nested effects were regarded as random factors.The data were assumed to be normally distributed and heteroscedastic owing to different levels of pretreatment.These assumptions were based on graphical residual analysis.Based on this initial model,a model selection(forward selection)based on Akaike information criterion(AIC) values (Akaike,1973;Sakamotoet al.,1986) was conducted to determine the covariates that could be used for prediction.The AIC is an estimator of prediction error.For a given dataset,AIC estimates the quality of each model relative to the other models(Akaike,1973).The considered covariates were water content and the parameters shown in Table II(SOC content,electrical conductivity,pH,and soil texture).Subsequently,covariates with a variance inflation factor(VIF)of 10 or higher were removed stepwise.Finally,non-significant covariates were omitted based on analysis of covariance(Cochran,1957).For the final model,a pseudo coefficient of determination,marginalR2,was calculated(Nakagawa and Schielzeth,2013),which is a measure of the proportion of variability explained by the fixed effects.
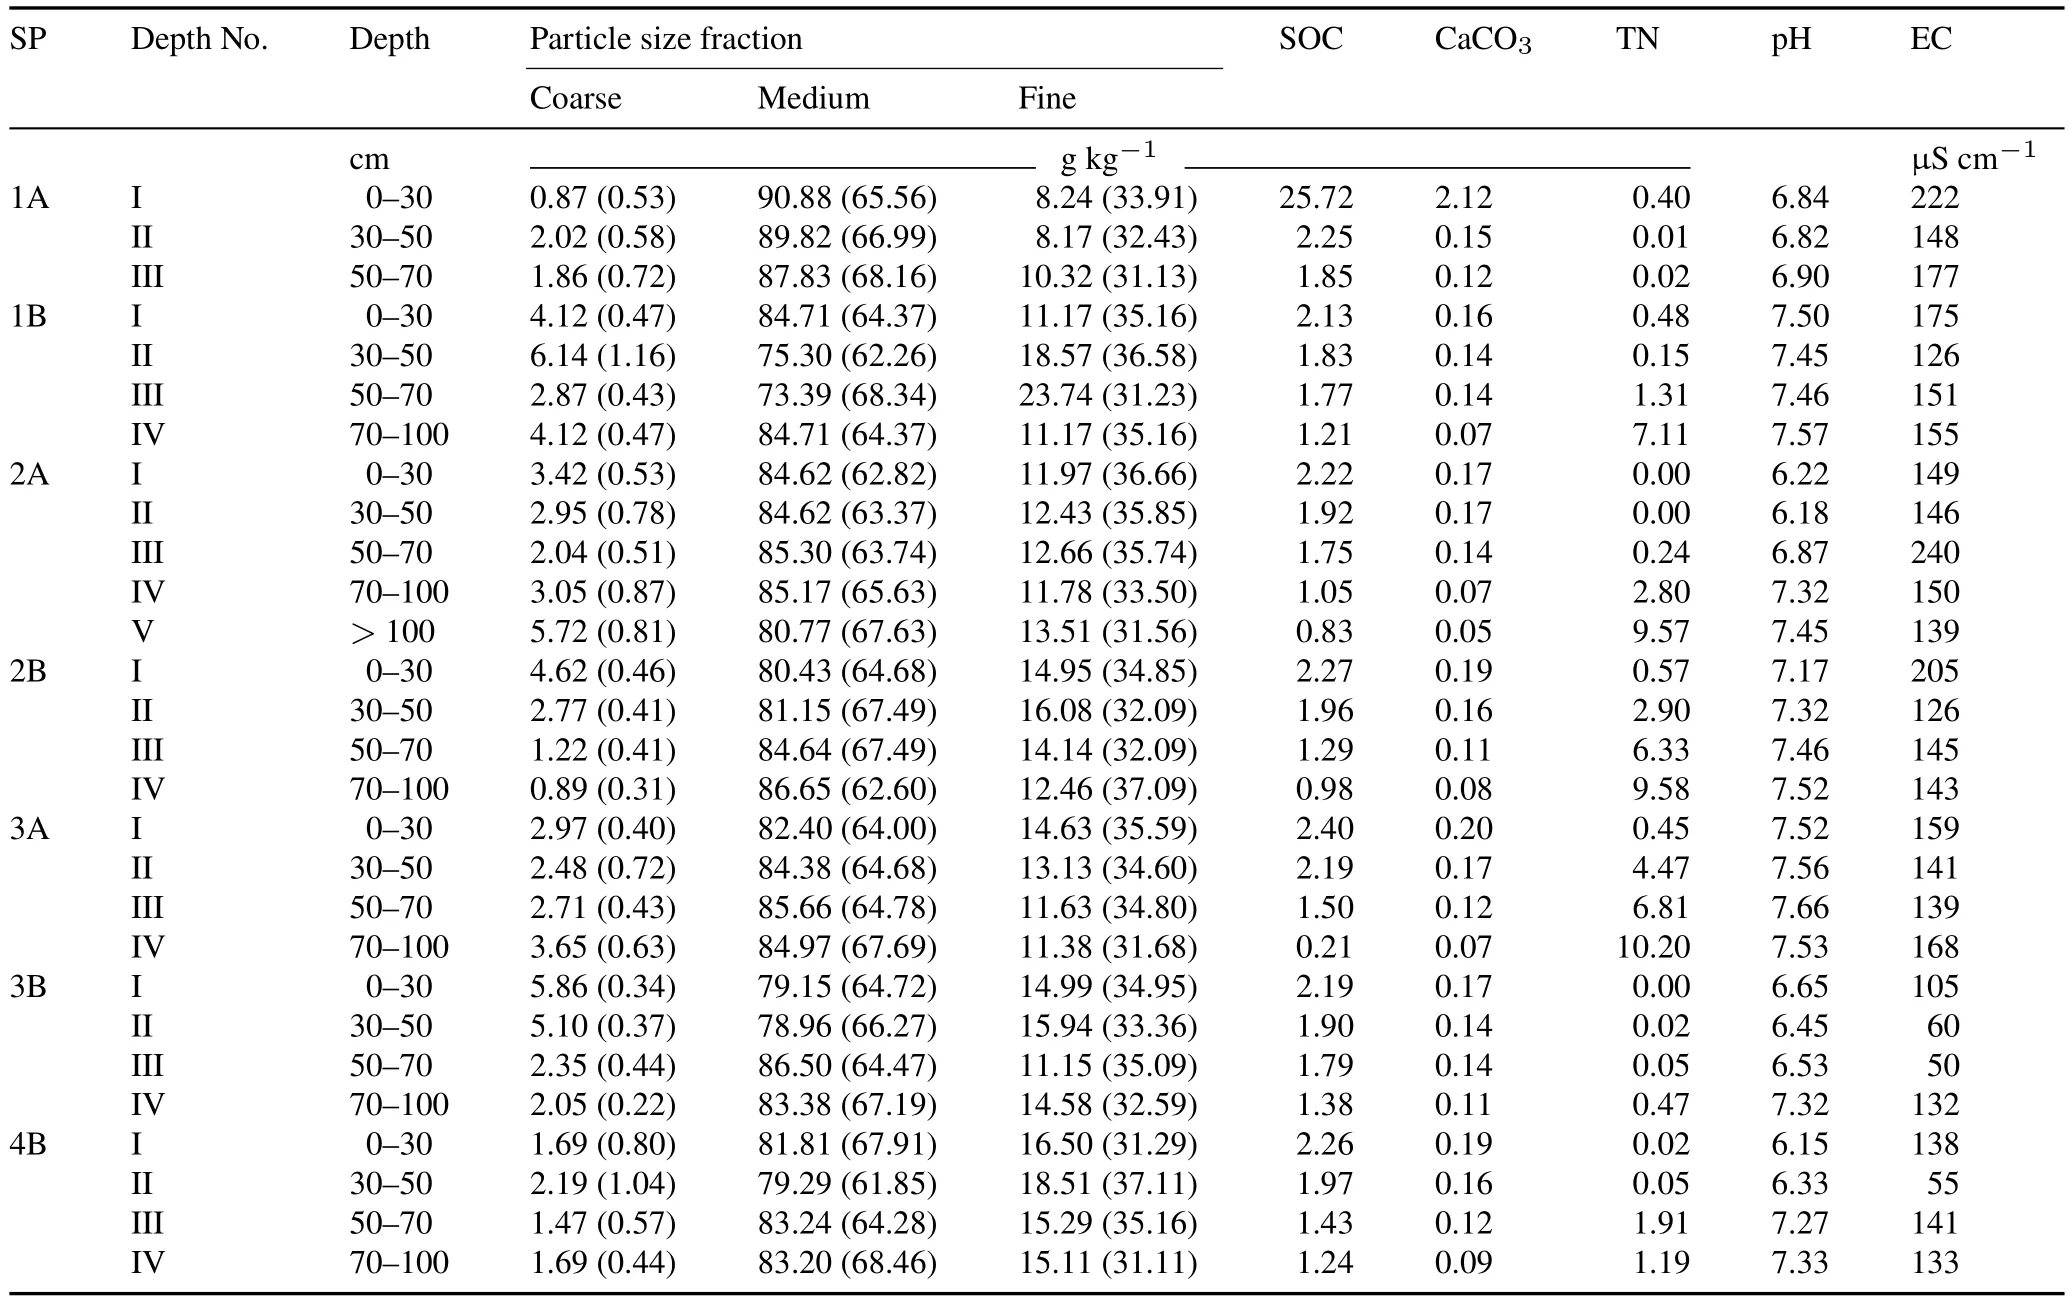
TABLE IISoil particle size fractions(coarse:630—2 000 μm;medium:2—630 μm;fine:<2 μm),organic C(SOC),calcium carbonate(CaCO3),total N(TN),pH,and electrical conductivity(EC)in seven soil profiles(SPs)at considered depths for aggregated(values outside brackets)and SOC-free(values in brackets)soil materials
RESULTS
Particle size analysis clearly indicated a coarser texture(increase in particle size fraction ≥2 μm)for aggregated than for SOC-free soil samples(Table II).The water content decreased in the majority of SOC-free soil samples compared to intact aggregates,whereas some samples showed increased water content after removing SOC(Fig.3).For each SP and soil depth,the median values of the normal force (FN)applied at the beginning of AST were higher for aggregated soil samples than for SOC-free soil samples(Fig.S1,see Supplementary Material for Fig.S1).NegativeFNvalues were found for SOC-free soil samples at all soil depths of SP 1A and for the uppermost horizon of SP 2A.

Fig.3 Pretreatment-induced changes in soil volumetric water content(ΔθH2O2)as a function of volumetric water content(θ)determined before amplitude sweep tests in soil samples collected from different soil profiles and soil depths.ΔθH2O2=θ without H2O2 treatment-θ with H2O2 treatment.
Theγvalues at the end of LVR (γLVR) (Fig.S2,see Supplementary Material for Fig.S2)increased,andGLVR(Fig.S3,see Supplementary Material for Fig.S3)andτLVR(Fig.S4,see Supplementary Material for Fig.S4)decreased for SOC-free soil samples compared to repacked soil samples with intact aggregates.At YP,the median values ofγYP(Fig.S5,see Supplementary Material for Fig.S5)were smaller for soil samples with intact aggregates than for SOC-free soil samples,except for SP 2B at depth II.The median values ofIz(Fig.S6,see Supplementary Material for Fig.S6)were greater for SOC-free soil samples than for aggregated soil samples,except for SPs 2B and 3B at depth II and SP 2A at depths II and III.The values ofτYP(Fig.S7,see Supplementary Material for Fig.S7)andGYP(Fig.S8,see Supplementary Material for Fig.S8)decreased or increased for soil samples with intact aggregates compared to SOC-free soil samples.The values ofτmax(Fig.S9,see Supplementary Material for Fig.S9)were greater for aggregated soil samples than for SOC-free soil samples at all depths,except for depth II and SPs 1A,1B,2B,and 4B at depth I.
The curves of shear stressτ(Fig.S10,see Supplementary Material for Fig.S10)revealed thatτincreased for soil samples with intact aggregates,compared to SOC-free soil samples,for almost all SPs and soil depths within the complete range of applied shear strains.The general form of these curves can be divided into three types: (i)τcontinuously increases with increasing shear strain until reachingτmaxfor some shear strains(approximately 1%for aggregated soil samples from SP 3B),andτcontinuously decreases with increase inγvalue;(ii)τcontinuously increases with increasingγvalues until reachingτmaxfor some shear strains,and it decreases before increasing again with increasingγvalues;(iii)τcontinuously increases with increasingγvalues until a local maximum is reached for some shear strains,and decreases before increasing again and reachingτmaxat the maximalγvalue equal to 100%.For the first two cases i and ii,τmaxwas located atγvalues larger thanγLVRand smaller thanγYP,and for case iii,τmaxwas reached atγvalues larger thanγYP.However,no general SP-or depth-dependent trends could be visually ascertained.
Results of statistical evaluation
Model selection was based on 17 428 observations and for all models,theR2values ranged from 0.972 to 0.987.Regarding soil physical and chemical parameters effective for parameter estimation,initialθvalue significantly(P <0.001) decreased theγ-dependent parameter values,i.e.,log10G′(Eq.3),log10G′′(Eq.4),and log10τ(Eq.5),and coarse particle content significantly(P <0.001)decreased log10G′′.None of the other covariates(Table II)were suitable for parameter estimation.
whereaG′(MP),bG′(SP),cG′(Depth),dG′,andeG′(H2O2)are the coefficients representing the effects of MP (i.e.,MPs 1—30),SP (i.e.,SPs 1B,2A,2B,...,and 4B),soil depth (Depth,i.e.,depths I,II,III,and IV),volumetric water content(θ),and pretreatment(H2O2,0 for samples pretreated without H2O2and 1 representing SOC-free primary particles) on parameterG′estimation,respectively;fG′(H2O2:MP),gG′(H2O2:SP),andhG′(H2O2:Depth)are the coefficients representing the interaction effects of H2O2,MP,SP,and Depth on parameterG′estimation;aG′′(MP),bG′′(Depth),cG′′,dG′′,andeG′′(H2O2)are the coefficients representing the effects of MP,Depth,θ,coarse particle content,and H2O2on parameterG′′estimation,respectively;fG′′(MP:H2O2)is the coefficient representing the interaction effect of MP and H2O2on parameterG′′estimation;aτ(MP),bτ(SP),cτ(Depth),dτ,andeτ(H2O2) are the coefficients representing the effects of MP,SP,Depth,θ,and H2O2on parameterτestimation,respectively;fτ(H2O2:MP),gτ(H2O2:SP),hτ(H2O2:Depth),andiτ(SP:Depth)are the coefficients representing the interaction effects of H2O2,MP,SP,and Depth on parameterτestimation.
However,none of the considered parameters were described with covariables solely,but were a function of H2O2,MP,SP,Depth,and/or interaction of such factors (e.g.,H2O2:MP).The equations were simplified for the soil materials without SOC depletion,because the pretreatment was considered a quantitative factor with value 0 denoting the soil material without SOC depletion.The values of the coefficients such asaG′(MP),bG′(SP),...,iτ(SP:Depth),confidence intervals,and statistical probability(Pvalues)are given in Tables SI—SIII(see Supplementary Material for Tables SI—SIII).TheG′values decreased with decreasing SOC content(more intense SOC depletion),as reflected by the value ofeG′(H2O2)(—0.58)for MPs 1—28.For MPs 29 and 30(withγvalues of 62%—100%)in SPs 2A,2B,and 3A at depth IV,the sum of the coefficients representing the interaction effects between H2O2and MP(fG′(H2O2:MP)),SP (gG′(H2O2:SP)),and Depth (hG′(H2O2:Depth)) were larger than 0.58,thus counteracting the effect ofeG′(H2O2),which resulted in increasingG′values with SOC depletion.
The value of coefficienteG′′(H2O2) (—0.53) indicates decreasingG′′values with increasing SOC reduction(Eq.4).The values ofG′′increased with decreasing values ofθand coarse particles(630—2 000 μm).Negative values offG′′(MP:H2O2)for MPs 1—23 indicate a further reduction inG′′values,and for MPs 24—30,the values offG′′(MP:H2O2)were positive but still smaller thaneG′′(H2O2)values,indicating a decrease inG′′with increasing SOC depletion.
Regarding shear stressτ(Eq.5),the effect of pretreatment(as expressed by coefficienteτ(H2O2)equal to-0.57)indicates significantly decreasedτvalues required to achieve the deformation of SOC-free soil samples.Considering all the interaction effects of pretreatment,decreasedτvalue with SOC-free soils were only observed for MPs 1—26.Pretreatment caused increasedτvalues for MPs 27—30 in SPs 2A,2B,and 3A at the lowest depth(depth IV),as indicated by the values ofeτ(H2O2)larger than the sum offτ(H2O2:MP),gτ(H2O2:SP),andhτ(H2O2:Depth).
DISCUSSION
Zimmermann and Horn(2020)investigated the effect of binding agents on particle size distribution and found that generally all pretreatments refined soil texture.For example,soil texture changes from clayey silt with water-stable aggregates to silty clay after the aggregates are destroyed and dispersed.The increased coarse particle content of soil materials without pretreatment was ascribed to the preservation of aggregates formed by cementing and gluing agents(Zimmermann and Horn,2020).Zimmermann and Horn(2020) intended to document the vast difference between lab analyses andin situconditions and the consequences for the values of parameters used to describe soil properties and functions.In the present study,the aim was to document the importance of SOC for aggregate strength during shearing.Soil stability,in terms of shear resistance,angle of internal friction,cohesion(Baumgartl and Horn,1990),and penetration resistance(da Veigaet al.,2007),increases with aggregation,and penetration resistance is also found to be a function of microaggregation(Haas and Horn,2018).
The increased values of the shear resistance parameters(τLVR,τYP,andτmax)andFNfor aggregated soil samples reflect the increased soil stability compared to SOC-free soil samples.These trends were also confirmed by Markgraf and Horn(2007),who documented the enormous impact of SOC on microscale strength,even in iron-rich Oxisols from Brazil.In addition to the effect of SOC,ploughing (as a kind of homogenization)reducesτYPby up to 33%(Buchmann and Schaumann,2018).Furthermore,Holthusenet al.(2019)found reduced values forτLVRandτYPin homogenized soil samples compared to structured samples.This is caused by an increased number of particle-particle contact points,leading to increased values of apparent cohesion and angle of internal friction and resulting in increased shear resistance,which explains the increasedτvalues in aggregated soil samples.Additionally,τincreases withFN(Baumgartl and Horn,1990),and in our experiments,the increased values ofFN,G′,andτshow that the amount of energy applied to aggregated soil samples was much higher than that to SOCfree soil samples.Following the results of Holthusenet al.(2017),the rheological parameters increased with increasingFN,except forγYPandIz,where the values decreased with increasingFN.Consequently,to better compare the rheological parameters,FN-andγ-controlled ASTs should be the method of choice (Holthusenet al.,2017,2019).The trimming of sample height aimed at minimizing the variability of vertical stresses(i.e.,normal stressσN,equal toFNrelated to the contact area of rotating bob and soil sample)(Holthusenet al.,2017;Pértileet al.,2018).For our own data,where all samples were trimmed,the increasedFNvalues for samples with intact aggregates reflect increased aggregate stability.Two processes may be responsible for the increasedFNvalues:the trimming procedure and vertical stress application may result in the formation of new,non-water-saturated surfaces.If these newly formed surfaces begin to swell,the swelling pressure increasesFN.For the SOC-free soil materials,aggregates were destroyed more intensely by pretreatment with H2O2than by pretreatment with H2O for aggregated soils.Thus,this effect is expected to be more pronounced for samples with intact aggregates,because the accessible surfaces is reduced with aggregates when compared to that of homogenized soil materials(Hornet al.,2019),which explains the observed data.Additionally,the angle of internal friction and cohesion increase with increasing SOC content and a more pronounced aggregation(Baumgartl and Horn,1990);consequently,the shear resistance increases,which was also observed for the samples in the present study.If a defined stress is applied vertically to a soil sample that is not hindered by horizontal movement,the soil remains in position,counteracting the increased shear resistance to deformation(for aggregated soils).The mechanical stress is reduced in the horizontal direction when applied shear stress exceeds shear resistance(for SOC-free soils with lower shear resistance).This is visible in the soil material that is squeezed out of the measuring gap(in the horizontal direction),resulting in reducedFNvalues.The increased number of particle-particle contact points is also reflected by the increased values of elastic modulus(Khaidapovaet al.,2016).Negative values forFNwith SOC-free soils were caused by a water meniscus formed between rotating bob and soil material when water was squeezed out of waterfilled pores,which were compressed and reduced in volume upon the first contact with rotating bob.These aggregate effects were also described by Hornet al.(2020) and are in agreement with the shear and cyclic loading results of Huanget al.(2021).
Aggregation and particle shape effects on rheological and shear parameters
Rheological and shear resistance parameters do not have to follow the same patterns(Pértileet al.,2018),because rheological parameters are more affected by electrostatic forces,that act between particles as a function of clay type,specific surface,cation exchange capacity,type and amount of exchangeable cations,distance between clay particles(density),and soil solution characteristics(Markgraf and Horn,2006;Holthusenet al.,2012;Pértileet al.,2018).Holthusenet al.(2019)appliedFN-and deformation-controlled ASTs to soil samples with intact soil structure and to soil samples repacked after homogenization(i.e.,sieved to particle sizes≤2 mm)to investigate the effect of aggregation on shear resistance and soil rheological parameters as a function of the appliedFN.Holthusenet al.(2017,2019) found that theγLVRandG′values increased with increasingFNand decreased in disaggregated soil samples compared to structured ones.The authors concluded that the materials became more elastic with increasingFN,indicating increased soil stability owing to an increased number of particle-particle contact points and that increasing bulk density coincided with an increased soil stability,e.g.,in terms of soil rheological parameters.However,in our experiments,only bulk density of 1.3 Mg m-3was considered,and theFNvalues increased and theγLVRvalues decreased for soil samples with intact aggregates when compared to soil samples with SOC-free primary particles.In contrast to other studies that investigated soils rich(>400 g kg-1)in clay or sand(coarse particles 630—2 000 μm) (Holthusenet al.,2019)and partially containing pseudosand(Pértileet al.,2018),the soils considered in this study were dominated by silt.Sands and pseudosand are spherical-shaped,whereas silt particles are platy-shaped.Spherical particles start rotating,whereby energy is irreversibly lost,which leads to significantly smallγYPvalues with increasing sand content.This is also in agreement with the findings of Batistãoet al.(2020) and Markgraf and Horn(2006),who observed lowerγYPvalues in a sandy loam Haplic Chernozem than in a silty loam Luvisol.Because of pretreatment,the shape of microaggregates is also expected to be more spherical,because in this configuration the samples have the greatest rigidity.Thus,for any givenγvalue,the amount of energy available to fully reverse the deformation is increased for platy particles as compared to spherical particles;for the latter one,energy is lost if those particles begin to rotate,which explains the increased values ofγLVRandγYPfor SOC-free soil samples.However,the amount of energy needed to move spherical aggregates is expected to increase compared to single silt particles,owing to the mass and volume differences,which explains the decreased values ofτLVRandτYPfor SOC-free soil samples.Thus,a single parameter,such as bulk density,is insufficient to derive soil stability parameters.
Effects of SOC on rheological and shear parameters
Markgrafet al.(2012),Khaidapovaet al.(2016),and Batistãoet al.(2020) also reported that SOC caused an increase in the values of rheological parameters.Markgrafet al.(2012)investigated the influence of organic matter on the rheological properties of soil samples from a long-term experimental site in Broadbalk,Rothamsted,UK,with AST and the same settings applied here.The authors considered the upper 20 cm layers of i)seven arable plots,all planted with continuous wheat and each with a long history of receiving different amounts of mineral N fertiliser and/or farm-yard manure,with SOC content from 8 to 28 g kg-1,ii)the Broadbalk wilderness,an area of the site that has been un-cropped since 1882,with 40 g kg-1SOC,and iii)a bare fallow area,that is,a strip of land with the same silty loam soil type but from the Highfield Experiment,an area that has been kept free of plants for 50 years by regular tillage,with 11 g kg-1SOC.For saturated soil samples,the values ofIzwere 24 for the bare fallow plot,28—34 for the arable plots,and 40 for the wilderness plot.The authors stated that the low value ofIzfor the bare fallow plot was caused by a textural effect(more silty soil),whereas the increased value for the wilderness plot was caused by the high SOC content(mainly roots).The authors concluded that the effect of SOC on soil rheological properties was the most apparent in saturated soil samples.However,the SOC content was not identified as a significant factor when evaluated by ANOVA.Additionally,the minimum and maximum values of SOC content,based on linear regression analysis,were explained by textural effects(minimum SOC for the bare fallow plot)or by plant roots(maximal SOC content for the wilderness plot).In contrast to the findings of Markgrafet al.(2012),Haaset al.(2021a)derived pedotransfer functions from AST,covering samples of the main textural classes and reflecting a wide range of physicochemical parameters such as soil pH value.The values ofIzdecreased with increasing SOC content,which was explained by the lubricant and waterstoring effects of SOC.This leads to a more rapid water saturation with increasing SOC content,and consequently,to a total loss of apparent cohesion due to the loss of water menisci forces (Horn,2003;Huanget al.,2021) for any given matric potential(<-15 kPa).
Khaidapovaet al.(2016)applied ASTs to soil samples from grasslands(steppe),forests,and arable land use systems.The samples with more organic matter (virgin land,oak forest,and forest belt)behaved more plastic and had a higher resistance to mechanical loads.The samples with less organic matter (long-term fallow and plowland) had a more rigid interparticle cohesion and were less resistant to loads,which is also true for the soils evaluated here.Unfortunately,the results were not evaluated statistically,nor was soil structure or texture considered.Batistãoet al.(2020)simulated the effect of SOC losses of ten archaeological dark earths using three intensities of H2O2-pretreatment.However,the SOC content was not significantly correlated with any of the rheological or shear parameters,but a significant interaction of the SOC content and soil texture was found;namely,with an increasing ratio of SOC to clay content,the shearing parameters (τLVRandτmax) increased significantly.Haaset al.(2018) simulated increased SOC content by adding model substances of biological exudates,namely xanthan gum(Xan)and polygalacturonic acid(PGA),and applied ASTs with the same settings described here.The authors found that the water content increased with increasing model substance addition,but for the rheological parameters,the effect was inconsistent.For lowγvalues(up to MP 15),theG′value increased with increasing addition of PGA,but the same effect was not observed with addition of Xan.TheG′′value significantly increased with increasing addition of both model substances,and the effect was pronounced only up to MP 15 for Xan or MP 20 for PGA.The loss factor increased with increasing addition of Xan and PGA until a critical MP was reached,but significantly decreased with further addition of PGA and,consequently,with increasing SOC content.Thus,the SOC content is not a sufficient measure because differing SOC qualities can have opposite effects on soil stability(i.e.,shear and rheological)parameters.
Effects of soil hydraulics on rheological and shear parameters
Hydrophilic SOC is known to increase water content at any given matric potential.However,SOC can also be hydrophobic and decrease water content with increasing SOC content.The presence of hydrophobic SOC may explain the decreased volumetric water content in some of the soil samples with intact microaggregates.This can also be explained by the effects of aggregation and SOC on the pore system.The accessibility of soil surfaces and,consequently,of the pore spaces increases with homogenization (Hornet al.,2019),which may also reduce the bottleneck effect due to a more homogeneous distribution of pore volumes.Hallettet al.(2003)reported that SOC can clog pores.Furthermore,the effect of shearing or rotation on soil strength in combination with SOC must be considered.If shearing forces are applied in AST,the strengthening effects of SOC can be counteracted or at least reduced.This is because the shear-induced increase in tortuosity (Horn,2003) further declines hydraulic conductivity(Whalleyet al.,2012).In combination with the increased water content of the aggregated soil materials,positive water pressure arises with less strain,indicating decreased soil stability for soils with natural SOC content,as compared to SOC-free primary particles.Equations applied to predict the saturated hydraulic conductivity (ksat) as a function of specific surface area(SSA)or bulk density are given by Whalleyet al.(2012).They can be potentially applied to estimate the effects of SOC depletion because alterations in SSA and bulk density can be expected with SOC depletion.However,a threshold value of acceptable SOC depletion could not be derived before significant changes in theksatvalue with negative impact on soil stability occur,because of missing data(i.e.,SSA)or missing variation in data(bulk density was defined within experimental setup).
Consequently,the hypothesis that SOC generally increases the mechanical soil stability must be rejected.In fact,SOC can increase or decrease the mechanical soil stability,depending on the actual soil water status and the applied shear strains.The applied shearing forces induce several processes such as water redistribution and alteration of the pore system.Measurements of soil matric potential would be critical for understanding the underlying coupled mechanical and hydraulic processes and interactions in three-phase system soils.The derived pedotransfer functions for the prediction of rheological and shear parameters from soil parameters,such as coarse particle and water contents,as well as aggregation status,indicate that the responsible mechanisms and processes of soil deformation behaviour at the microscale are linked to(macroscopic)soil parameters.A wide range of soils should be investigated using AST and the results must be evaluated statistically to better explain soil rheological flow behaviour based on soil processes and soil physical and chemical parameters.
CONCLUSIONS
Soil samples repacked from disturbed soil materials with intact water-stable microaggregates(<2 mm)and with SOCfree primary particles were subjected to amplitude sweep tests to derive rheological and shear parameters.The results showed that the formation of aggregates with SOC led to increased energy application required to achieve any given shear strain.This implies that with decreasing SOC content,the soil becomes more easily deformed,which amplifies the risk of additional soil compaction and leads to less favourable conditions for plant production.The hypothesis that rheological and shear parameters indicate increased soil strength for soil samples with intact microaggregates,as compared to SOC-free soil materials,was only confirmed for the shear parameters,where the gluing and cementing effects of SOC increased the shear resistance.Rheological parameters indicated reduced soil stability in terms of viscoelasticity with aggregated soil samples,e.g.,for the summarizing parameter of soil stability(Iz)and the applied shear strains(γLVRandγYP).The change from spherical to platy aggregates for SOC-free soil samples augmented the values of rheological parameters for SOC-free soils,because the energy applied during shearing was lost more easily with rotating spherical bodies,which were found in aggregated soil samples.The measured parameters were significantly influenced by soil physical parameters,such as coarse particle(630—2000 μm)and water contents,as found in the statistical evaluation.In future studies,microtensiometers should be used to consider the interaction between soil hydraulics and soil mechanics.
ACKNOWLEDGEMENT
The authors sincerely thank Ms.Doris Rexilius and Ms.Sudelia Kneesch from the Institute for Plant Nutrition and Soil Science,University of Kiel,Germany for conducting the ASTs and particle size analysis used for this study.
SUPPLEMENTARY MATERIAL
Supplementary material for this article can be found in the online version.
- Pedosphere的其它文章
- Carbon farming by recarbonization of agroecosystems
- Root exclusion methods for partitioning of soil respiration:Review and methodological considerations
- Utilization of lignocellulosic plant residues for compost formation and its role in improving soil fertility
- A critical review of microbially induced carbonate precipitation for soil stabilization:The global experiences and future prospective
- Hand-feel soil texture observations to evaluate the accuracy of digital soil maps for local prediction of soil particle size distribution:A casestudy in Central France
- Influence of soil physicochemical properties,particle size fractions and mineralogy on the leaching potentials of arsenic and antimony in abandoned mine soils