水+甲烷系统的气液相边界曲线和临界线
2012-12-12 02:42田玉芹田宜灵朱荣娇
物理化学学报 2012年8期
田玉芹 田宜灵 赵 林 朱荣娇,* 马 超
(1长江大学石油工程学院,湖北荆州434023; 1§天津大学理学院化学系,天津300072; 2中国石油化工股份有限公司胜利油田采油工艺研究院,山东东营257000)
1 Introduction
The modern abiotic-origin theory of methane and numerical modeling show that new resources are most likely to be located at deep subsurface levels and characterized as high temperature and high pressure gas reservoirs.1-4This abiotic theory,if true,could affect estimates of the potential future oil and gas reserves.Determining the thermodynamic properties of systems containing methane at high temperature and pressure is key in understanding carbon-reservoir fluxes within the deep Earth.Deep hydrocarbon gas reservoirs would produce huge amounts of water(liquid or vapor)during their production periods.Hence,many studies have been done on water-methane mixtures.3-16For example,Mohammadi et al.17performed low-pressure(ca 0.1-34 MPa)and low-temperature(273-340 K)measurements.Yarrison et al.18published data at a pressure of 110 MPa.As oil and gas exploration moves to wider depths, both on-and off-shore,reservoir pressures are frequently about 150 MPa,beyond the range of reasonable extrapolation from existing data.To gain a better understanding of the phase behavior of these industrially-important,highly-non-ideal systems at all relevant conditions,the thermodynamic properties at higher pressures over a wide range of temperatures are needed.Knowledge of the location of the critical curve and of the two-phase equilibrium,binodal surface in the p-T-x diagram is also desirable to determine the extent of the homogeneous one-phase region.
In the present paper,we report on measurements of a series of isothermal gas-liquid boundary lines of water+methane system over a wider range of temperature(from 433.0 to 633.0 K) and pressures up to 300.00 MPa.The critical curve was also determined.The equilibrium gas-liquid ratios,the partial molar solution enthalpy,and partial molar solution entropy of methane in water were calculated.These data will be useful for natural gas recovery in the near future.
2 Experimental
2.1 Materials
Methane(99.99%purity)was supplied by Tianjin Special Gas Company(Tianjin)and used without further purification. Three-time distilled water was repeatedly melted and frozen in vacuum to degas the water.The conductance of the water was found to be 0.1 μS·cm-1.
2.2 Experimental apparatus
The setup of the experimental apparatus used has been described in detail elsewhere19-22;a schematic diagram is given in Fig.1.The main part of the apparatus was a high-pressure viewing cell constructed from a high-strength corrosion-resistant nickel-based superalloy;it had a length of 30 cm,an outer diameter of 8 cm,and an inner diameter of 2 cm.A moveable piston was situated inside the cylinder autoclave.The piston separated the contents in the cell from the pressure medium(silicon oil).At one end of the autoclave was a sapphire(Al2O3)window.Both window and piston were sealed by a pair of O-rings (made of Perfluoroelastomer).The front side of the piston had a platinum-plating mirror to aid visual observation.The pressure within the system was generated manually with an operated screw-driven pump and measured with a pressure sensor (CYB-20 S)calibrated against a dead-weight gauge.Pressure uncertainties were within±0.01 MPa at pressures below 100.00 MPa and within±0.05 MPa at pressures from 100.00 MPa to 350.00 MPa.Outside the autoclave,independent heating and cooling jackets controlled the temperature of the system.
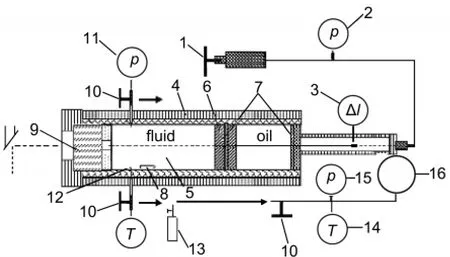
Fig.1 Schematic diagram of the high-pressure apparatus1:screw-driven pump,2:pressure meter,3:hall probe,4:heat jacket,5:cell, 6:position,7:O-ring,8:stirrer,9:sapphire window,10:sampling valve, 11:pressure sensor,12:thermocouple,13:small steel vessel, 14:thermometer,15:vacuum meter,16:steel bulb
Homogeneity in mixing and temperature was achieved by magnetic stirring and the temperature measured with a calibrated chromel-alumel thermocouple inside the autoclave.The thermocouple was calibrated against precision mercury thermometry or with the melting points of tin(Sn),lead(Pb),and zinc(Zn).Temperature uncertainties were±0.1°C at temperatures below 250.0°C and about±0.3°C at temperatures above 250.0°C.The accuracy of the weighted mass was 0.1 mg.The estimated total uncertainty for the mole fraction of each substance was 0.1%.
2.3 Experimental procedure
Methane and water were introduced separately into the cell. Initially,a weighed quantity of methane was introduced into a dried,evacuated autoclave.If more gas was required the autoclave was first cooled with refrigerated glycerin.According to the desired mole fraction,the needed quantity of degassed water was injected with a calibrated screw press.The temperature was increased slowly(2-3 K·min-1)to the desired temperature.During this process,each sample was stirred continuously.The filled sample at constant temperature was carefully compressed or decompressed.The transition from two-phase to single-phase or vice versa could be visually observed and found with a light beam mirror.As is well-known,phase equilibria can be affected by temperature and pressure;the system will create many micro-drops when a new phase just appears. At this moment,one can observe through the sapphire window that the system became thick,then gradually darken;i.e.,the dark hole effect.Pressure and temperature were then recorded. Each recording was repeated three times to determine reproducibility of data.
The mole fraction was determined by the desorption method.Samples were taken from the autoclave into an evacuated and weighted small steel vessel.The cooled sample vessel was connected to a glass bulb of known volume.The temperature of the bulb was measured with a thermometer to a precision of 0.1 K.The pressure inside the bulb was measured with an absolute-pressure meter with a precision of 10 Pa.Because the pressure of the desorbed methane gas was very low(about 10 to 20 kPa),the amount of methane was easily calculated using the ideal-gas state equation from which the mole fraction can be obtained.The procedure has been described in more detail elsewhere.19-22The critical-point data were obtained by successive approximations.Nearly the same fractions of gas and liquid at a fixed temperature were obtained through slight adjustments of pressure.
3 Results and discussion
3.1 Phase boundary lines and critical curve
The measurements were performed at temperatures from 433.0 to 633.0 K and for pressures up to 300.00 MPa.Table 1 gives the p,T,x data on the gas-liquid phase boundary lines for water+methane system.Fig.2 shows the projections of thirteen isopleths(p-T)and the estimated critical curve.These isopleths are the boundary lines between the two-phase and single-phase regions.The two-phase region is always on the left of each isopleth;the critical curve is the envelope of the isopleths in the pT-plane.
The isothermal p-x curves obtained from experimental data are shown in Fig.3.The form(shape)of the critical curve for this system is demonstrated also in the p-x projection of the phase diagram,where the isotherms between the critical temperature minimum(625.0 K)and the critical temperature of water are divided into two branches.The lines on the left of the critical curve are gas-phase lines;the lines on the right are liquid-phase lines.Between the lines is the two-phase region. This study provides a complete description of the gas-liquid behavior.
At very high pressure(or high phase density),the repulsive force between water and methane molecules becomes important,as density(or pressure)rises.Methane in water or water in methane is“squeezed out”of the solution.At elevated temperatures and pressures,an important fact has been found:the mutual solubilities of water in the dense methane gas phase and those of methane in water are consistent.The same phenomena has been observed in H2O+N2and H2O+CO2systems examined by Tabasinejad et al.23
The critical pressures,temperatures,and mole fractions for this system are compiled in Table 2.Fig.4 shows its criticalcurve in the p-T plane as well as the critical data in references.5,24Experimental results and results from the literature show good agreement.The behavior of the critical curve indicates that,in common with other(water+alkane)systems,the water+ methane mixture is a type III system.The critical curve begins at the critical point of pure water(22.05 MPa,647.3 K),then proceeds to lower temperatures with increasing pressure;the curve has a minimum at temperature of 625.0 K after which it proceeds upwards.

Table 1 Experimental data of the phase equilibrium boundary surface for water+methane system

Fig.2 Curves of constant composition(isopleths)along the liquidgas two-phase boundary surface for water+methane system■,x=0.100;●,x=0.200;▲,x=0.300;▼,x=0.400;►,x=0.500; ,x=0.600;★,x=0.700;□,x=0.780;○,x=0.800;△,x=0.810;▽,x=0.840;▷,x=0.900;☆,x=0.950;⊗,the critical point of water.The dashed line is the estimated critical curve of the mixture; the dotted line is the saturation pressure curve of water;the solid lines are aids to better visualize the curves.

Fig.3 Isothermal two-phase boundary curves in the pressure-composition projection for water+methane system□,433.0 K;○,553.0 K;△,573.0 K;▽,603.0 K;◇,623.0 K;▷,626.0 K;◁,628.0 K;☆,633.0 K.The broken line is the critical curve of the mixture.The solid lines are only for better visibility of the data curves.

Table 2 Estimated critical pressure(pc)and critical mole fraction(xc(H2O))at critical temperatures(Tc)

Fig.4 Critical curve in the pressure-temperature projection for water+methane system●,experimental data;○,reference5;▲,reference24;★,the critical point of water
For a binary mixture,a liquid(L)phase with mole fractions x1and x2(subscript 1 refers to water and 2 refers methane)is in equilibrium with the gas(G)phase with mole fractions y1and y2.The equality of the equilibrium is

where f andϕare the fugacity and fugacity coefficient,respectively.
The equilibrium gas-liquid ratios(K)for the two components are given by

The K values for the pressures of 75.00 to 225.00 MPa and temperatures from 603.0 to 628.0 K were calculated and plotted in Fig.5.
3.2 Henry coefficient of methane in water
From Table 1 and Fig.3,solubility of methane in water is observed to increase slightly with increasing pressure at constant temperature,and the relationship of the pressure and mole fraction of methane in water is nearly linear;thus,Henry law can be applied.We calculated the Henry coefficients(H)of methane in water at different temperatures.
From thermodynamics,Henry law is given by

where p is the total pressure of system,Hiis Henry coefficient of methane in water,a and γare activity and activity coefficient of methane in water,respectively,yiis the mole fraction of methane in gas phase,ϕiis its fugacity coefficient,and xiis the mole fraction of methane in liquid phase.Since the solubility of methane in dilute solutions is very small{x(CH4)<<1},we can set γ(CH4)≈1;therefore,

Fig.5 K-p plots for the water+methane system at various temperatures■and□,573.0 K;●and○,603.0 K;▲and△,623.0 K;▼and▽,626.0 K;◆and◇,628.0 K;★and☆,633.0 K.Solid points represent the liquid phase, and unfilled symbols represent the gas phase;solid lines are only to provide a visual guide to the data.

where methane fugacity coefficients were obtained from the webpage.25The calculated Henry coefficients at different temperatures are listed in Table 3;in the temperature range we studied,coefficient values decrease with increasing temperature.That trend can be observed in similar systems containing water.26
3.3 Solution properties of methane in water
The temperature derivation of the solubility,as calculated from the Gibbs-Helmholtz equation,is directly related to either the partial molar enthalpy or partial molar entropy of the gaseous solute in the liquid phase.If there is no specific chemical interaction between solute and solvent,it can be obtained by the thermodynamics equations:

where xidenotes the mole fraction of methane(solute)in water (solvent)at saturation for the investigated system,and ΔsolHiand ΔsolSiare respectively the partial molar solution enthalpy and partial molar solution entropy of methane during dissolution.The calculated values of ΔsolH and ΔsolS are listed Table 4; slight changes are seen for ΔsolH and ΔsolS at different pressures.
To understand the significance of the solution enthalpy andsolution entropy,the dissolution process is conveniently divided into two parts:condensation and mixing.Usually,the first term is negative and its absolute value is very small.Since the temperature coefficient of solubility is positive and large in quantity,the enthalpy of mixing dominates the dissolution process.Thus,the difference in the cohesive energy density between methane and water is very large.

Table 3 Henry coefficient of methane in water at temperatures

Table 4 Partial molar solution enthalpy(ΔsolH)and entropy (ΔsolS)of methane in water
4 Conclusions
To gain a better understanding of the phase behavior of methane reservoirs of fluxes in the deep earth,the critical curve and a series of isothermal gas-liquid boundary lines of water+methane system in a wider range of temperature(from 433.0 to 633.0 K)and pressures up to 300.00 MPa were determined.Measurements were obtained using the static method with a high-pressure volume-variable autoclave.The experimental results showed that at elevated temperatures and pressures the mutual solubilities,namely,those of water in the dense methane gas phase and methane in water,were consistent.Henry coefficients of methane in dilute solutions,partial molar solution enthalpy,and partial molar solution entropy were also calculated.The results showed that mixing dominates the dissolution process compared with condensation and the difference in the cohesive energy density of methane and water is very larger.These data and results will be useful in near-future natural gas recovery.
(1) Juske,H.;Michael,E.B.Science 1999,285,1055.doi:10.1126/ science.285.5430.1055
(2)Anton,K.;Vladimir,G.K.;Alexander,F.G.Nature Geoscience 2009,2,566.doi:10.1038/ngeo591
(3) Committee to Review theActivitiesAuthorized Under the Methane Hydrate Research and DevelopmentAct of 2000. Charting the Further of Methane Hydrate Research in the Untied States;Washington,D.C.:The NationalAcademies Press,2004.
(4) Sloan,E.D.;Koh,C.A.Clathrate Hydrates of Natural Gas,3rd ed.;CRC Press:Boca Raton,Fla,USA,2008;pp 58-125.
(5) Neichel,M.;Frank,E.U.J.Supercritical Fluids 1996,9,69. doi:10.1016/S0896-8446(96)90000-5
(6) Tian,Y.L.;Zhao,X.F.;Chen,L.J.Supercritical Fluids 2004, 30,145.doi:10.1016/j.supflu.2003.09.002
(7)Geng,C.Y.;Ding,L.Y.;Han,Q.Z.;Wen,H.Acta Phys.-Chim. Sin.2008,24,595.[耿春宇,丁丽颖,韩清珍,温 浩.物理化学学报,2008,24,595.]doi:10.3866/PKU.WHXB20080409
(8) Zhu,R.J.;Li,H.L.;Hao,J.S.;Li,H.S.;Tian,Y.L.Trans. Tianjin Univ.2009,15,276.[朱荣娇,李洪玲,郝纪双,李贺松,田宜灵.天津大学学报,2009,15,276.]doi:10.1007/ s12209-009-0049-7
(9)Wan,L.H.;Yan,K.F.;Li,X.S.;Fan,S.S.Acta Phys.-Chim. Sin.2009,25,486.[万丽华,颜克凤,李小森,樊栓狮.物理化学学报,2009,25,486.]doi:10.3866/PKU.WHXB20090315
(10) Olds,R.H.;Sage,B.H.;Lacey,W.N.Ind.Eng.Chem.1942, 34,1223.doi:10.1021/ie50394a018
(11) He,J.P.Analytical Instrumentation 2011,No.5,52.[何继平.分析仪器,2011,5,52.]
(12)Yarrison,M.;Song,K.Y.;Cox,K.R.;Chronister,D.;Chapman, W.Water Content of High Pressure,High Temperature Methane,Ethane and Methane+CO2,Ethane+CO2;GPA RR-200;Gas ProcessorsAssociation:Tulsa,OK,2008.
(13) Sun,S.C.;Liu,C.L.;Ye,Y.G.;Jiang,Q.Acta Phys.-Chim. Sin.2011,27,2773.[孙始财,刘昌岭,业渝光,姜 倩.物理化学学报,2011,27,2773.]doi:10.3866/PKU.WHXB20112773
(14)Shu,J.F.;Chen,X.J.;Chou,L.M.;Yang,W.G.;Hu,J.Z.; Hemley,R.J.;Mao,H.K.Geoscience Frontiers 2011,2,93. doi:10.1016/j.gsf.2010.12.001
(15)Lang,X.M.;Fan,S.S.;Wang,Y.L.J.Nat.Gas Chem.2010, 19,203.doi:10.1016/S1003-9953(09)60079-7
(16)Song,Y.C.;Yang,M.J.;Chen,Y.J.;Li,Q.P.J.Nat.Gas Chem. 2010,19,241.doi:10.1016/S1003-9953(09)60065-7
(17)Mohammadi,A.H.;Chapoy,A.;Richon,D.;Tohidi,B.Ind. Eng.Chem.Res.2004,43,7148.doi:10.1021/ie049843f
(18)Yarrison,M.;Cox,K.R.;Chapman,W.G.Ind.Eng.Chem.Res. 2006,45,6770.doi:10.1021/ie0513752
(19) Zhu,R.J.;Zhou,J.G.;Liu,S.C.;Ji,J.;Tian,Y.L.Fluid Phase Equilibria 2010,291,1.doi:10.1016/j.fluid.2009.12.011
(20) Li,H.L.;Zhu,R.J.;Xu,W.;Li,Y.F.;Su,Y.J.;Tian,Y.L. J.Chem.Eng.Data 2011,56,1148.doi:10.1021/je101086r
(21) Zhou,J.G.;Zhu,R.J.;Xu,H.F.;Tian,Y.L.J.Chem. Thermodynamics 2010,42,1429.doi:10.1016/j.jct.2010.06.011
(22) Zhou,J.G.;Zhu,R.J.;Xu,H.F.;Tian,Y.L.J.Chem.Eng. Data 2010,55,5569.doi:10.1021/je100353j
(23)Tabasinejad,F.;Moore,R.G.;Mehta,A.S.;Van Fraassen,K. C.;BarzinKees,Y.Ind.Eng.Chem.Res.2011,50,4029.doi: 10.1021/ie101218k
(24) Brunner,E.J.Chem.Thermodyn.1990,22,335.doi:10.1016/ 0021-9614(90)90120-F
(25) http://www3.geosc.psu.edu/Courses/Geosc202/MethaneFugacity. htm.
(26) Prausnitz,J.;Lichtenthaler,R.;Azevedo,E.Molecular Thermodynamics of Fluid-Phase equilibria,3rd ed.;Prentice Hall PTR:Upper Saddle River,N.J.,1999;pp 583-596.
猜你喜欢
北京航空航天大学学报(2022年8期)2022-08-31
天津大学学报(社会科学版)(2022年1期)2022-02-16
泰山学院学报(2019年6期)2020-01-14
物理化学学报(2018年6期)2018-03-08
快乐作文·低年级(2017年10期)2017-11-06
物理化学学报(2015年5期)2015-02-28
天津商务职业学院学报(2015年2期)2015-02-28
天津商务职业学院学报(2015年1期)2015-02-28
天津大学学报(社会科学版)(2014年6期)2014-02-28
物理化学学报(2013年1期)2013-07-25