
Transcriptome-based insights into the calcium transport mechanism of chick chorioallantoic membrane
2022-11-28 13:19QunHuangRanYangQiaWangHuiTengHongoSongFangGengPengLuo
食品科学与人类健康(英文) 2022年2期
Qun Huang, Ran Yang, Qia Wang, Hui Teng, Hongo Song, Fang Geng*, Peng Luo*
a School of Public Health, The Key Laboratory of Environmental Pollution Monitoring and Disease Control, Ministry of Education,Guizhou Medical University, Guiyang 550025, China
b College of Food Science, Fujian Agriculture and Forestry University, Fuzhou 350002, China
c Meat Processing Key Laboratory of Sichuan Province, School of Food and Biological Engineering, Chengdu University, Chengdu, Sichuan 610106, China
Keywords:
Incubation
Chorioallantoic membrane
Transcriptome
Calcium transport
A B S T R A C T
Chorioallantoic membrane (CAM) is responsible for respiratory gas exchange, eggshell calcium transport,embryonic acid-base equilibrium, allantoic ion, and water reabsorption during avian embryonic development.To further understand the timing of CAM gene expression during chick embryonic development, especially the calcium absorption mechanism, transcriptome quantitative comparative analysis was conducted on chick CAM during the embryonic period (E) of 9, 13, 17, and 20 days. A total of 6 378 differentially expressed genes (DEGs) were identified. Functional enrichment analysis of DEGs showed that CAM DEGs were mainly involved in biological processes such as “ion transport regulation”, “immune response” and “cell cycle”.Time series analysis of the differential genes showed that the functional cells of CAM began to proliferate and differentiate at E9 and the calcium content of egg embryo increased significantly at E13. Simultaneously,the observation of the ultrastructure of the eggshell showed that the interstice of the fiber layer was enlarged at E13, and the mastoid layer was partly exposed. Therefore, it is preliminarily inferred that CAM calcium transport starts at E13, and genes such as TRPV6, S100A10, and RANKL cooperate to regulate calcium release and transport.
1. Introduction
Embryo eggs are separated from the mother, and therefore the essential nutrients for embryonic incubation can only be obtained from the shell and contents of the eggs. Nutrients such as carbohydrates,fatty acids, calcium, and phosphorus play an essential role in embryo incubation. These nutrients are transferred to the developing embryo through the chorioallantoic membrane (CAM) and yolk sac (YS) [1].
The YS is formed from the first week of embryonic development and does not entirely cover the yolk until E11 [2]. Nutrients are absorbed from yolk contents into YS epithelial cells by endocytosis and transporters [3,4]. CAM begins to form on E5 to E6 of incubation [5]and surrounds the contents of the egg by E11 and E12 [6]. CAM is a very simple cellular membrane consisting of three layers,including ectodermal epithelium adjacent to the eggshell membrane,mesodermal epithelium rich in vascular and stromal components endodermal epithelium of allantoic cavity [7]. CAM is a site for respiratory gas exchange, eggshell calcium transport, embryonic acid-base balance, allantoic ions, and water reabsorption during incubation [8,9]. YS and CAM have been studied to understand better the transport and absorption of nutrients in avian embryonic eggs [10-13]. Time-transcriptome analysis of the YS demonstrated that YS supported or replaced the functions of intestinal, liver, and bone marrow organs during the last week of chicken embryonic development [14]. Due to rich vascular system of CAM and the lack of complete immunity in chick embryos, most studies on CAM in recent years have focused on medical-related angiogenesis and tumor research [15,16], while there has been no systematic study on calcium transport mechanism of CAM.
The absorption and transport of calcium play important roles during chick embryonic development. Functional studies of CAM have shown that special cells on CAM secrete acid that dissolves calcium carbonate in the eggshell, absorb calcium ions, and transport 80% of calcium to develop chicken bones [17]. At present, there is no definitive data to elucidate the calcium transport pathway in CAM, and most of the mechanisms are still in the stage of practical speculation. Among them, the endocytosis mechanism proposed by Terepka et al. [10]is the most recognized. This mechanism suggests that CAM transports calcium ions, and the apical surface of CC cells in the chorionic membrane endocytosis and absorbs dissolved eggshell calcium, which is then transferred to the basolateral surface by vesicle-mediated transfer. However, there is no precise data to determine the mechanism of calcium transport.
Therefore, 4 key stages (E9, E13, E17, and E20) of chick embryonic development were selected for transcriptome analysis of CAM tissues. Meanwhile, the ultrastructure of the eggshell, the change of pH value of the CAM, and changes in the calcium content of embryonic eggs were combined. This study will give an insight into the mechanism of calcium absorption and transport by CAM and provide new views on the efficient absorption of calcium.
2. Materials and methods
2.1 Materials and reagents
Fresh fertilized chicken eggs (126, about 72 weeks old, cage,standard diets) were collected within 48 h from Yukou Poultry poultry farming (Jinzhou, Hubei, China). The collected eggs were incubated under standard conditions (37.5 °C, 60% relative humidity,with automatic egg turning) [18]. From the beginning to the end of incubation, the contents of the eggs were collected every day (no later than 30 min after hatch), mixed by the homogenizer, dried at 50 °C,and stored. Six eggs were selected at each of the following days: E9,E13, E17, and E20. Embryos were killed by cervical dislocation,and then the dead embryos were dried at 50 °C for later use. E0,E13, and the eggshell that come out of the shell were collected and air-dried for later use. The CAM of E9, E13, E17, and E20 were separated from the inner membrane of eggshell, and the surface stains were quickly cleaned with a pre-cooled PBS buffer solution. After the surface liquid was sucked dry, it was collected into the enzymefree cryopreserved tube, which was quick-frozen in liquid nitrogen and stored at –80 °C for later use. The experiment was approved by the Ethics Committee for Animal Experimentation, College of Food Science, Fujian Agriculture and Forestry University. Unfertilized eggs were incubated under the same conditions. Six eggs were be selected every two days, dried at 50 °C, and stored for later use.
2.2 The experimental method
2.2.1 RNA extraction
The CAM samples were taken from –80 °C. Total RNA was extracted from CAM samples (12 samples distributed over 4 developmental stages), and genomic DNA was removed using DNase I (TaKara). The concentration and purity of the RNA were detected by Nanodrop2000, the integrity of the RNA was detected by agar-gel electrophoresis, and the RIN value was determined by Agilent2100. Only high-quality RNA sample (OD260nm/280nm=1.8-2.2,OD260nm/230nm≥ 2.0, RIN ≥ 6.5, 28S:18S ≥ 1.0, > 2 µg) was used to construct the sequencing library [19].
2.2.2 Library establishment and sequencing
RNA-seq transcriptome library was prepared following TruSeqTM RNA sample preparation Kit from Illumina (San Diego, CA) using 1µg of total RNA. Shortly, messenger RNA was isolated according to the polyA selection method by oligo(dT) beads and then fragmented by fragmentation buffer. Secondly, double-stranded cDNA was synthesized using a SuperScript double-stranded cDNA synthesis kit(Invitrogen, CA) with random hexamer primers (Illumina). According to Illumina’s library construction protocol, the synthesized cDNA was then subjected to end-repair, phosphorylation, and ‘A’ base addition.Libraries were selected for cDNA target fragments of 200–300 bp on 2% Low Range Ultra Agarose, followed by PCR amplified using Phusion DNA polymerase (NEB) for 15 PCR cycles. After quantified by TBS380, paired-end RNA-seq sequencing library was sequenced with the Illumina HiSeq xten/NovaSeq 6000 sequencer (2 × 150 bp read length).
2.2.3 Sequence alignment and quality assessment
SeqPrep (https://github.com/jstjohn/SeqPrep) and Sickle (https://github.com/najoshi/sickle) were used statistics and quality control of the original sequencing data, which can re flect the quality of library construction and sequencing directly from the macroscopic view.Then, TopHat (http://tophat.cbcb.umd.edu/, version 2.0.0) was used to compare clean reads with reference genome (http://asia.ensembl.org/Gallus_gallus/Info/Index) one by one to get the mapped data (reads)for subsequent analysis [20]. Meanwhile, RSeQC-2.3.6 (http://rseqc.sourceforge.net/) was used to evaluate the quality of this sequencing’s comparison results.
2.2.4 Differential expression and functional enrichment analysis
To identify differentially expressed genes (DEGs) in CAM during different incubation periods, each transcript’s expression level was calculated according to FRKM. RESM (http://deweylab.biostat.wisc.edu/rsem/) was used to calculate the amount of gene expression [21].Software EdgeR (http://www.bioconductor.org/packages/2.12/bioc/html/edgeR.html) was used for differential expression analysis [22].In addition, functions enrichment analysis of GO and KEGG was performed to work out the main GO and KEGG’s functions of DEGs. When the checkedP≤ 0.05, DEGs were considered to have significant enrichment in GO and KEGG. Goatools (https://github.com/tanghaibao/Goatools) and KOBAS (http://kobas.cbi.pku.edu.cn/home.do) were used for GO’s functional enrichment and KEGG’s pathway analysis [23].
2.2.5 Short time-series expression miner (STEM) analysis
The STEM program was used to analyze DEGs and identify timeexpressed profiles. We clustered STEM profiles and set all parameters to default values. GO functional enrichment analysis was performed on profiles with a significant change trend, and the method was the same as section 2.2.4.
2.2.6 Quantitative RT-PCR (qRT-PCR) on gene expressions
In order to identify the reliability of sequencing, 4 different genes related to calcium transfer, and one endogenous reference gene were selected for qRT-PCR verification [25]. Real-time fluorescent quantitative PCR analysis was performed by ABI step one plus quantitative PCR instrument, and the experimental results were analyzed through 2-ΔΔCTmethod [26].
2.2.7 Determination of ultrastructure and physicochemical properties
The microstructure of the eggshell was observed by scanning electron microscopy. After the flat cross-section of the eggshell was exposed, the inner surface of the cross-section of the eggshell was coated with gold for observation under the acceleration voltage of 10 kV [27,28]. The embryonic egg mixture and embryos were ground into powder by a grinding machine and then dried in a 105 °C oven until the weight was fixed. Then 0.3 g sample was put into a digestion tank, and 4 mL concentrated nitric acid was added and put into a microwave digestion device for digestion. Calcium content was determined by atomic absorption spectrophotometer. The pH of CAM during incubation was measured by pH meter. After the egg was broken from the gas chamber, the pH meter probe was placed on the CAM surface from the broken shell for determination. The experiments were repeated three times. GraphPad Prism 8.00 software was used to analyze the data.
3. Results
3.1 RNA sequencing
The original image data files obtained from 12 qualified RNA samples were converted to the raw reads by base recognition through high-throughput sequencing. The number of raw reads in E9, E13, E17,and E20 was 58 736 194, 51 331 344, 53 135 073, and 52 518 782,respectively. Quality control was performed for raw reads, the quality of raw reads was checked, and contamination was eliminated. Highquality clean data obtained was used to ensure the accuracy of subsequent analysis results. The number of clean data in E9, E13, E17,and E20 was 58 265 567, 50 900 371, 52 697 360, and 5 210 412.The percentage of clean reads number in the total reads number was higher than 99% , indicating that the sequencing quality was high and met the subsequent assembly requirements. Clean reads obtained from sequencing were compared with the reference genome of Gallus.The clean reads ratios of E9, E13, E17, and E20 with only alignment sites on the reference sequences were 90.03% , 90.22% , 90.61% , and 91.09% , respectively, It indicated the high expression levels of genes in each group.
In this study, 21 900 expressed genes were detected in the 12 samples, among which 19 781 were known genes, and 2 119 were predicted new genes. Venn analyzed all identified expressed genes according to their expression levels. There were 11 825 (83.6% ) genes expressed in the 4 incubation periods, and 404 (2.86% ), 131 (0.93% ),127 (0.90% ) and 279 (1.97% ) genes were specifically expressed in E9, E13, E17 and E20, respectively (Fig. 1).
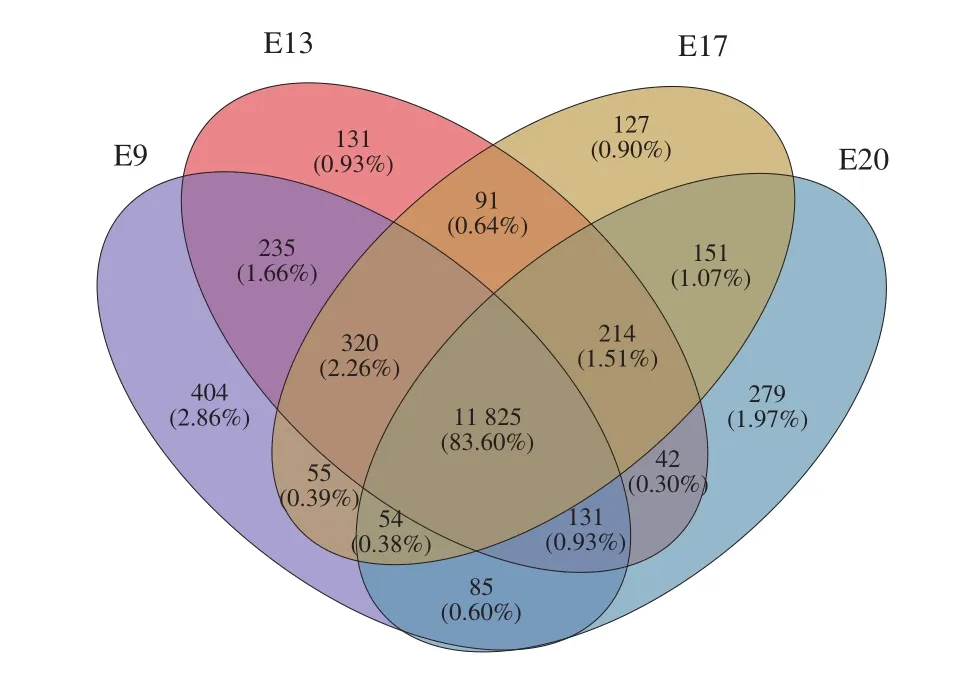
Fig. 1 Co-expressed and uniquely expressed genes in CAM during the 4 incubation periods.
3.2 Screening of DEGs
DESeq2 software was used to analyze the DEGs of chick CAM at different incubation stages. Then,P-adjust < 0.05, |log2FC| ≥ 1 was used as a screening criterion to determine whether there was a significant difference in gene expression. CAM screened 6 378 DEGs in 4 different growth stages of embryonic development (Fig. 2),among which 404, 131, 127, and 279 genes were specifically expressed in E9, E13, E17, and E20, respectively. The distribution of DEGs at different developmental stages performed differences.According to the result of the comparison group of adjacent stages,there were 1 989 DEGs from E9 to E13, among which 817 genes were up-regulated, and 1 172 genes were down-regulated. From E13 to E17, there were 1 453 DEGs, among which 695 genes were upregulated, and 758 genes were down-regulated. From E17 to E20,there were 1 838 DEGs, among which 1 030 genes were up-regulated,and 808 genes were down-regulated.
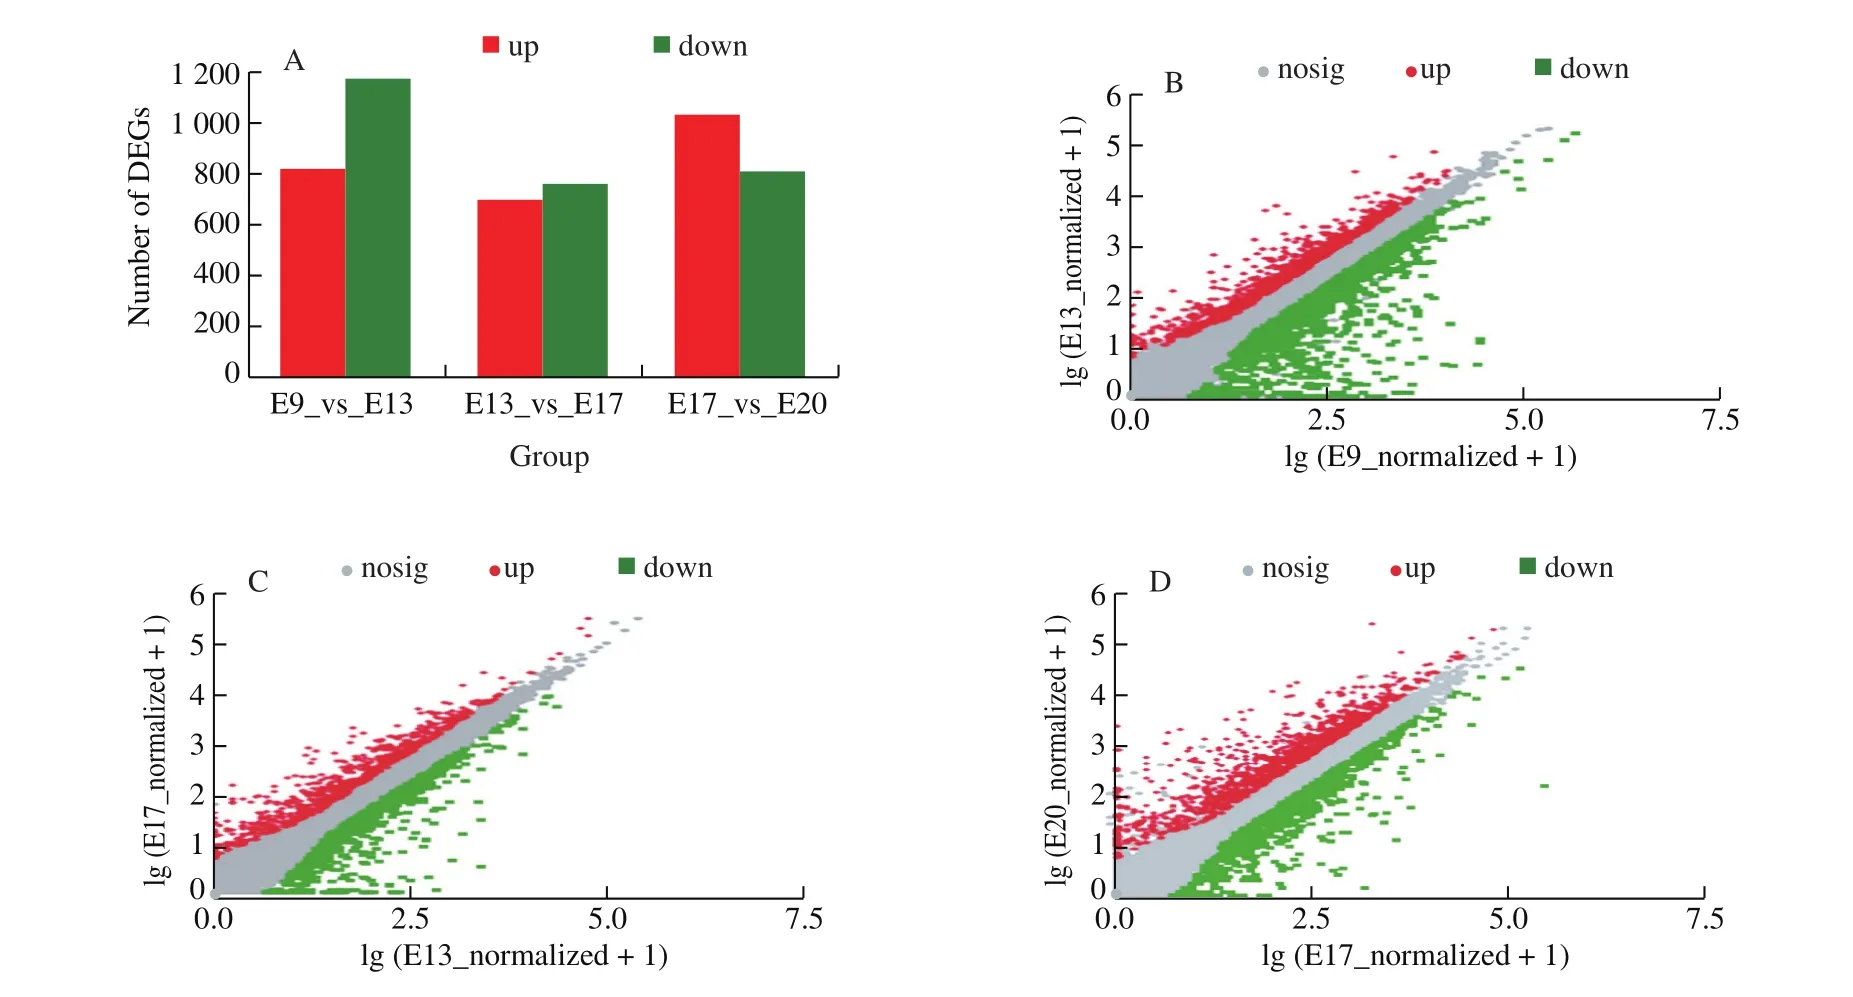
Fig. 2 The DEGs in 3 comparison groups of adjacent stages. (A) The number of DEGs in the 3 groups. The DEGs scatter plot of (B) E9 vs E13, (C) E13 vs E17,and (D) E17 vs E20.
3.3 Enrichment analysis of DEGs
GO functional enrichment and analysis were performed on the DEGs selected from the CAM library. Fig. 3 shows the GO term of the top 20 with significant enrichment in the three comparison groups.GO enrichment analysis results showed that the DEGs of CAM at different stages were enriched to different GO terms. Among the top 20 terms enriched from E9 vs E13, 9 of them were enriched in“biological process”, including cell cycle processes, substances, ions,and gas transport processes. In the “cellular component” category, 7 GO terms were enriched, mostly in the extracellular and membranous regions. 4 terms were enriched in the “molecular function” category,including ion transport activity, ion transmembrane transporter activity, and oxygen binding activity. Among the top 20 terms of differential genes enriched from E13 vs E17, 11 of them were enriched in “biological processes”, mainly including mitosis and ion transport regulation. In the “cellular component” category, 9 terms were enriched, mostly in chromosomal and extracellular regions.The top 20 terms of E17 vs E20 differential genes were enriched in“biological process”, mostly related to immune reaction.
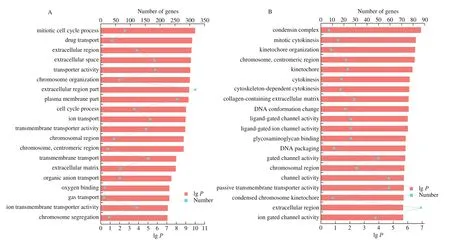
Fig. 3 The top 20 enriched GO terms of DEGs in each comparison of CAM. GO enrichment analysis of (A) E9 vs E13, (B) E13 vs E17, and (C) E17 vs E20.
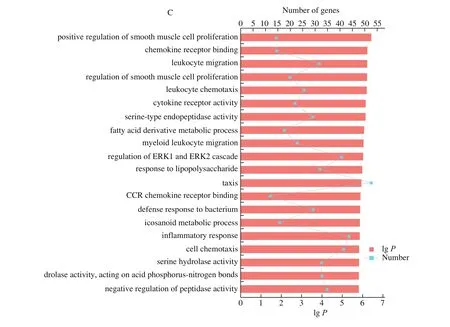
Fig. 3 (Continued)
To further analyze and identify the biological signaling pathways in which CAM DEGs were involved, this study conducted pathway enrichment analysis of the DEGs selected from the CAM library.Simultaneously, pathway enrichment analysis of DEGs in the three CAM comparison groups was also conducted. Enrichment analysis results of the pathway shown in Fig. 4A. The top 10 pathways enriched with CAM overall differential genes were PPAR signaling pathway, autoimmune disease, Cushing syndrome, NOD-like receptor signaling pathway, purine metabolism, primary immunodeficiency,and allograft rejection, signaling pathway, measles. The top 10 significantly enriched pathways of DEGs of E9 vs E13 are shown in Fig. 4B. The significantly enriched pathways of DEGs of E13 vs E17 and E17 vs E20 are shown in Figs. 4C, 4D. The ECM-receptor interaction signaling pathway is significantly enriched in both E13 vs E17 and E17 vs E20.
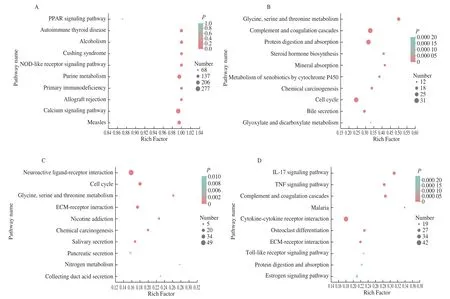
Fig. 4 KEGG functional enrichment analysis on DEGs in CAM. KEGG enrichment analysis of (A) all DEGs, (B) E9 vs E13, (C) E13 vs E17, and (D) E17 vs E20.
3.4 Analysis of time-series expression of genes
We used STEM software to analyze the time-series expression of 6 378 DEGs in CAM at different development stages and obtained 26 different gene expression patterns, as shown in Fig. 5. 13 significantly enriched expression patterns were identified, among which cluster 0 contains profile 21, 22, 24, and 25. And there were 555, 532, 415,and 492 DEGs in the 4 profiles, respectively. Profile 21 showed an increase in gene expression from E9 to E13, but no significant change after E13; Pro file 22 was up-regulated from E9 to E13, E13 to E17 showed no significant change, and E20 was up-regulated again;Pro file 24 expression of DEGs was up-regulated from E9 to E17, and there was no significant change after E17. Cluster 1 included profiles 0, 3, 9, and 12, containing 385, 316, 419, and 500 DEGs, respectively.Among them, the expression of each gene in profile 0 gradually decreased over time. Pro file 9 showed no significant change in gene expression from E9 to E13, while E13 to E20 gradually decreased.The quantity of gene expression in profile 3 decreased from E9 to E13, showed no significant change from E13 to E17 and decreased again from E17 to E20. Profile 12 showed no significant change in the expression of genes from E9 to E17, while E17 to E20 gradually decreased. Profile 13 and 16 belong to cluster 2, with 500 and 307 DEGs, respectively. The quantity of DEG expression in profile 13 showed no significant change from E9 to E17 but increased from E17 to E20. Pro file 16 showed no significant change from E9 to E13 but increased from E13 to E20. Profile 17, which belongs to cluster 4,is composed of 359 DEGs, and the quantity of each gene expression increased from E9 to E13 while decreased after E13. In addition,profile 23 belongs to cluster 5, with 339 DEGs, and the quantity of each gene expression increased gradually from E9 to E17 and then decreased after E17.
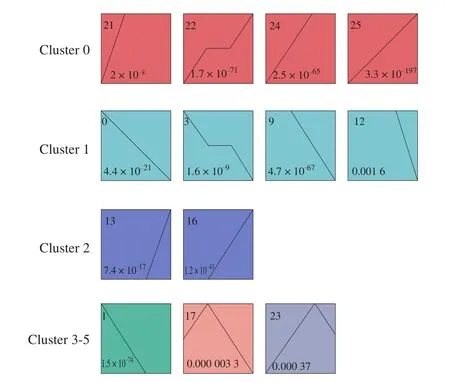
Fig. 5 STEM clustering on DEGs in CAM. (Each rectangle represents a profile, and the number in the upper left corner of the rectangle is the number of the profile. The broken line is the trend of the expression over time.)
From a biological perspective, genes with similar expression patterns may have common characteristics, such as being regulated by specific genes at the same time, having similar biological functions,or having common cellular origins, etc. GO enrichment analysis was carried out for 6 clusters to explore the biological function of the CAM gene with a similar expression pattern (Table S1). In cluster 0,several GO terms related to cell migration, proliferation, and differentiation were enriched, including positive regulation of cellmatrix adhesion, positive regulation of endothelial cell proliferation,endothelial cell migration, epithelial cell migration. This result indicated that most of the genes in cluster 0 were related to cell migration, proliferation, and differentiation. However, in cluster 1, the enriched GO terms were related to DNA replication, gas transport, etc.The enriched terms were associated with immune response, protein phosphorylation, and regulation of protein kinase activity in cluster 2.In cluster 3, the enriched GO terms were related to mitosis and cell cycle. The enriched GO terms were related to bone growth and mammary gland development in cluster 5.
3.5 qRT-PCR validation of DEGs
To verify the reliability of transcriptional sequencing data, we selected 4 genes related to calcium transfer:S100A10,BMP4,CA2,andVEGFC, and the endogenous reference genes wereRPL32. The expression of these 4 genes was analyzed by qPCR (Fig. 6). The expression trends of the 4 genes were consistent with the expression trends obtained by RNA-seq, which means that the RNA-seq data reliably re flected the changes in gene expression.
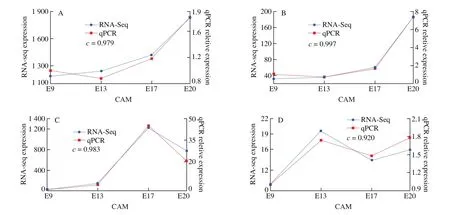
Fig. 6 qRT-PCR analysis of the expressions of the genes (A) S100A10, (B) BMP4, (C) CA2, and (D) VEGFC. The c-value shows Pearson’s correlation between the two methods, indicating a strong correlation.
3.6 Microstructure changes of eggshell during hatching
Scanning electron microscope observation of the eggshell(Figs. 7A-C) showed that the cross-section flatness became worse.The mastoid layer gradually loosened and disordered with the increase of hatching days. The result is the opposite to fibrous layer of eggshell formation [29]. With the development of incubation, the compactness and order degree of the eggshell fiber matrix gradually decreased(Figs. 7D-F), and the void area grew larger until it disappeared. With the increase of the fibrous layer’s space, the mastoid layer gradually exposed, and the nipple disappeared, leaving absorption pits.
3.7 Determination of physical and chemical properties of embryonic egg
Meanwhile, we noticed that the pH of CAM decreased from 7.5 to 6.5 from E9 until the eggs hatched from the determination of CAM pH during incubation (Fig. S1), which may be related to the secretion of carbonic anhydrase and its catalytic production of carbonic acid. As shown in Fig. S2, the calcium content of embryo increased gradually with the development of incubation. The change of calcium content in embryo was divided into three stages. The content of calcium in the embryo before E10 was low, about 0.49 mg/g. The content of calcium increased to 1.04 mg/g at E11-E15. After E12, the calcium content of the embryo was about 5 times that of E10 and increased continuously,and the calcium content of the embryo was 2.86 mg/g before hatching.The variation of calcium content in the mixture of embryo and egg had the same trend that increased significantly at E13 and reached a peak before shell exfoliation. This result indicated that eggshells,a source of calcium for the embryo during incubation, continuously and regularly provide the embryo with calcium for growth and development. Besides, the phenomenon of calcium content in the mixture of egg surging before hatching was consistent with the literature report [30]. This indicated that calcium in the eggshell was rapidly transferred to the interior of embryo through CAM before the embryo out of the eggshell, providing sufficient calcium for the embryonic development after the embryo hatch.
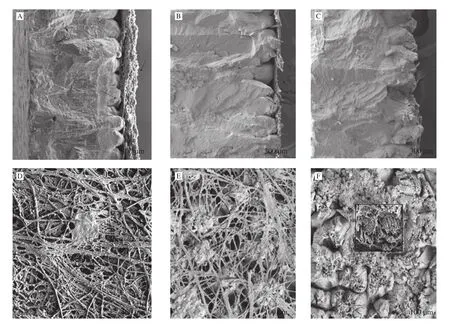
Fig. 7 SEM views of chicken eggshell. (A) Cross-section and (D) inner surface before incubation. (B) Cross-section and (E) inner surface on the 13th day of incubation; (C) Cross-section and (F) inner surface on the 21th day of incubation.
4. Discussions
4.1 Time sequence of activation of calcium-absorptionrelated functions in CAM during incubation
CAM is a kind of outer membrane of embryo, which is the respiration exchange surface of oxygen and carbon dioxide of embryo. The allantoic sac is the reservoir in which the embryo produces its excrement. The allantoic cavity is where waste fluid is discharged and is responsible for transporting sodium and chloride ions [31,32]. With the development of the embryo, the demand for oxygen and the production of metabolites increased. Therefore,compared with E9, the genes responsible for transporting substances,ions, and gases in E13 were significantly up-regulated. The allantoic epithelium absorbs electrolytes and water while maintaining an effective defense against toxic substances in the lumen. Moreover,CAM belongs to congenital immunodeficiency tissue during the early stages of embryonic development. With the development of embryos,blood vessels gradually develop and improve. The expression of immune-related genes in blood vessels increases and the immune function is gradually improved to ensure the healthy development of chicken embryo. Angiogenesis is related to various cytokines,among which the strongest pro-angiogenesis cytokine is the vascular epithelial growth factor (VEGF) family member [33]. The gene function enrichment results of cluster 0 showed that theVEGFCgene was enriched into several GO terms related to cell proliferation and regulation of vasculature development, andVEGFCgene expression increased gradually during CAM angiogenesis. Interleukin is a kind of cytokine that is produced by many cells and used in many kinds of cells. It plays a vital role in a series of processes, such as the maturation, activation, proliferation, and immune regulation of immune cells [34]. The expression of various interleukin-related genes was significantly up-regulated in the late incubation period,which means that interleukin-related genes play an essential immune role in the late incubation period.
KEGG is a powerful tool for metabolic analysis and metabolic regulatory network research in biological organisms, finding pathways with significant enrichment in DEGs [35]. Mineral absorption was a significantly enriched pathway of DEGs of E9 vs E13, which mainly involves the absorption and transport of magnesium ion, calcium ion, and sodium ion. Both TRPM6, responsible for magnesium ion transport, and TRPV6, responsible for calcium ion transport, are members of the transient receptor potential channel family. TRPM6 is a magnesium ion absorption channel at the tip of epithelial cells [36].TRPM6 protein is considered a regulator of magnesium homeostasis in the body [37]. Compared with E9, the expression of the TRPM6 gene in E13 was significantly up-regulated, indicating that the transportation of magnesium ions by CAM is initiated at E13. TRPV6 is involved in calcium transport in epithelial cells and is considered an essential role in calcium absorption in the kidney and intestine [38].Similar to the calcium transfer of CAM, calcium in the human placenta is transferred to the embryo through trophoblast cells, and TRPV5 and TRPV6 can guarantee basal calcium uptake of syncytial trophoblast cells [39]. In this study,TRPV6gene expression was significantly up-regulated in E13, suggesting thatTRPV6may play an important role in CAM calcium transport. Also, S100A10 is the first auxiliary of calcium channels in epithelial cells [40]. In this study,theS100A10gene was highly expressed in E9 and E13, indicating that the mechanism of calcium transport to activated at 9 and 13 days in epithelial cells during incubation. ECM-receptor interaction signaling pathway was significantly enriched in both E13 vs E17 and E17 vs E20. It was reported that ECM-receptor interaction in bone tissue of low-calcium diet chick was significantly up-regulated compared with the high-calcium group, indicating that ECM-receptor interaction is involved in the bone reconstruction of low-calcium diet chick [41]. Furthermore, bone remodeling maintains the stability of bone metabolism, including bone formation and bone resorption mediated by osteoblasts and osteoclasts, respectively [42]. By the time the eggs were hatched at Day 20, they are fully developed and ready to hatch. In this study, the expression ofRANKLandOPG,critical genes of CAM involved in osteoclast differentiation during embryonic chick incubation, was significantly up-regulated at E20.Mature differentiated osteoclasts degrade the bone matrix through secreting acid, lysosomal enzyme, and protease, which may signal the embryo to CAM and inhibit eggshell calcium transport through CAM osteoclast differentiation [43]. In general, the KEGG enrichment pathway of DEGs showed thatTRPV6andS100A10play a vital role in the initiation stage of calcium transfer. Simultaneously,RANKLandOPGregulated calcium transfer in the middle and later stages of incubation. Therefore, calcium transport in CAM during incubation was further studied.
4.2 Multiple CAM genes cooperate to regulate the release and transport of calcium from eggshell during incubation
The chorionic layer of CAM is a single layer of the flattened cell on E7, but significant cell proliferation in the chorionic layer has occurred at E10-E11. In E12, the VC cells of CAM eventually differentiate, while in E14, CC cells form long cytoplasmic extensions on the chorionic capillary plexus, constituting most of the surface of CAM [8]. Both VC and CC cells of CAM play a significant role in calcium release and transport. It was shown that chorionic epithelium VC cells of CAM secrete carbonic anhydrase at E11 to dissolve the calcium reserve at the bottom of the eggshell and release calcium ions [5].In this study, the expression level of CAII at E13 was twice of E9,and it continues to increase to double of E13 at E17, and it maintains a high expression until the chicks hatch. Consistent with this, the pH of the surface of CAM was also reduced, which consistent with the viewpoint that CAII caused the secretion of hydrogen ions and dissolved minerals and shells [17]. At the same time, we observed the ultrastructure of the eggshell during incubation and found that with the progress of incubation, the mammillary layer of the eggshell appeared the apparent phenomenon of mineral dissolution and organic matrix network exposure. Chien et al. [44]believed that mineral dissolution of eggshell provides a dissolving channel to promote calcium release from eggshell.
Eggshell calcium is released by the regulation of the eggshell matrix eggshell [45]. After release, calcium is transported into the egg through CAM for embryo growth and development. Calcium content determination showed that the calcium content of the embryo increased in the early incubation stage, but the calcium content of egg mixture began to increase slowly at E13. This result indicated the calcium transport mechanism of CAM was activated at E13.However, at present, the mechanism of calcium transport by CAM is still unclear, and CAM ectoderm CC cells are highly recognized for transporting dissolved eggshell calcium through the mechanism of adsorption and endocytosis [10]. Terepka et al. [10]thinks calcium binding protein, Ca2+ATPase, and CAII work together to complete the eggshell calcium absorption. After CAII released the eggshell calcium as calcium specific receptors on the surface of the cells, combined with calcium and then formed vesicles structure, and Ca2+ATPase as calcium pump pumping calcium ions into a vesicle. Consistent with the model of absorption endocytosis, this study not only found the expression of CAII, but also the expression ofATP2A3, a gene encoding Ca2+-ATPase, was identified to be up-regulated from E9 to E20. Therefore, the adsorption endocytosis model of CC cells proposed by Terepka et al. [10]may be a key mechanism for transporting eggshell calcium by CAM. However, different pathways of calcium transfer by CAM may not be ruled out. We analyzed the gene expression of CAM to study the different mechanisms of eggshell calcium transfer to embryos. The result indicated thatTRPV6andS100A10play an important role in regulating calcium transport initiation. In contrast,RANKL,OPG, and other genes may regulate calcium transport stop before the embryo hatch. In addition, chick BMP4 has a typical structure of the BMPs family. That structure lays the foundation for the involvement of BMP4 in cartilage and bone formation, early embryonic development, and the transformation of stem cells into fat cells [46]. In CAM, the expression of theBMP4gene was significantly up-regulated at E17, and the expression was highest at E20. This phenomenon illustrated that BMP4 may regulate embryonic bone development by signaling in CAM. Therefore, CAM may depend on more biological regulation for eggshell calcium transport.
4.3 Application of calcium release and transport mechanism during chicken embryo incubation in the design of human calcium supplements
Calcium is an essential mineral element in the human body and plays an important role in human bone formation and metabolism [47].About 3.5 billion people worldwide are calcium deficient, and calcium deficiency has become a major international problem affecting human health [48]. This study provides important information for the further study and elucidation of the mechanism of calcium release and transport during chicken embryo incubation. Carbonic anhydrase was highly expressed during calcium transport from eggshell,which is consistent with previous findings [17]. Based on this, it is hypothesized that carbonic anhydrase may be a key gene and protein for calcium release, whileTRPV6andS100A10may be involved in calcium transport. In addition, TRPV6 is a key protein for calcium absorption in human small intestinal epithelial cells [39]. Therefore,future in-depth studies will target these two points. After the initial elucidation of the mechanism of calcium release and transport during chicken embryo incubation, a complex delivery system consisting of calcium, calcium release factor, and calcium absorption transport factor can be constructed using food microencapsulation and other technologies. This will provide a new idea to achieve targeted controlled release and efficient absorption of calcium.
5. Conclusion
In this study, a time-transcriptome analysis was performed on CAM during chick egg incubation. A total of 21 900 genes were identified from CAM at 4-time points of E9, E13, E17, E20, among which were 6 378 DEGs. Functional analysis and time-series analysis of DEGs was performed, and the result indicated that CAM DEGs were mainly involved in biological processes such as “ion transport regulation”, “immune response” and “cell cycle”. CAM activates and inhibits calcium transport in eggshell by regulating the expression of different genes at different incubation stages. The results of this study provide a scientific foundation for further exploring the scientific issues related to nutrient transport.
Acknowledgements
This study was financially supported by the Foundation of Guizhou Educational Committee (No. KY[2021]008 and No.KY[2020]014) and the National Natural Science Foundation of China (No. 31871732).
Conflict of Interest
The authors declare no competing financial interests.
Appendix A. Supplementary data
Supplementary data associated with this article can be found in the online version, at http://doi.org/10.1016/j.fshw.2021.11.018.
- 食品科学与人类健康(英文)的其它文章
- Potential application of proteolysis targeting chimera (PROTAC) modification technology in natural products for their targeted protein degradation
- Effects of vegetarian diet-associated nutrients on gut microbiota and intestinal physiology
- Recent progress in preventive effect of collagen peptides on photoaging skin and action mechanism
- Perspectives on diacylglycerol-induced improvement of insulin sensitivity in type 2 diabetes
- Effect of bacteriocin-producing Pediococcus acidilactici strains on the immune system and intestinal flora of normal mice
- A new Lactobacillus gasseri strain HMV18 inhibits the growth of pathogenic bacteria