
Comprehensive evaluation of Actinidia arguta fruit based on the nutrition and taste: 67 germplasm native to Northeast China
2022-11-28 13:19MengtingSongHeranXuGuangXinChangjiangLiuXiaorongSunYinhongZhiBinLiYixiaoShen
食品科学与人类健康(英文) 2022年2期
Mengting Song, Heran Xu, Guang Xin*, Changjiang Liu, Xiaorong Sun,Yinhong Zhi, Bin Li, Yixiao Shen
College of Food Science, Shenyang Agricultural University, Shenyang 110866, China
Keywords:
Actinidia arguta
Electronic tongue analysis
Cluster analysis
Principal component analysis
Comprehensive quality
A B S T R A C T
Actinidia arguta is a berry fruit with high nutritional values. To evaluate the comprehensive quality, t he fruit weight, titratable acid (TAC), s oluble solids (SSC), vitamin C, mineral elements, and taste value of 67 accessions of A. arguta were measured, and sensory attributes including olfactive intensity, juiciness,sweetness, sourness, and astringency were assessed. Cluster analysis was carried out based on mineral elements, and principal component analysis (PCA) was used for comprehensive score ranking. The result demonstrated that fruit weight ranged from 3.5 g to 24.2 g, SSC ranged from 11.94% to 20.56% , TAC ranged from 0.15% to 1.20% , and vitamin C ranged from 3.51 g/kg to 230.76 g/kg (fresh weight) among the tested samples. There were significant differences in sourness, sweetness, bitterness, and umami among the 67 accessions based on electronic tongue analysis, and this result was rapidly and objectively characterized by the sensory assessment. The dendrogram was obtained and clustered the accessions into two major clusters, and five principal components were extracted by PCA. Overall, the information provided by this study identified the 10 best germplasm resources for fresh-eating and processing fruits. It can provide theoretical reference for nutritional efficacy evaluation and food development of A. arguta.
1. Introduction
Actinidia argutabelongs to the family Actinidiaceae. It is variously called kiwiberry, hardy kiwifruit or mini kiwi [1]. It is a perennial vine native to Japan, Korea, northern China, and Russia [2].Although the production scale is relatively small so far, it is the second commercially grown kiwifruit species in the world [3].A. argutahas a superb flavor and tends to be sweeter thanA. deliciosa(green kiwifruit) orA. Chinensis(gold kiwifruit) [4]. Due to its excellent edible character and its nutritional and medicinal value, this fruit is widely consumed worldwide.A. argutais usually eaten fresh,but in China, it is also processed into jam, preserved fruit, fruit wine,juice, fruit vinegar, enzymes, and so on [4].
Extensive studies are being actively carried out to investigate the components and efficacy ofA. arguta[5]. Previously, several studies demonstrated that the fruit contains many functional components including polyphenols, flavonoids, flavanols, tannins, lutein,zeaxanthin, and polysaccharides [6-9]. Mo reover, there are extensive bioactivities of its extracts, including hypoglycemic functions and antioxidative, anticancer, and antiallergic properties [10-12]. Thus,A. argutais a fruit with great commercial importance, and it can be defined as a health and well-being promoter [8].
Although much work has been done on the extraction of nutrients fromA. arguta, most of these studies have only focused on a few commonly grown varieties. Furthermore, although there are extensive accessions ofA. arguta, there is sparse information on their fruit quality, and there is no information about them in regards to electronic tongue findings or mineral elements contents. Latocha et al. [13]compared the external (appearance) and internal ( flavor and texture)characters and consumer acceptability among 9 genotypes; Wojdyło et al. [14]evaluated the physical and chemical properties of the fruits as weight, titratable acid (TAC) and soluble solid (SSC),sugar, organic acid, pectins, and ash content of 7 varieties ofA. arguta; total phenolic content and the astringency of 12 accessions ofA. argutawere determined, and there were large differences found among the cultivars [15]. A more comprehensive study is necessary to reveal the fruit properties of these little-known cultivars.
In this context, the aim of this paper was to assess the physicochemical and sensory characteristics of 67 accessions ofA. argutafruits from northeast China. In addition, principal component analysis (PCA) was used to reduce the 14 variables to 5 to explain the comprehensive quality ofA. arguta. Providing this information can help scientists, such as kiwifruit geneticists, develop varieties with higher nutritional value; it can also help growers and consumers choose the best germplasm resources for fresh-eating and processing to provide better quality fruits and improve health benefits.
2. Materials and methods
2.1 Sample preparation
A. argutafruits were harvested during September 2017 at the Exsitu Conservation Nursery of Northeast Wild Kiwifruit Germplasm of the Agricultural Ministry (Shenyang, China). Their natural habitats were located in the Changbai Mountain Area in northeast China,including Liaoning, Jilin, and Heilongjiang provinces. Detailed information on the samples was presented in Table 1. All of the fruits were picked at commercial maturity. Harvested fruit was immediately transported to the laboratory. Some of the fruits were used for the determination of fruit weight, TAC, SSC, and solid-acid ratio (SAR).The other fruits with their peel were washed with deionized water,dried with absorbent paper, and then frozen and stored at –80 °C for further experiments.
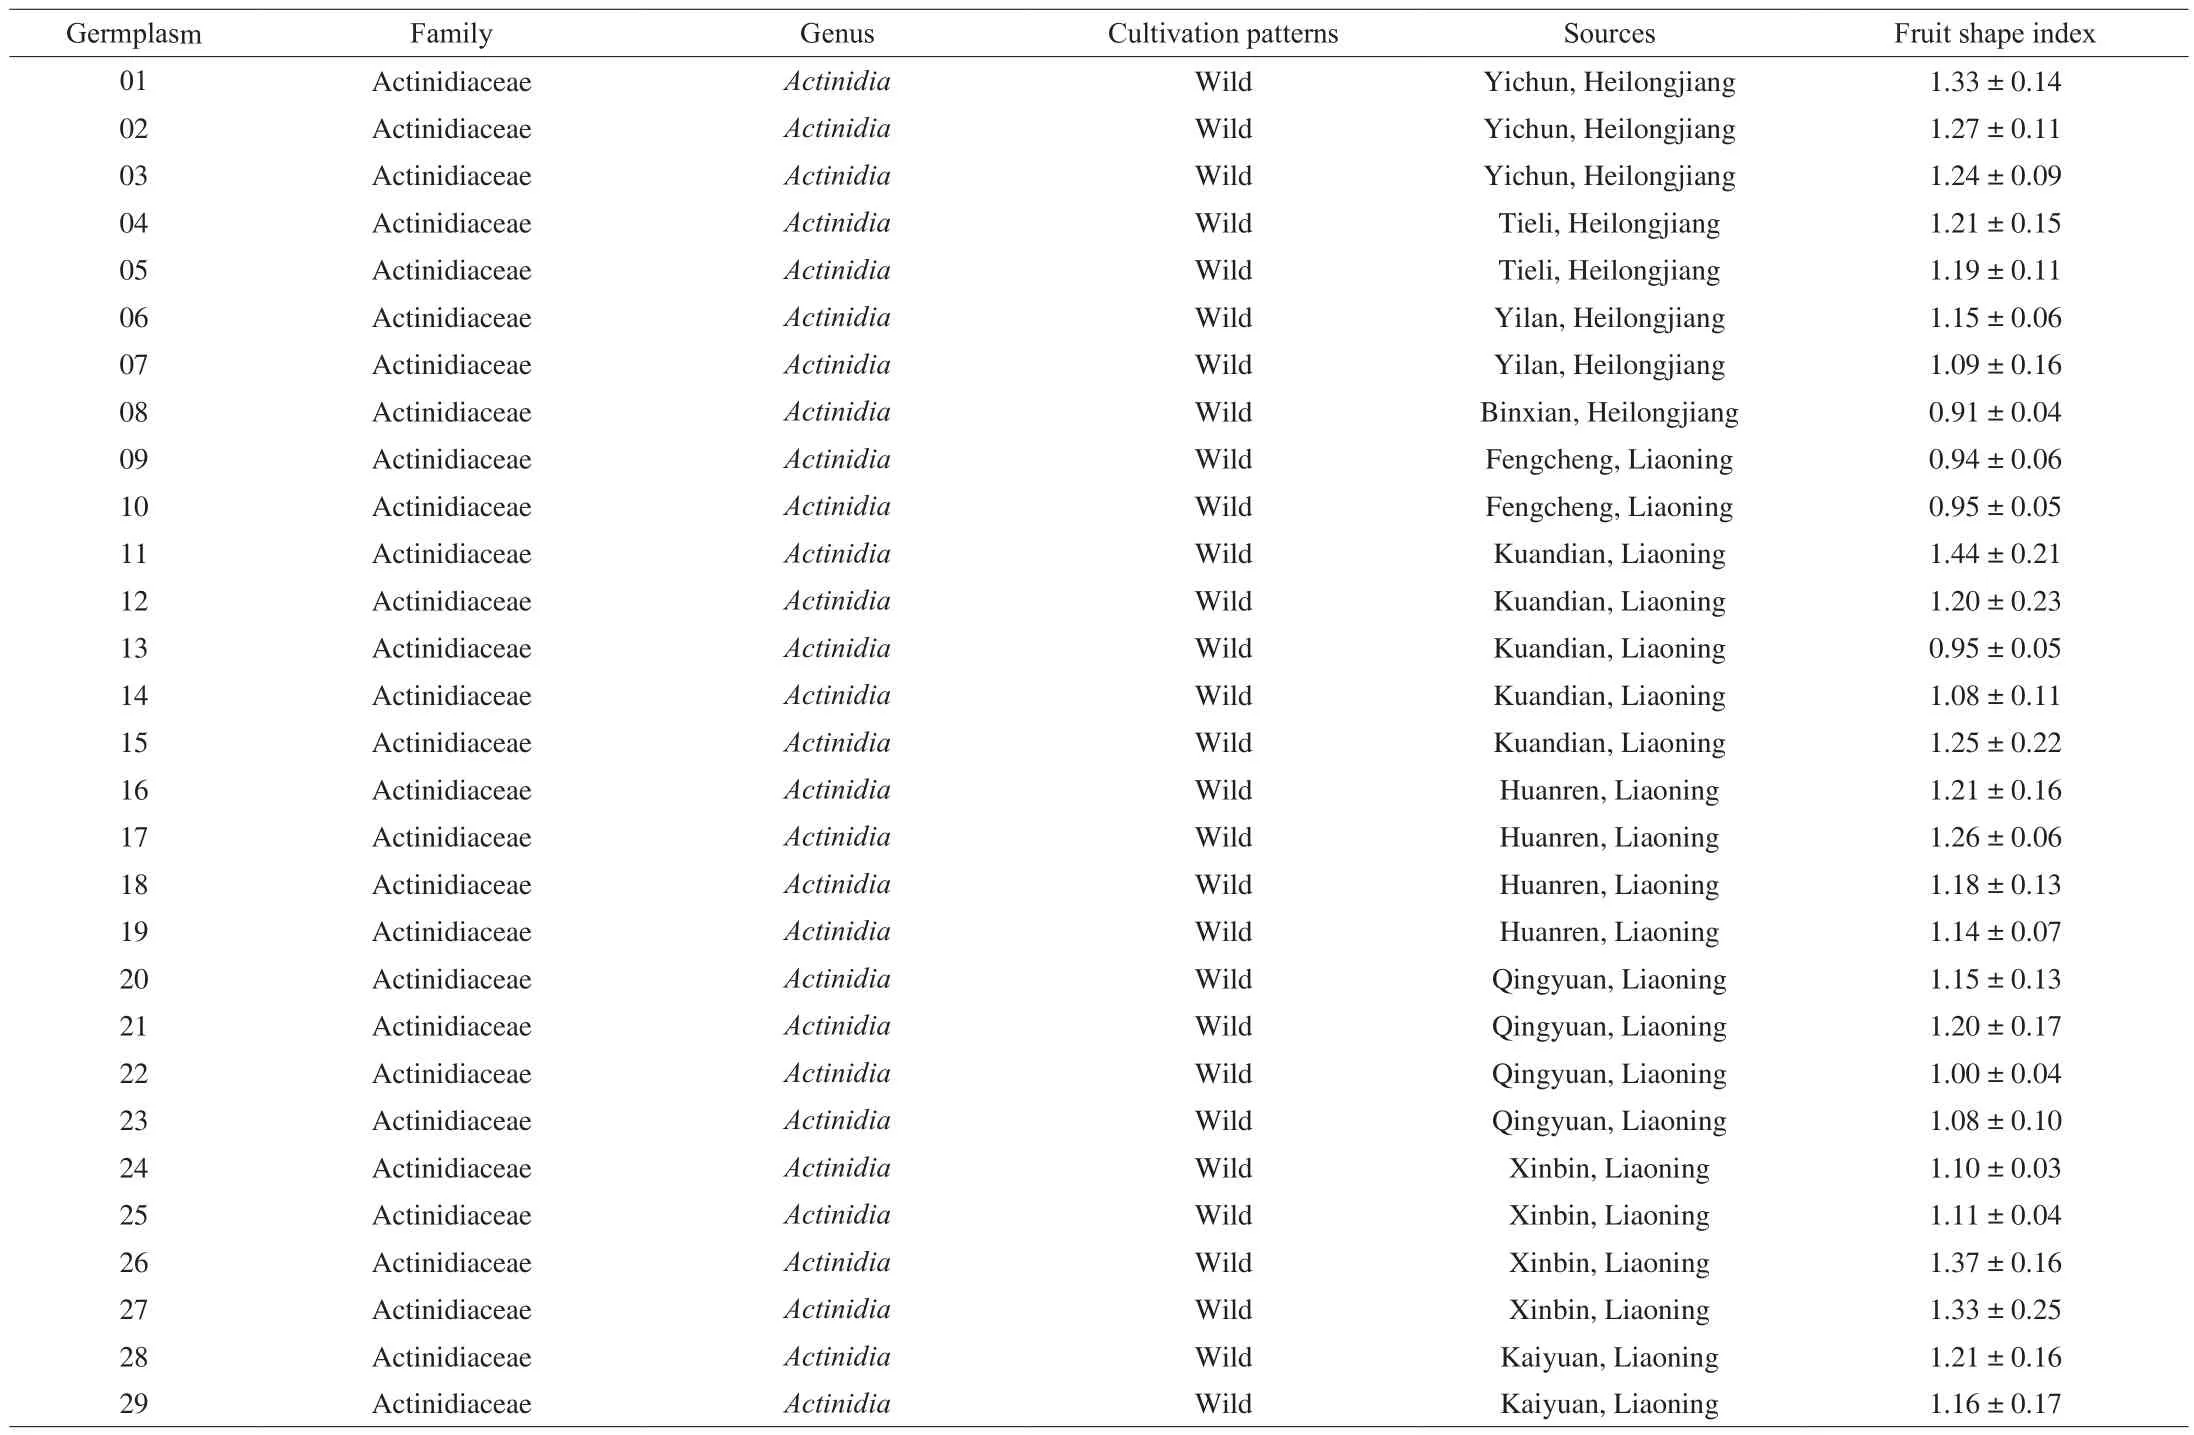
Table 1A. arguta accessions used in this study.
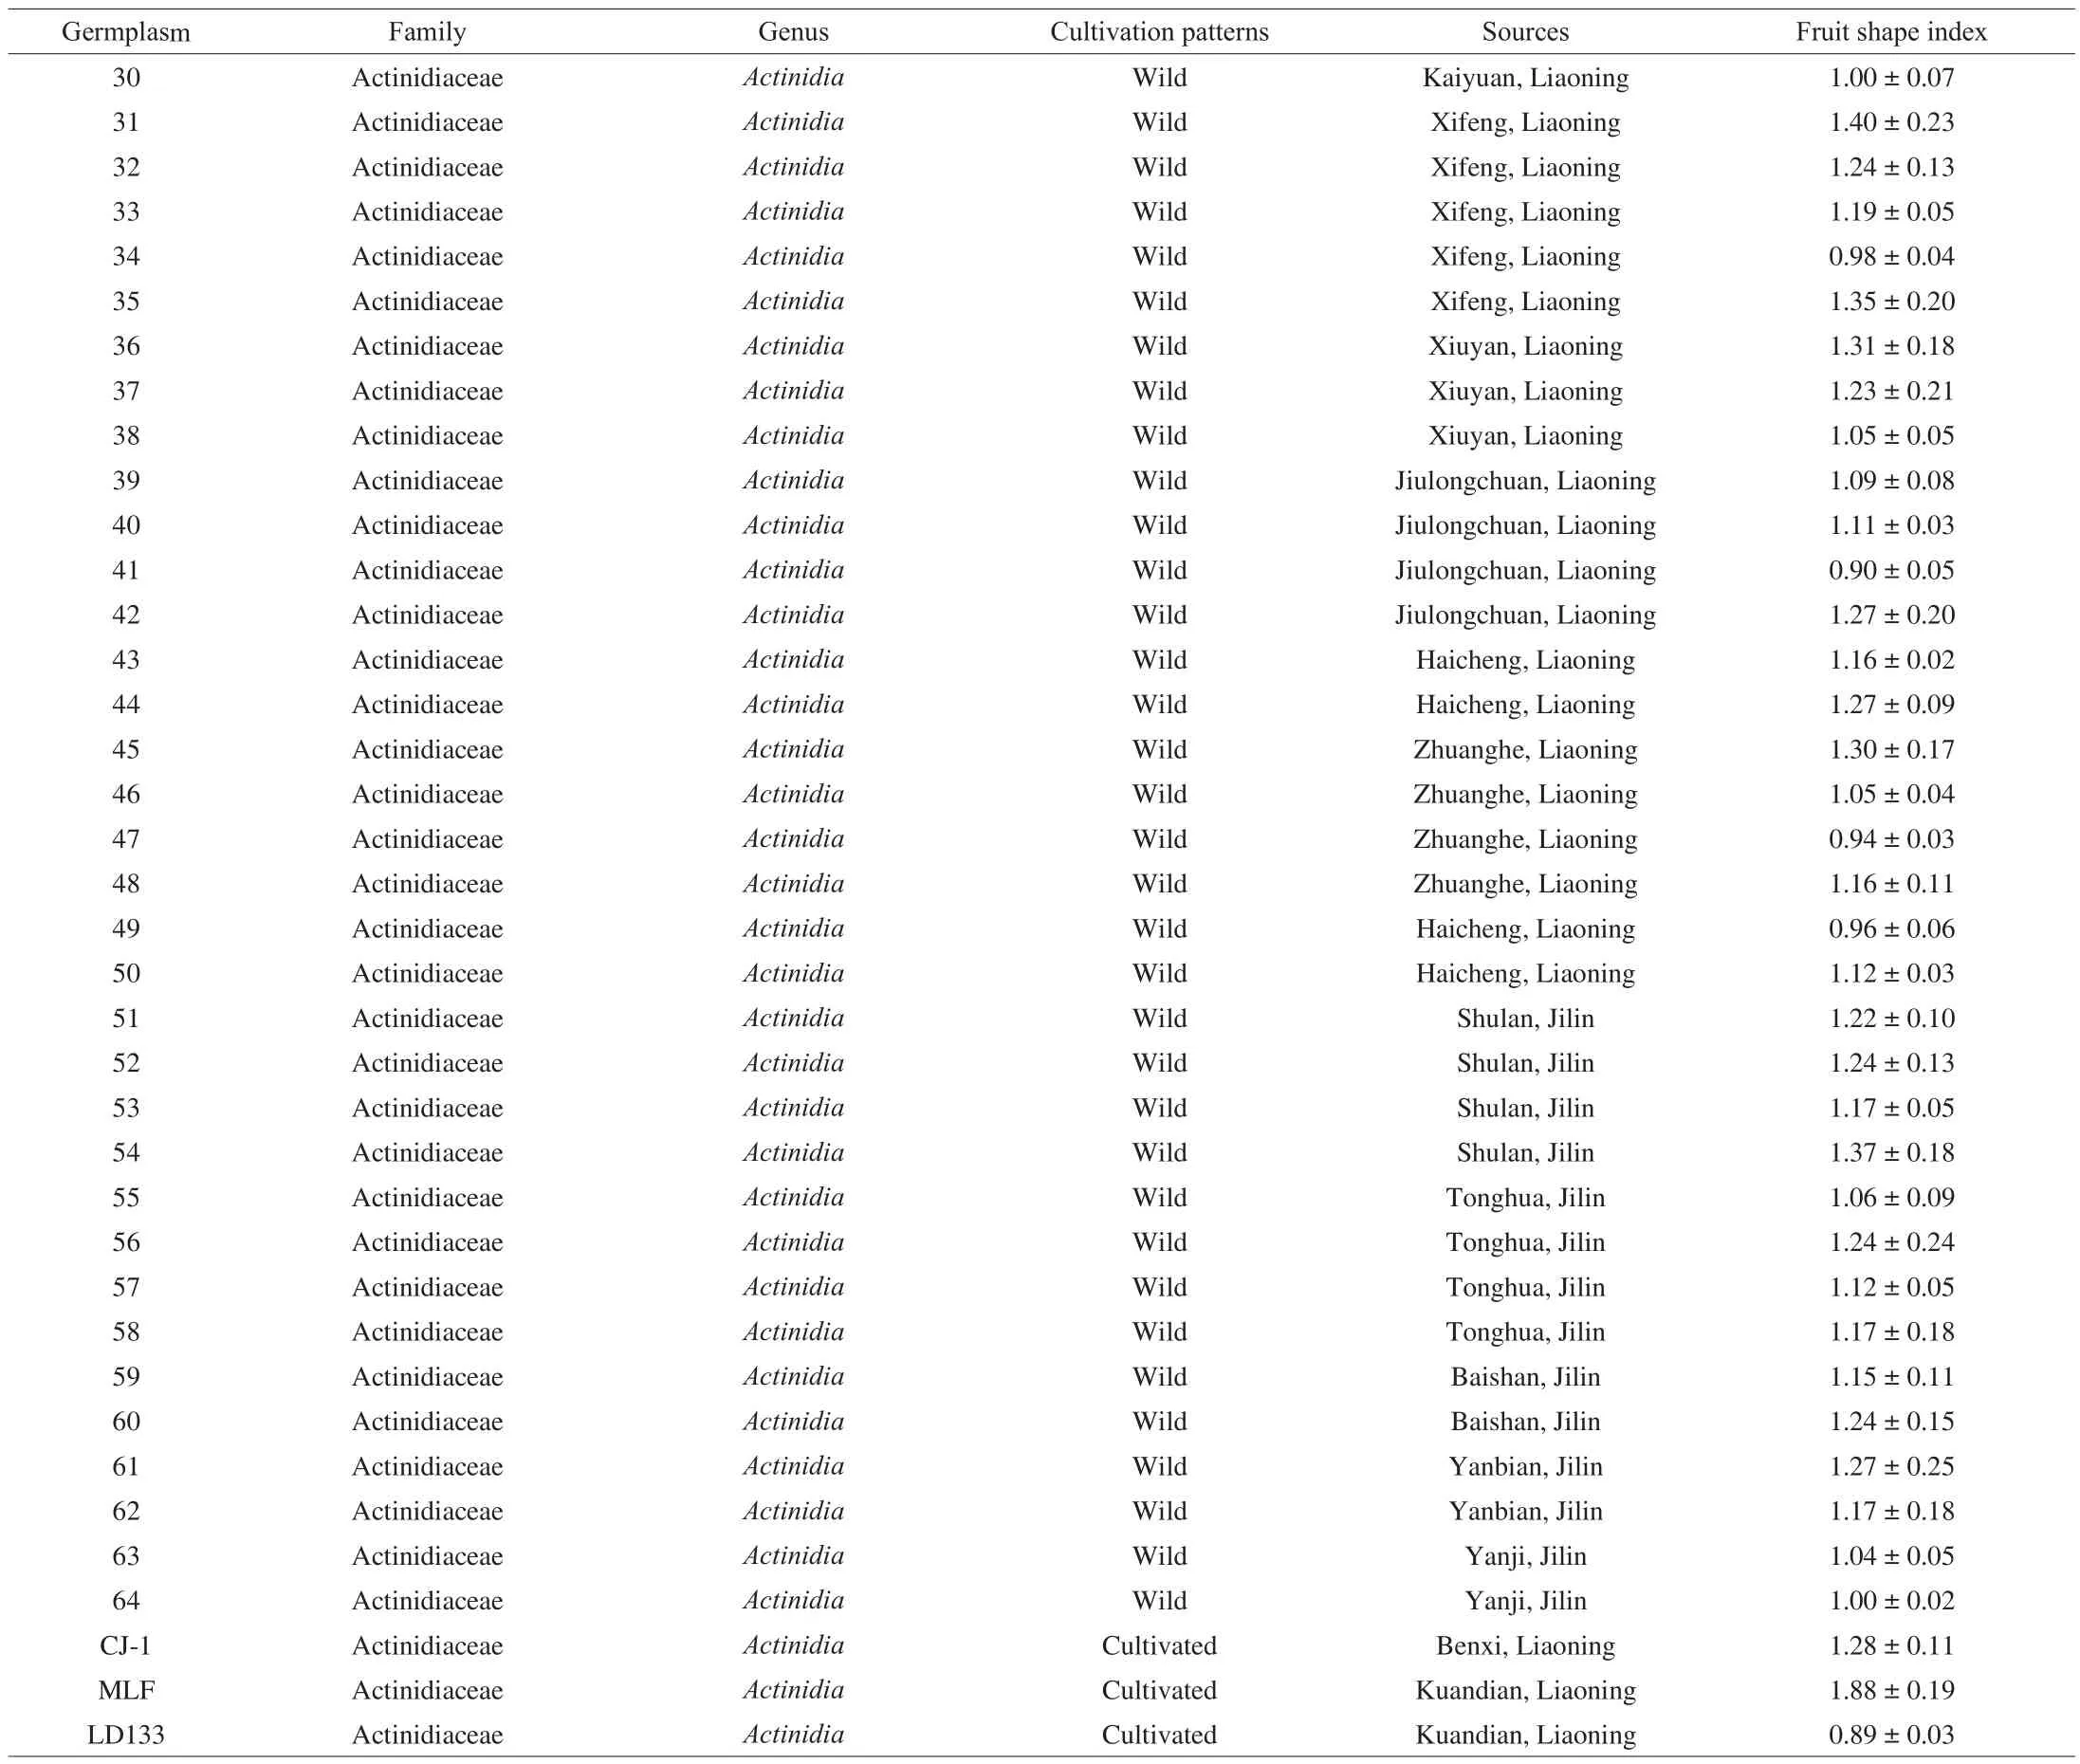
Table 1 (Continued)
2.2 Determination of fruit weight, SSC, TAC, and SAR
The weight of theA. argutafruits (n= 10) was measured by an electronic balance (BSA224S, Beijing Sartoriu Instrument System Co., Ltd., China) [16]. The SSC ofA. argutawas determined by a PAL-1 hand-held sugar meter (ATAGO, Japan) and expressed as the percentage. The TAC method was used as described in the study of Zhu et al. [17], based on the principle of acid and alkali neutralization.The TAC was calculated based on the consumption of sodium hydroxide and the result also was expressed as the percentage [18].The SAR was the ratio of SSC and TAC.
2.3 Determination of vitamin C content
The vitamin C content was determined using a 2,6-dichloro-indophenol titration method.A. argutasample (5.0 g) was ground in 5.0 mL 1% (V/V) oxalic acid. After centrifugation at 2 750 ×gfor 10 min at room temperature, the supernatant was collected and then titrated using a 2,6-dichlorophenol-indophenol sodium salt solution [19].
2.4 Determination of mineral elements content
Each accession ofA. arguta(1.5 g) was mixed with 25.0 mL HNO3(70% ) and 2.0 mL H2O2. They were then digested with a MARS6 microwave digestion instrument (PyNN Co., Ltd., China). The volumes were made up to 7.0 mL with concentrated HNO3and diluted to 25.0 mL with ultrapure deionized water, labeled accurately and used for analysis [20]. The elements Cr, Zn, Se, Cu, and Ni were measured by 7 500 inductively coupled plasma mass spectrometry (ICP-MS)(Agilent 7900, USA); while the elements Na, Mg, and Ca were measured with a JC. 14-350 flame atomic absorption spectrometer(Beijing Zhuochuan Electronic Technology Co., Ltd., China) [21].
2.5 Electronic tongue analysis
Analyses were conducted by the Taste-Sensing System SA 402B(Intelligent Sensor Technology, Inc., Kanagawa, Japan), consisting of an auto-sampler, Ag/AgCl reference electrodes, and multichannel lipid/polymer membrane electrodes, as described previously [22].A. argutasample (10.0 g) was added into a 100.0 mL volumetric flask to dilute, and centrifuged at 2 750 ×gfor 10 min at room temperature(TG16-WS, Hunan Xiangyi Group, China) and filtered. TheA. argutasamples were measured (three times) after the electric potentials of all membranes had stabilized.
2.6 Sensory assessment
The sensory pro filing ofA. argutawas conducted by an experienced panel, consisting of 10 panellists (5 males and 5 females) trained according to ISO 3972: 2011 and ISO 8586: 2012. A precise procedure of fruit evaluation was established as described by Latocha et al. [13]and Filippo D’Antuono et al. [23]with some modifications: fruit was cut directly before the assessment; their cross-section was smelled and odour attributes marked; the pulp was tasted to evaluate its juiciness characteristics; fruit with skin was tasted to mark the taste and flavor attributes. Five key attributes, olfactive intensity, juiciness,sweetness, sourness, and astringency, were selected for evaluation.The samples consisting of three fruits were individually coded and randomly presented to each panellist in plastic containers, to minimize any bias caused by presentation order. Between samples, cool flat boiled water (at ambient temperature) and pieces of the wheat roll were used as neutralizers. The intensity of attributes was scored on a 9 cm graphical continuous line scale from 1 to 10 with end-point anchor words: “nor perceived” and “very intense”.
2.7 Statistical analysis
All chemical determinations were in three replications and expressed as the mean ± standard deviation (SD). Duncan’s multiplecomparison test, one-way analysis of variance (ANOVA), correlation analysis (Pearson), cluster analysis (CA), and PCA of the samples were performed by using SPSS 24.0 Statistics (SPSS Inc., Chicago,IL, USA) to identify significant differences (P< 0.05) among accessions.
3. Results and discussion
3.1 Appearance and weight range of A. arguta fruit
The skin color of the fruit is one of the most important characters determining the fruit quality [24]. Generally,A. argutawas globose to a cylindrical ellipsoid. Fig. 1 showed the size, shape, and color of 67 accessions ofA. argutafruit. The fruit size of Maolvfeng (MLF),No.63, and LD133 were larger than the other accessions; while No.30,25, and 62 were the smallest 3 varieties. The fruit surface color of MLF was green with reddish brown and the core was yellow. The other 66 accessions were green on the skin and yellow on the core;however, it was difficult to distinguish among the similar colored fruits by visual method simply based on their appearance.
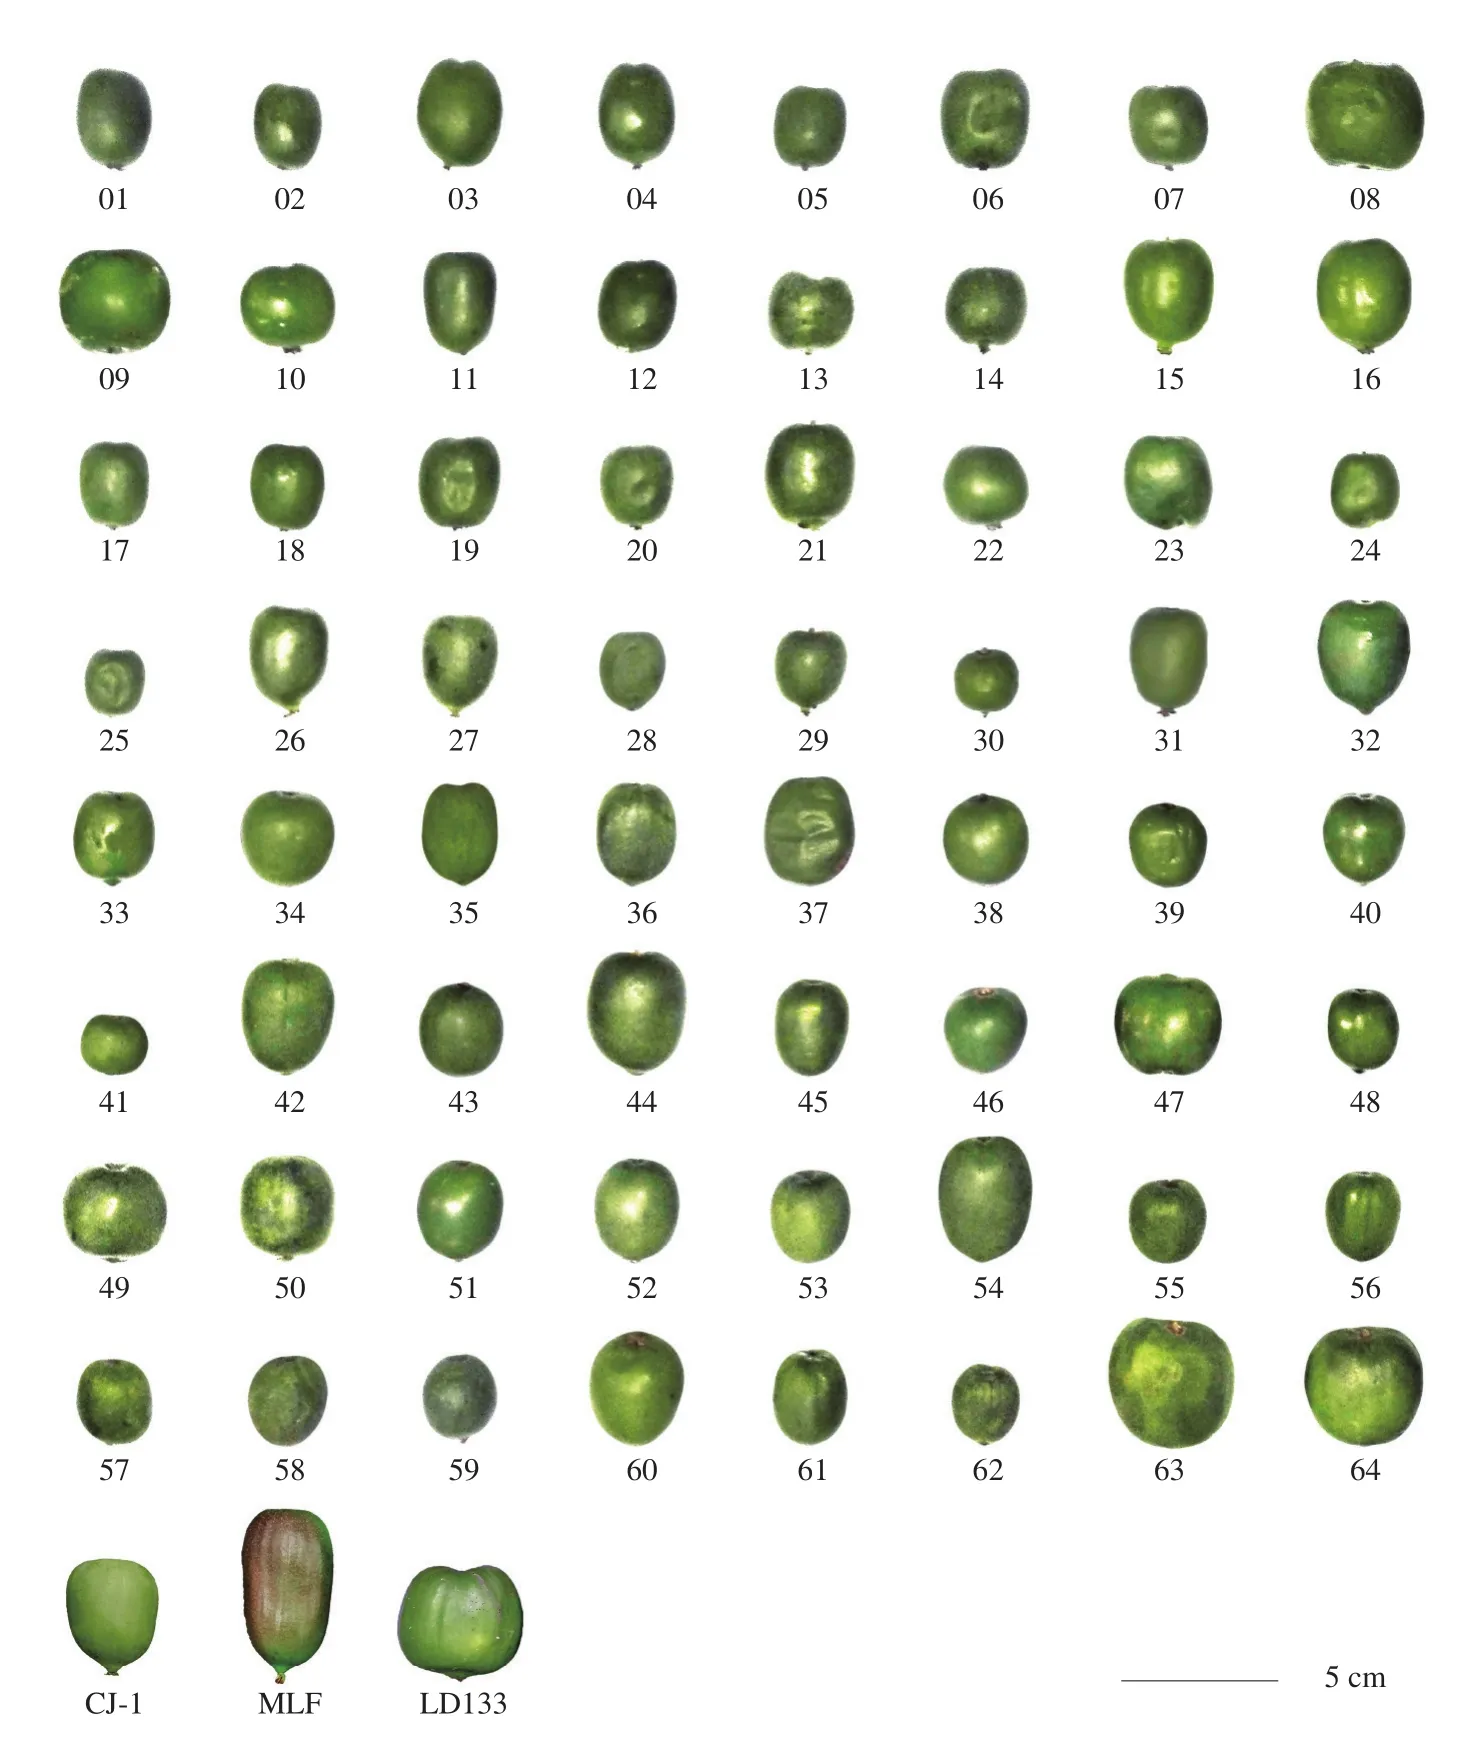
Fig. 1 The size, shape, and color of the 67 accessions of A. arguta.
As listed in Table S1, the fruit weight of the differentA. argutatypes ranged from 3.5 g to 24.2 g. There were significant differences in fruit weight among the accessions (P< 0.05). Among them,MLF was the largest ((24.2 ± 4.73) g) and No.30 was the lowest((3.5 ± 0.60) g). Differences in fruit weight can be explained by two factors: growth under different conditions and a very high variability within individual genotypes [13].
3.2 SSC, TAC, and SAR
Fruit taste can be scientifically evaluated and classified by TAC,SSC, and SAR [25]. The SSC, TAC, and SAR of the different accessions were shown in Table S1. The SSC of the different accessions ranged from 11.94% to 20.56% , with an average of 16.28% . The SSC of LD133 was the highest ((20.56 ± 0.16)% ),while No.41 was the lowest ((11.94 ± 0.31)% ). The TAC ranged from 0.15% to 1.20% , and No.42 was higher than that of the others((1.20 ± 0.01)% ), while No.43, 64, and CJ-1 were the lowest((0.15 ± 0.00)% ). There was a negative correlation (r= -0.10)(Fig. 2A) between SSC and TAC for theA. argutajuices. The SAR was also significantly different among the 67 accessions ofA. arguta.It ranged from 12.6 (No.31) to 124.6 (No.59). Tilahun et al. [18]conducted extensive research on the kiwifruit and found that there was a good positive correlation (r= 0.54,P< 0.01) between overall sensory evaluation and SAR. Thus, there could be good consumer preferences forA. argutawith a high SAR.
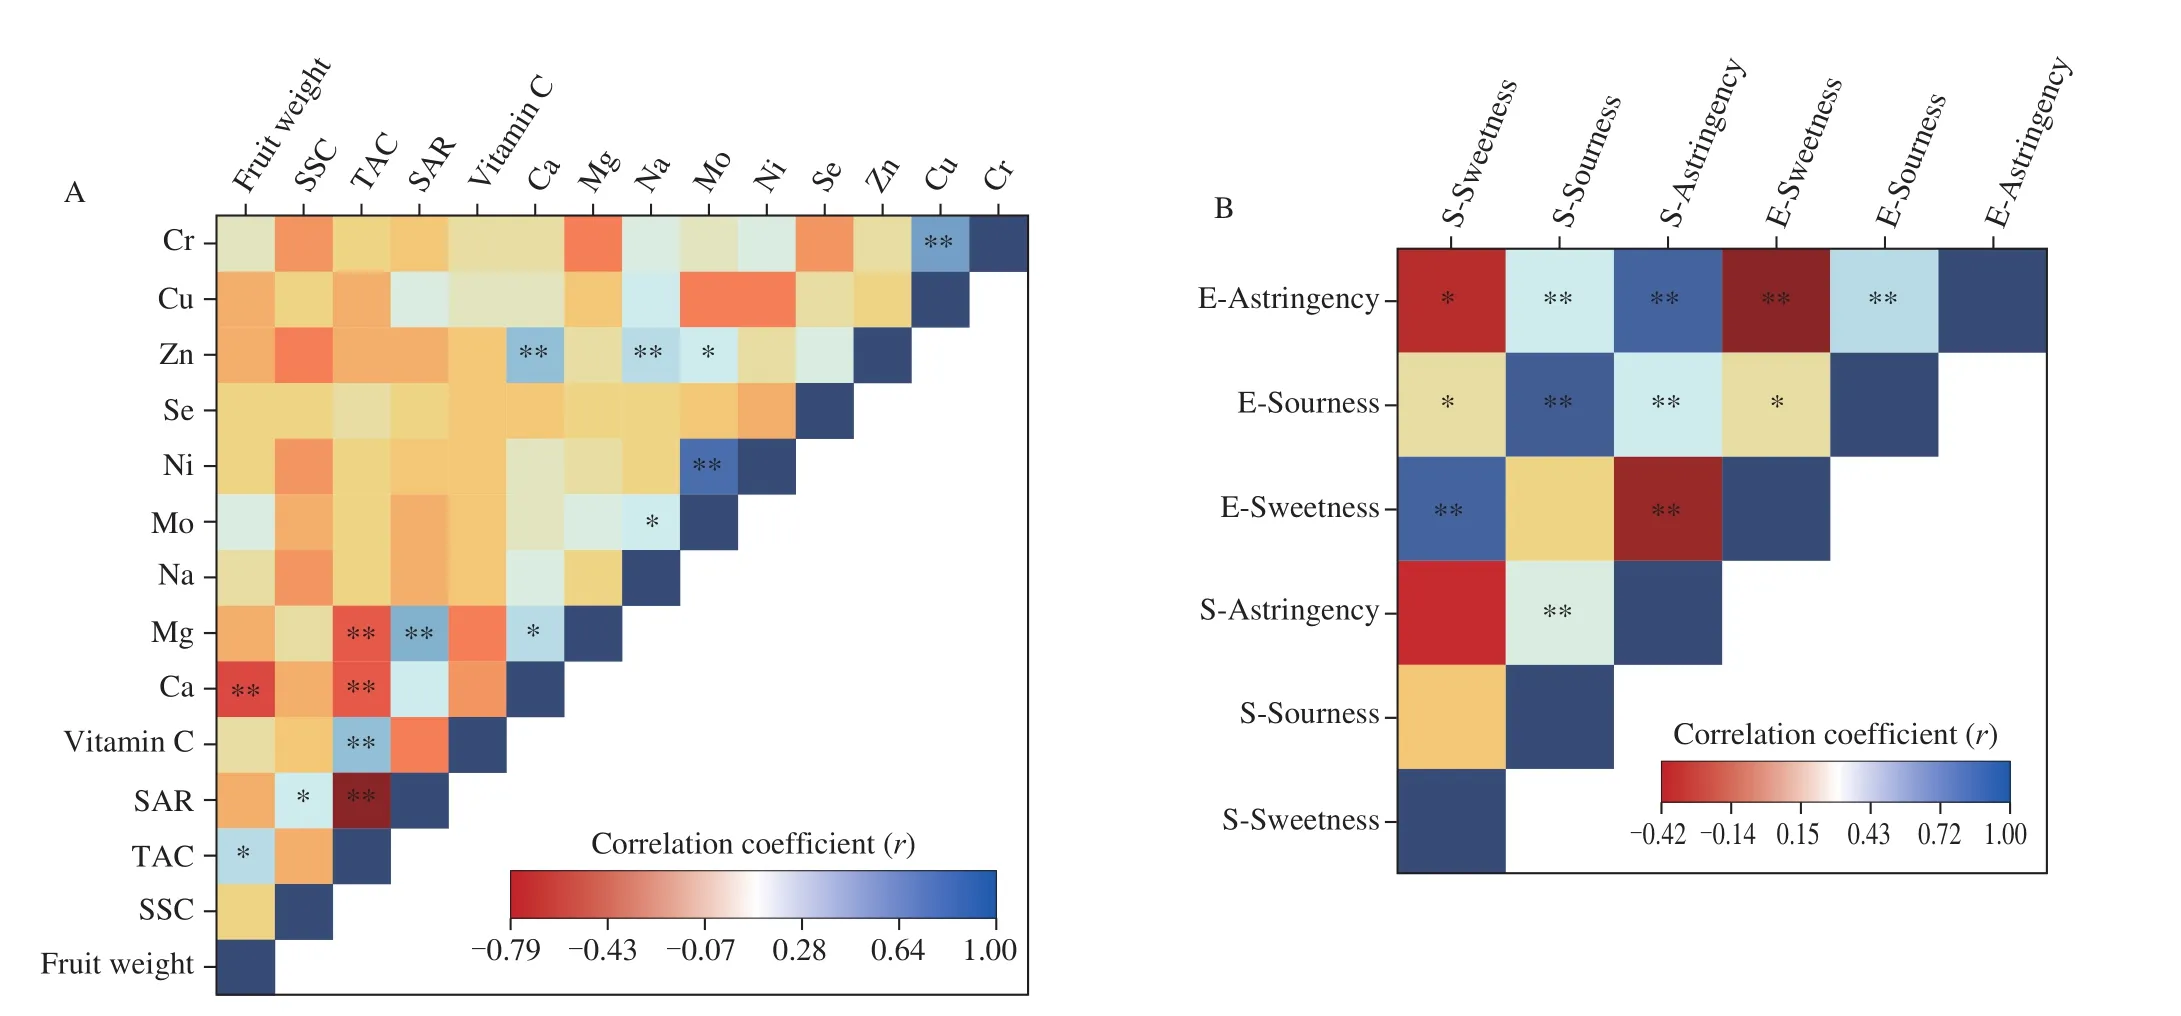
Fig. 2 Correlation coefficients (Pearson) among 14 quantitative traits (A) and taste-active compounds and the sensory attributes (B) of the 67 accessions of A. arguta. Blue and red colors represent positive and negative correlations between factors. * or ** indicate statistically significant correlations at P < 0.05 or 0.01,respectively. “E-” stands for the taste-active compounds, and “S-” stands for the sensory attributes.
The SSC and TAC in this study had a wider range compared with other kiwifruit that ‘Zesy002’ kiwifruit ranged from 17.4% to 19.3% and from 0.41% to 0.90% , respectively [26]. Compared with ‘Sanuki Gold’ kiwifruit (SSC 8.60% , TAC 2.58% ) and ‘Hayward’ kiwifruit(SSC 7.0% , TAC 2.60% ),A. argutahad higher SSC and lower TAC [27]. As a result, the SAR ofA. argutawas higher, and consumers preferred it in terms of sensory.
3.3 Vitamin C content
Vitamin C is one of the most important water-soluble vitamins which has been widely found in fruits and vegetables. Park et al. [28]showed that vitamin C was one of the major contributors to the total antioxidant capacity inActinidiafruit, so it had been used as a food antioxidant and additive [29,30]. In the present study, the vitamin C content ranged from 3.51 g/kg to 230.76 g/kg (fresh weight) (Fig. 3),and it showed a significant (r= 0.41,P< 0.01) correlation with their TAC (Fig. 2A). The vitamin C content of No.38 was highest((230.76 ± 3.92) g/kg fresh weight), which was significantly different from the other accessions (P< 0.05); the content of No.17 was the lowest ((3.51 ± 0.00) g/kg fresh weight). Compared with the study by Leontowicz et al. [7], which vitamin C ranged from 50 g/kg to 200 g/kg (fresh weight), the vitamin C content ofA. argutafruit in this study had a wider range. According to Wojdyło et al. [14],the vitamin C content ranged from 76.09 g/kg to 282.56 g/kg(fresh weight). Differences in fruit vitamin C content can be explained by three factors: long-term storage at low temperature; growth under different conditions, as pointed out by Krupa et al. [31]and Ma et al. [32],and significant differences among the various accessions. According to Dietary Reference Intakes (DRIs), the recommended intake of vitamin C for adults is 100 mg/d. They only need 4 to 10 fruits per day to meet the daily intake requirement for germplasm with high vitamin C content.Vitamin C has an important physiologic role in numerous metabolic functions including tissue growth and maintenance, amelioration of oxidative stress, and immune regulation. Decreased vitamin C levels in human bodies have been reported to be associated with various diseases, such as certain types of neoplasia, endocrinopathies,and neurologic disorders [33]. Compared with other fruits,A. argutahas a higher level of vitamin C than oranges (60-70 g/kg),strawberries (40-70 g/kg), lemons (60-70 g/kg), and grapefruits(30-35 g/kg) [32,34,35].
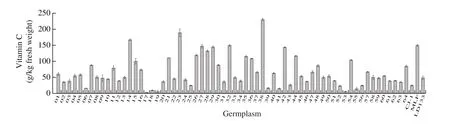
Fig. 3 The vitamin C contents of the 67 accessions of A. arguta.
3.4 Mineral element contents and CA
3.4.1 Mineral element contents
Dietary minerals are essential nutrients that drive key cellular and physiological functions. Kiwifruit has been reported to have higher key micronutrients including K, P, Mg, Ca, and Fe than most other fruits [36]. The contents of nine elements in the fruit samples were shown in Table S1. The normal test function was used to conduct a K-S test on the contents of mineral elements in different accessions.The results showed that there were significant differences in the content of three macro-elements among the accessions (P< 0.05).
The mean Ca content ofA. argutawas 0.88 mg/g, significantly higher than the kiwifruit [32,37]. The Mg content was 0.10 mg/g,slightly lower than the kiwifruit [6,32]. The Na content was 0.32 mg/g.According to the findings of Sivakumaran et al. [38]and D’Evoli et al. [6],the Na content ofA. argutawas approximately 10 times higher than the kiwifruit. The contents of Ca and Na were significantly higher than that of Mg, and there was an extremely significant difference between Ca and Na (P< 0.01). Among the 67 accessions, No.17 had the highest Ca content, No.34 had the highest Na content, and No.59 had the highest Mg content. However, No.13 had the lowest content for all of the elements.
Se is recognized as an essential micronutrient for humans and animals [39], and its content inA. argutawas nearly two times higher than that in kiwifruit [32]. The mean Se content was the highest in No.9 (1.01 µg/g), however, No.16, 23, and 27 had the lowest Se content. The mean content for Zn was 8.38 µg/g, significantly higher than that in kiwifruit [6,32]. No.33 had the highest Zn content, and No.13 had the lowest. Cu was 1.32 µg/g, similar to the findings reported by D’Evoli et al. [6]and Sivakumaran et al. [38].In addition, the mean Ni, Mo, and Cr were 1.42, 0.49, and 0.28 µg/g,respectively.
3.4.2 Correlation and CA
Significant correlations were detected among some characteristics as revealed by the Pearson correlation coefficient (Fig. 2A). The Ca content had a negative and significant correlation with fruit weight(r= -0.38) and TAC (r= -0.35) and a positive correlation with Cr(r= 0.53). In addition, Mg was positively and significantly correlated with SAR (r= 0.49) and Ca (r= 0.30), while it was negatively correlated with TAC (r= -0.34). Zn was positively and significantly correlated with Ca (r= 0.43), Na (r= 0.33), and Mo (r= 0.25).Similarly, Mo had positive and significant correlations with Na(r= 0.26) and Ni (r= 0.71).
The dendrogram obtained based on 6 micronutrients (Mo, Ni,Se, Zn, Cu, and Cr) clustered the accessions into two major clusters(Fig. 4). Sixty-two accessions were placed into the first cluster(I), which was divided into two sub-clusters (I-A and I-B). Subcluster I-A was divided into two parts (I-A-a and I-A-b). The rest of the accessions were placed into the second cluster (II). I-A-a was comprised of 30 accessions, which can be divided into 5 categories,I-A-a-1 (8), I-A-a-2 (4), I-A-a-3 (6), I-A-a-4 (6), and I-A-a-5 (6).I-A-b includes a total of 31 accessions, which can be divided into 4 categories, I-A-b-1 (9), I-A-b-2 (9), I-A-b-3 (5), and I-A-b-4 (8).I-A-a-1 had higher values of Mo and Ni; I-A-a-2 had higher values of Zn and Se, and lower values of Ca; I-A-a-3 had lower values of Mo,Cr, Ni, and Cu; I-A-a-4 had higher values of Cr, and lower values of Mg; and I-A-a-5 had higher values of Ca and Zn, and lower values of Cr, Ni, and Se. I-A-b-1 had higher values of Cu, and lower values of Mg, Ni, and Se; I-A-b-2 had lower values of Mg and Zn; I-A-b-3 had higher values of Mo, Ni, and Zn; and I-A-b-4 had lower values of Ni and Zn. In sub-cluster I-B, there was only one accessions that had higher values of Mo, Ni, and Cr. In cluster (II), No.33, 34, 16, 02,and 01 were grouped together because they had higher values of Mo,Se, and Cr and extremely high values of Ni and Zn. Consumers can choose suitable accessions according to their needs for minerals.
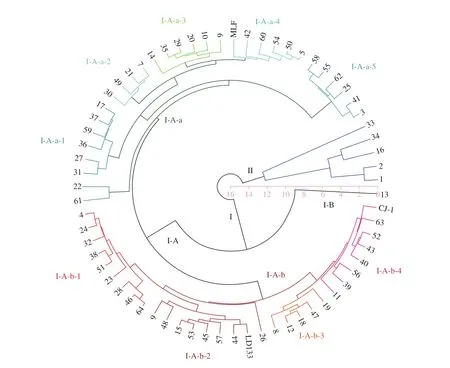
Fig. 4 Cluster analysis based on 6 micronutrients (Mo, Ni, Se, Zn, Cu, and Cr) of the 67 accessions of A. arguta.
3.5 Electronic tongue analysis
The electronic tongue uses an artificial intelligence system and electronic sensors that mimic taste perception in humans to detect taste profiles [39]. Fig. 5 showed the taste determination using the electronic tongue. The sourness was positively correlated with the sweetness in all accessions (r= 0.30,P< 0.05). No.55 had the highest umami taste value and CJ-1 (Changjiang-1) had the lowest (Fig. 5A).The sweetness taste of CJ-1 was the highest and that of LD133 was the lowest (Fig. 5B), while No.31 had the highest sourness taste value and No.49 had the lowest (Fig. 5C). No.9 had the highest bitterness taste value and No.43 had the lowest (Fig. 5D), while the astringency taste of No.9 was the highest and that of No.42 was the lowest (Fig. 5E).
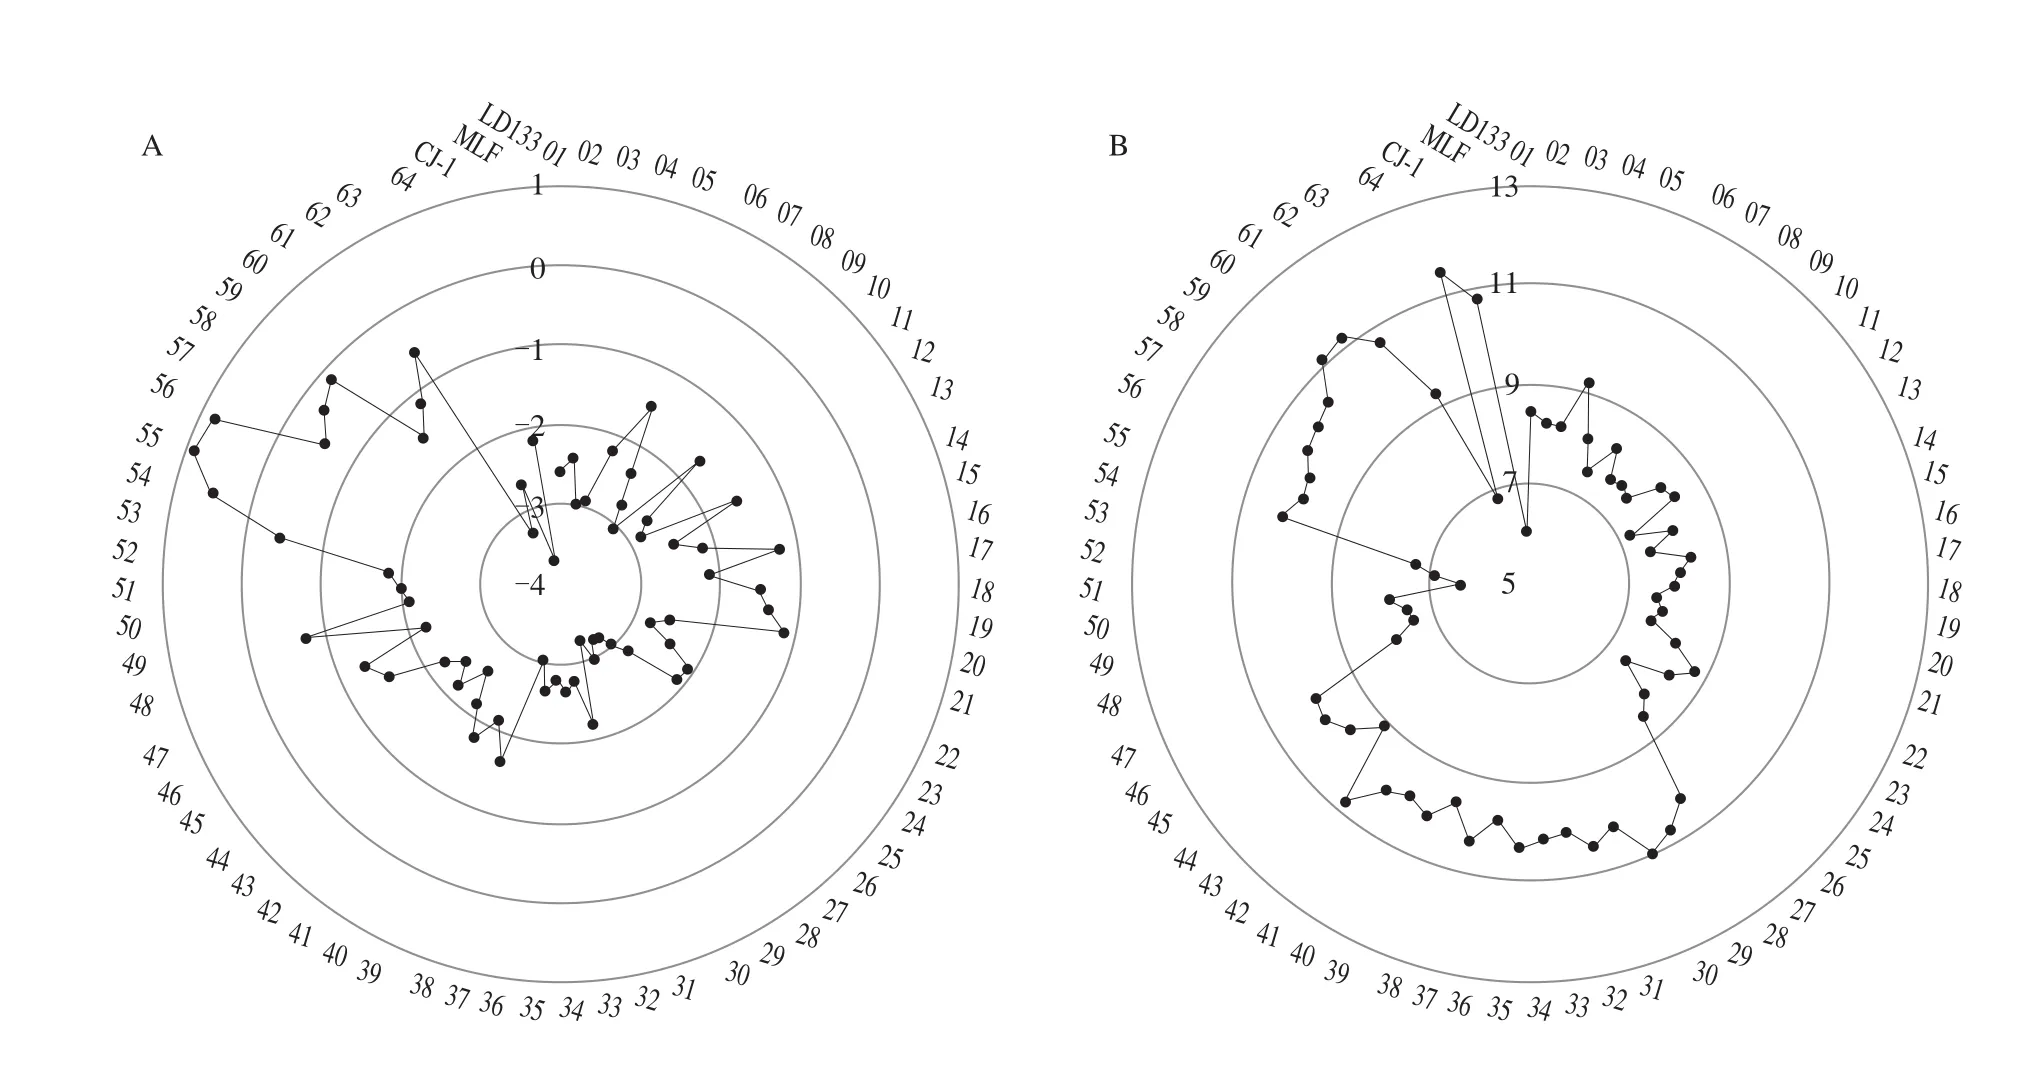
Fig. 5 Image of A. arguta tastes determined by the electronic tongue: umami (A), sweetness (B), sourness (C), bitterness (D) and astringency (E).
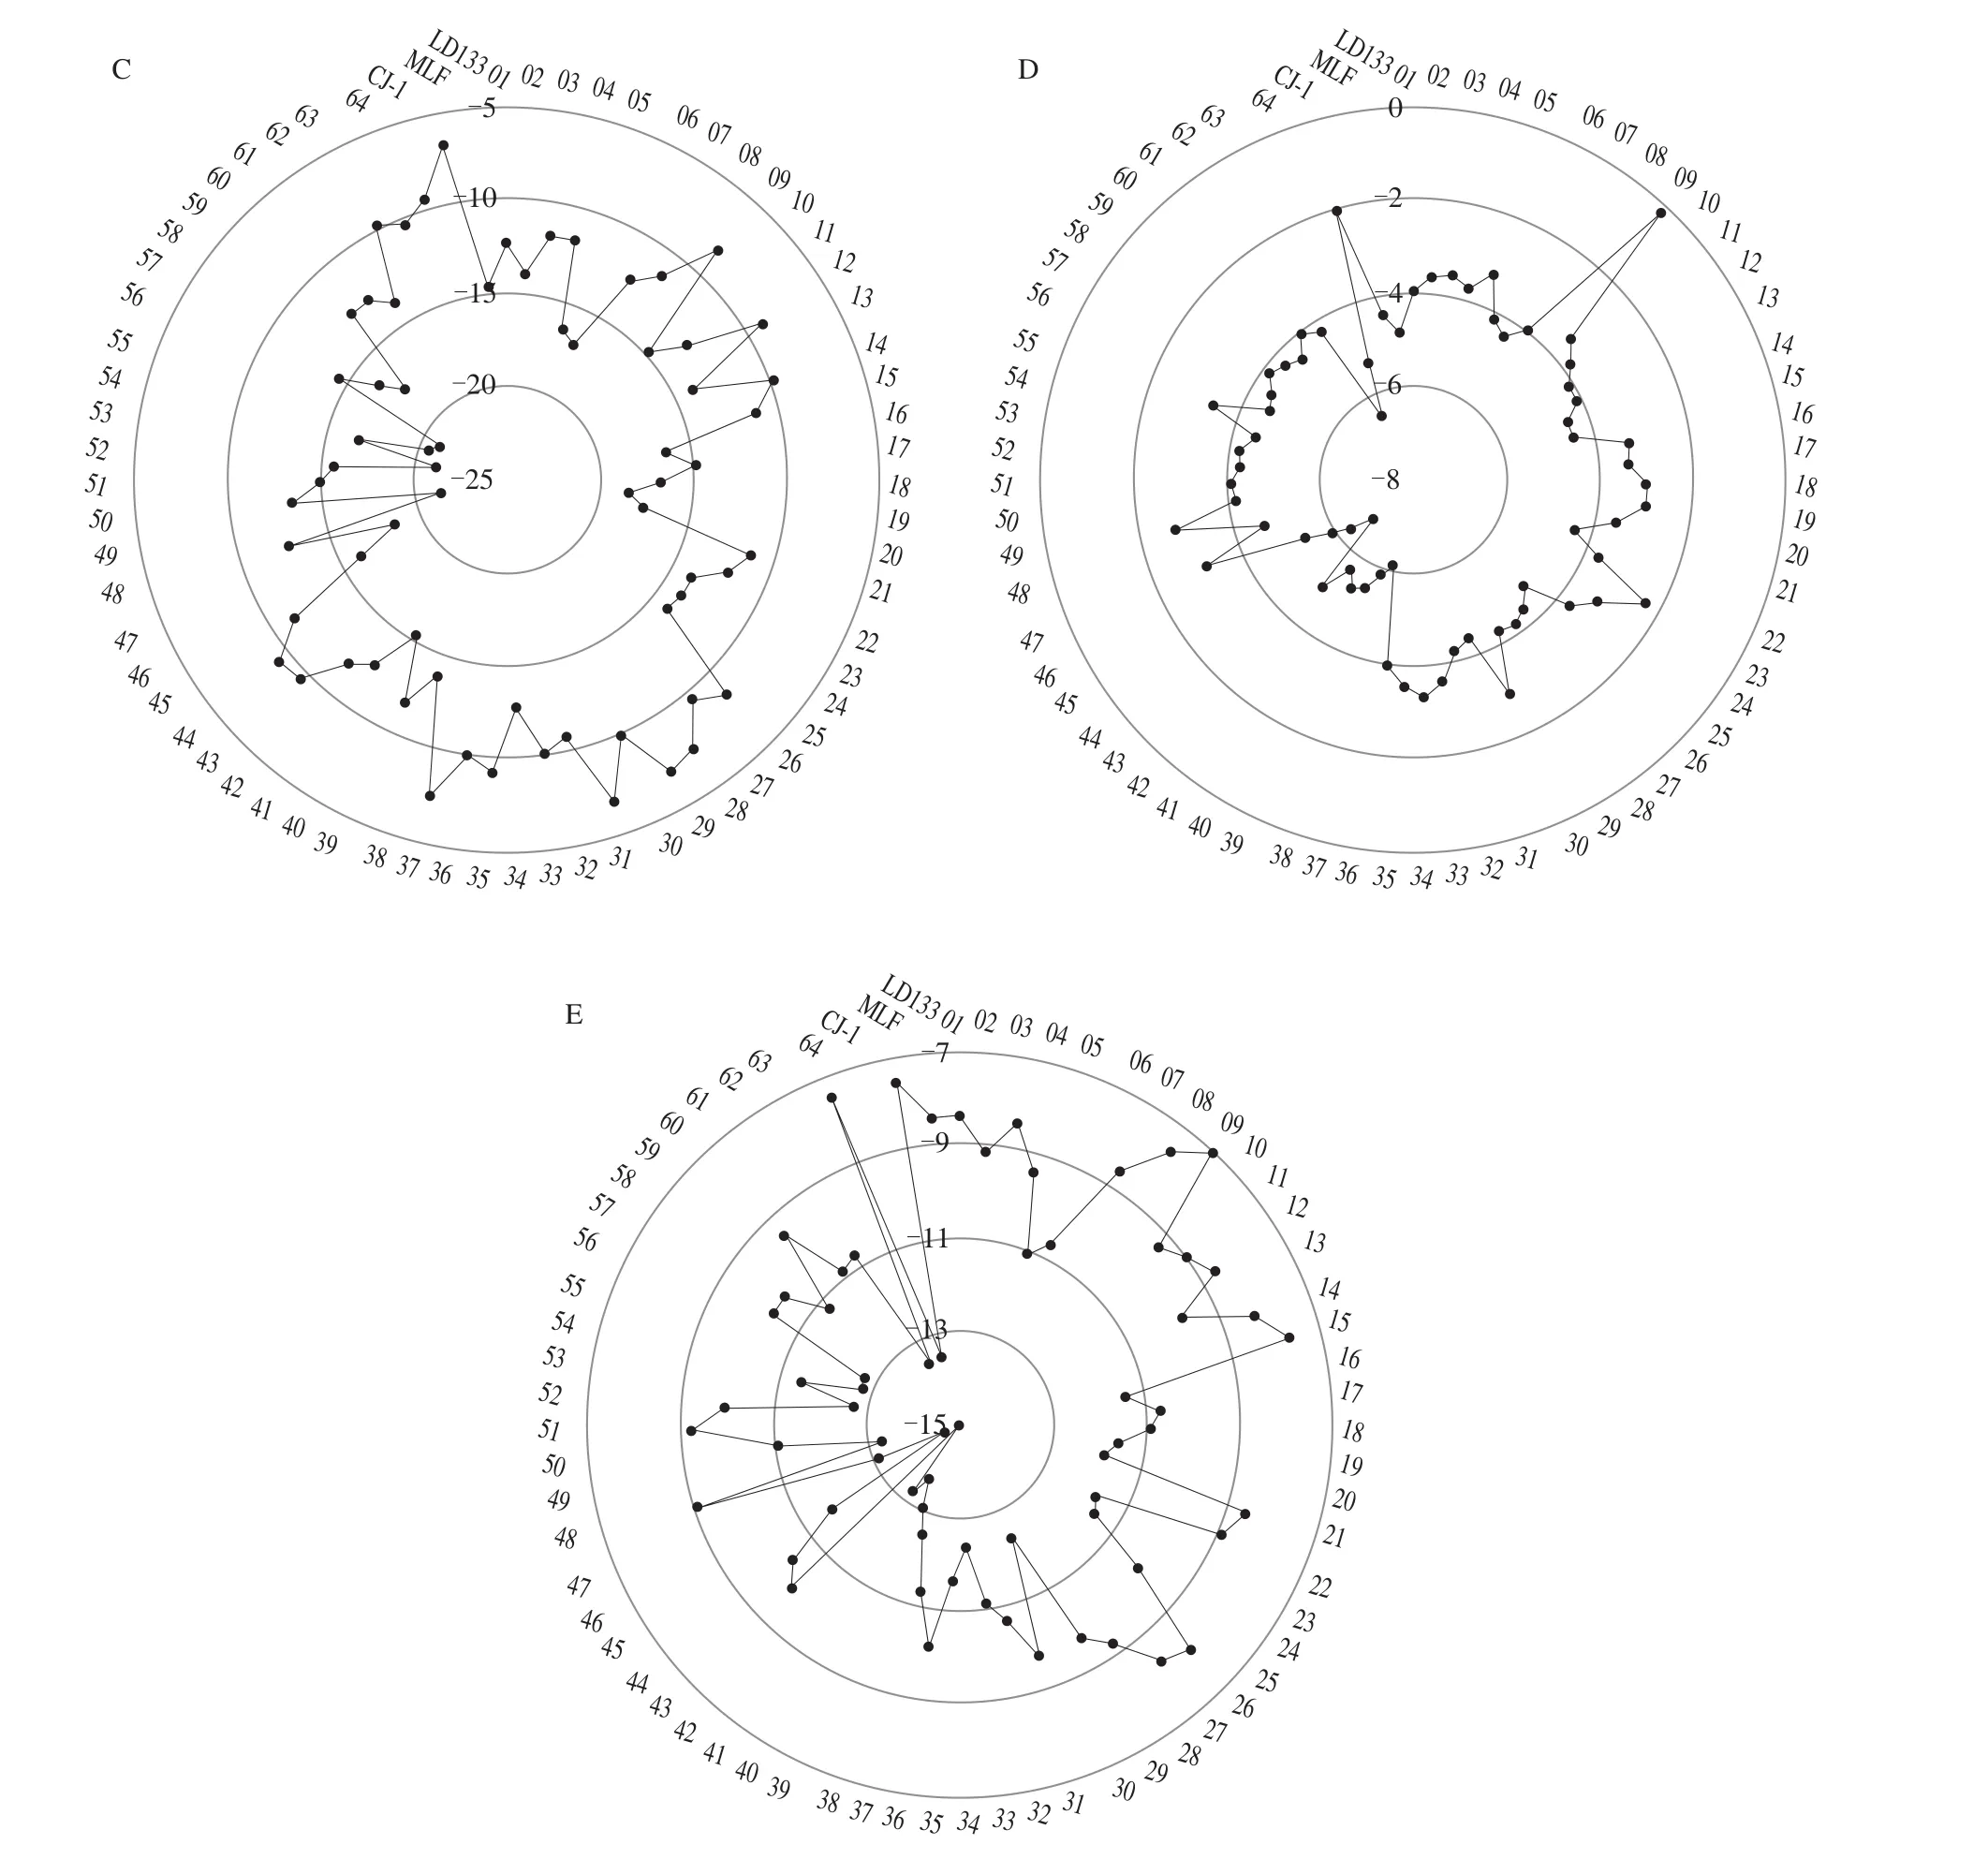
Fig. 5 (Continued)
The TAC values ofA. argutawere correlated with sourness(r= 0.40,P< 0.05); however, accessions with high and low SSC did not match accessions with high and low values of sweetness (Table S1,Fig. 5B). The perception of sweetness may have been affected by other factors, such as anthocyanins and phenolic compounds.Fan et al. [40]have reported that anthocyanins and phenolic compounds strongly refract light and contribute up to 32% of the SSC values in samples containing these pigments. Thus, SSC is possibly not a great indicator of sugar concentrations in fruit extracts ofA.argutaas it is in other less-pigmented fruit extracts.
3.6 Sensory analysis
The general sensory profile was presented in Table 2, showing the average sensory attribute values for the examined 67 accessions.CJ-1 was characterized by the highest olfactive intensity, followed by LD133 and No.51, which exhibited a slightly lower value, but not significantly different from CJ-1. No.24 and 37 showed analogous values of juiciness trait, which were significantly higher compared to MLF. Concerning sweetness, CJ-1 displayed higher values than the other 66A. argutaaccessions, while, for the sourness attribute, No.08,28, 29, and 43 showed very similar and higher values than others.Regarding astringency, No.45 presented the maximum value among all the accessions.
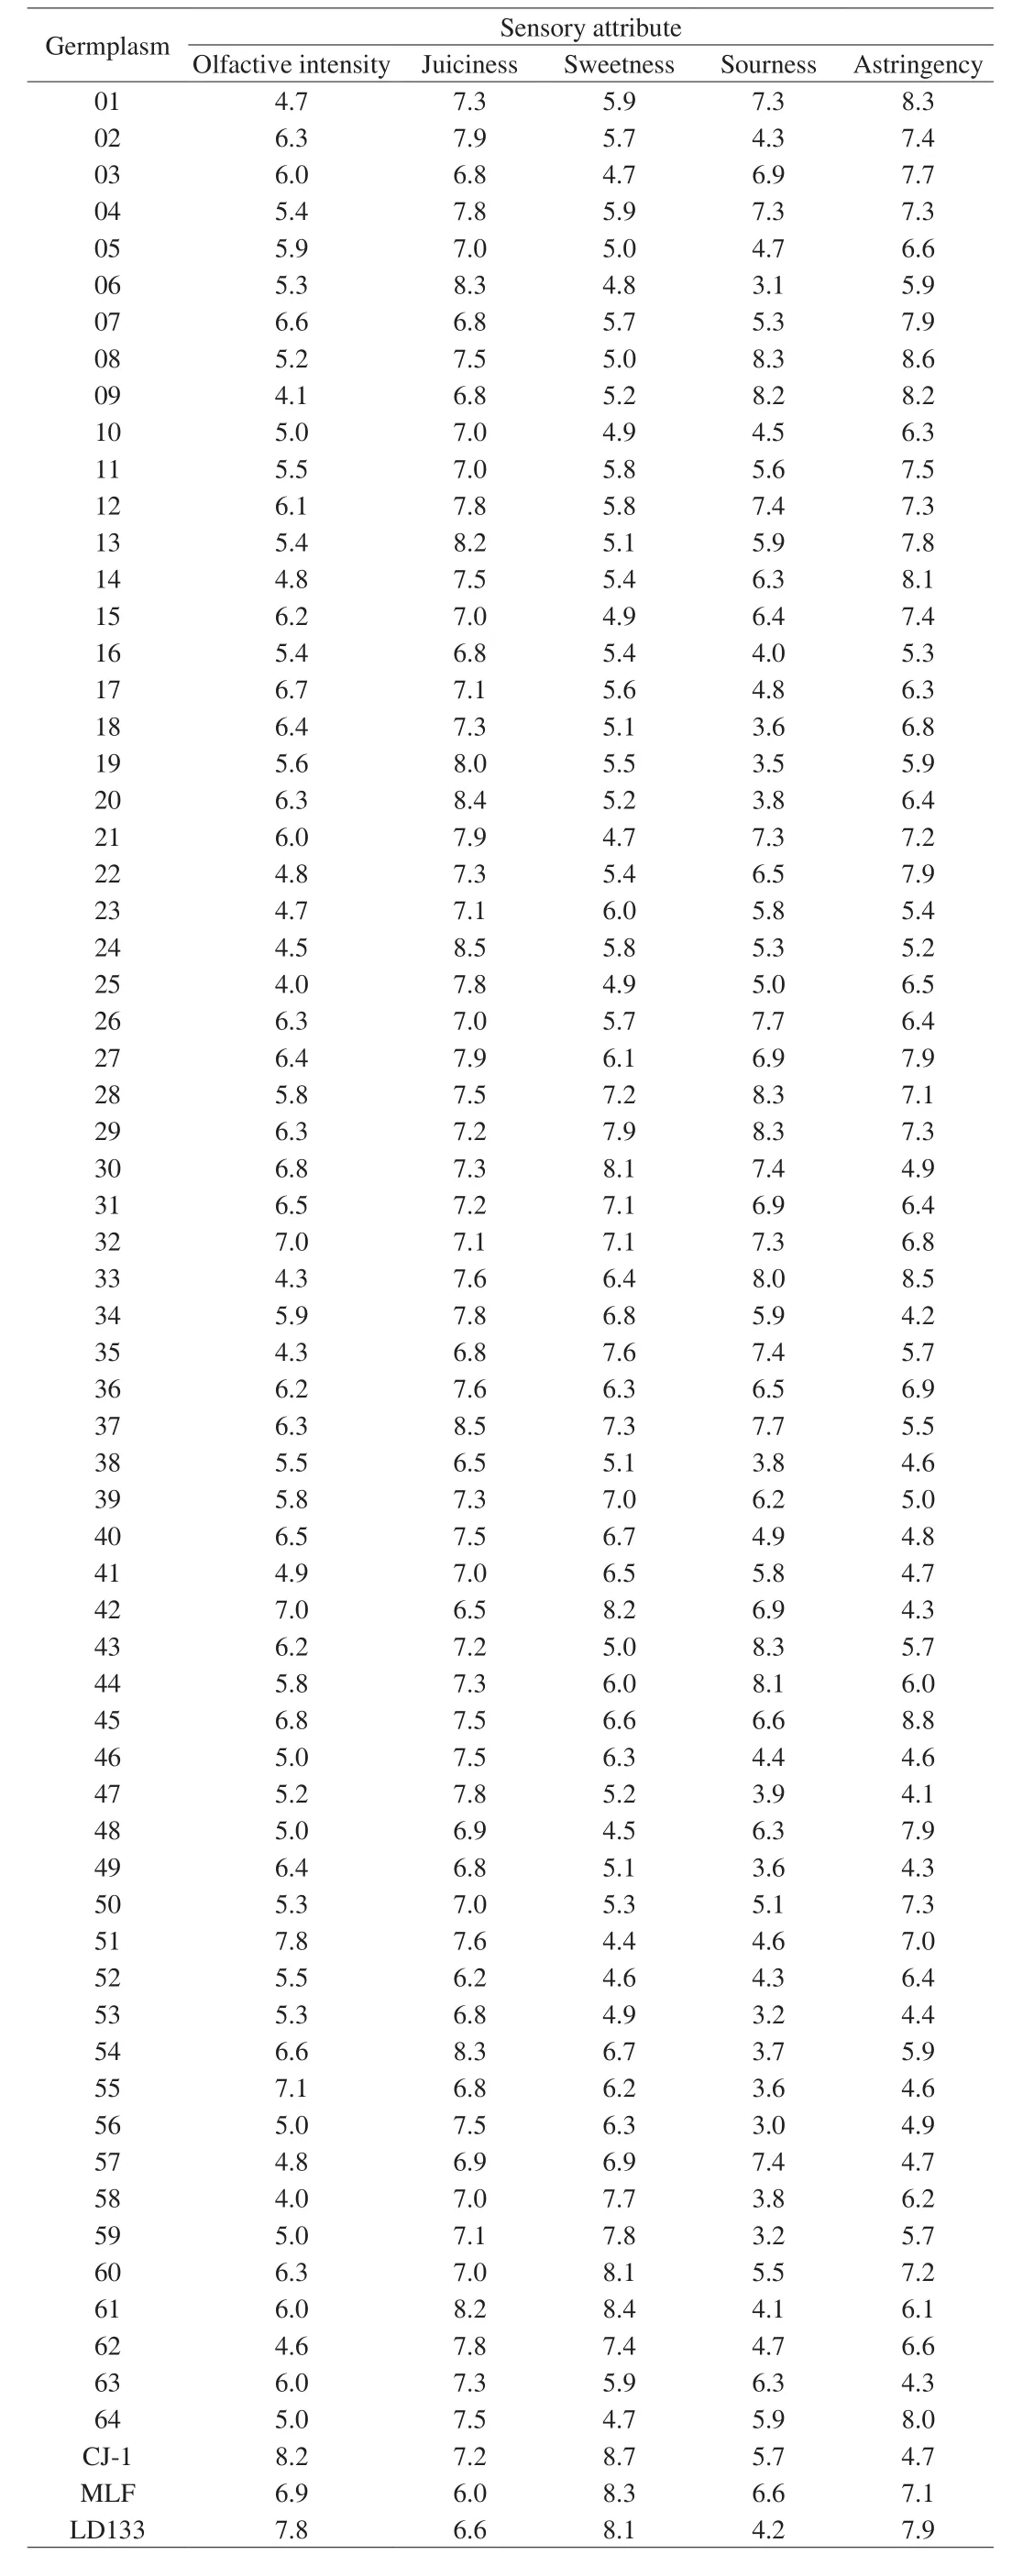
Table 2Mean values of sensory characteristics for different accessions of A. arguta.
The relationship between the electronic tongue response data and the sensory attributes was shown in Fig. 2B. It was observed that the sweetness attribute was well correlated to the sweetness of electronic tongue (r= 0.82,P< 0.01). The sourness of electronic tongue was well correlated with a sweet taste (r= 0.86,P< 0.01). In addition,the astringency attribute was well correlated to the astringency of electronic tongue (r= 0.82,P< 0.01). The results indicated that the sensory attribute ofA. argutawas rapidly and objectively characterized using the electronic tongue.
3.7 PCA and ranking according to comprehensive quality
3.7.1 PCA
PCA is used to identify potential trait combinations. It extracts principal components based on the characteristics of each eigenvalue.In PCA, a total of 5 principal components were identified that contributed to the total variation (Table 3). The eigenvalues of PC1 to PC5 were all more than 1 (the Kaiser’s criterion) [41], and 5 PCs for the analysis accounted for 66.534% . Therefore, 5 PCs were extracted to replace most of the information of the original variables [42].
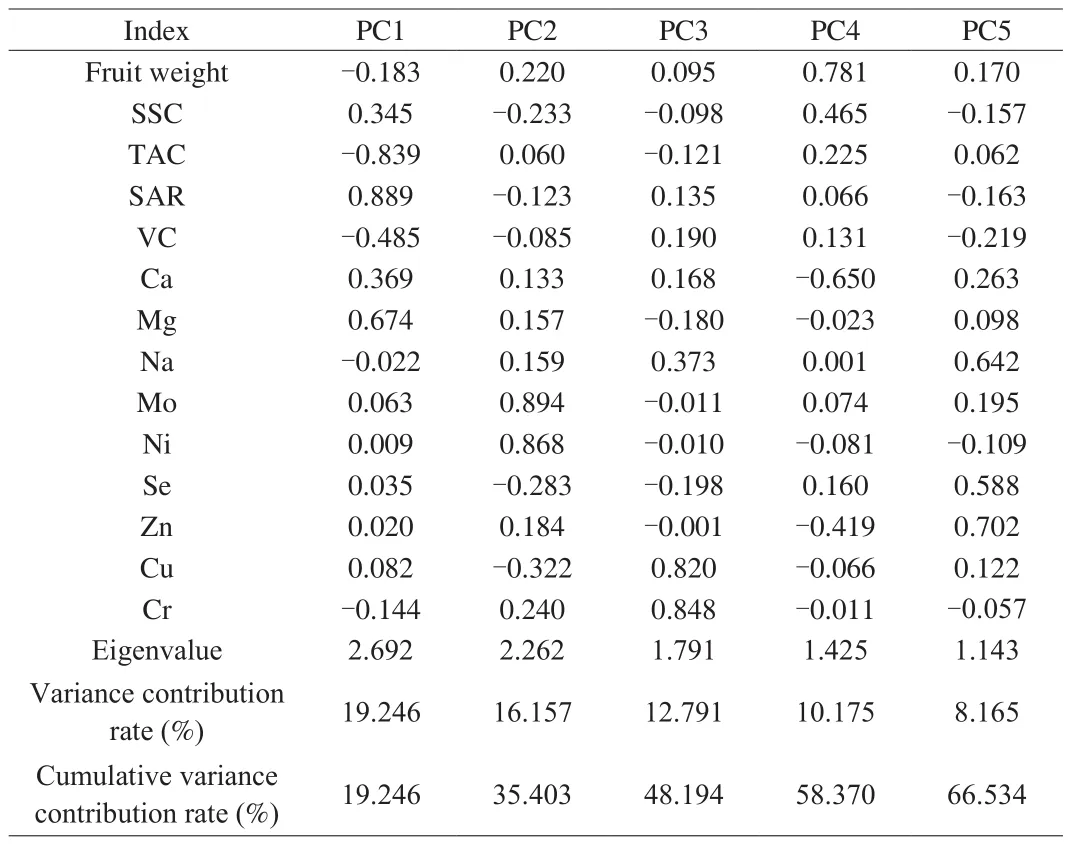
Table 3Eigenvalue, variance contribution rate and cumulative variance contribution rate of the 5 principal components.
As reported in Table 3, the loading of variables showed that primarily SAR, TAC, and Mg contents took part in the formation of PC1 (variance contribution rate of 19.246% ). The variance contribution rate of PC2 was 16.157% , which was primarily responsible for the differences of the contents of Mo and Ni. PC3 accounted for 12.791% of the variance contribution rate, was related to the contents of Cu and Cr. PC4 accounted for 10.175% of the total variation, was mainly correlated with Ca contents and fruit weight.PC5 mainly re flected the information of Zn and Na contents, and its variance contribution rate was 8.165% . In addition, a PCA scatter plot was constructed based on the first three components (Fig. 6).
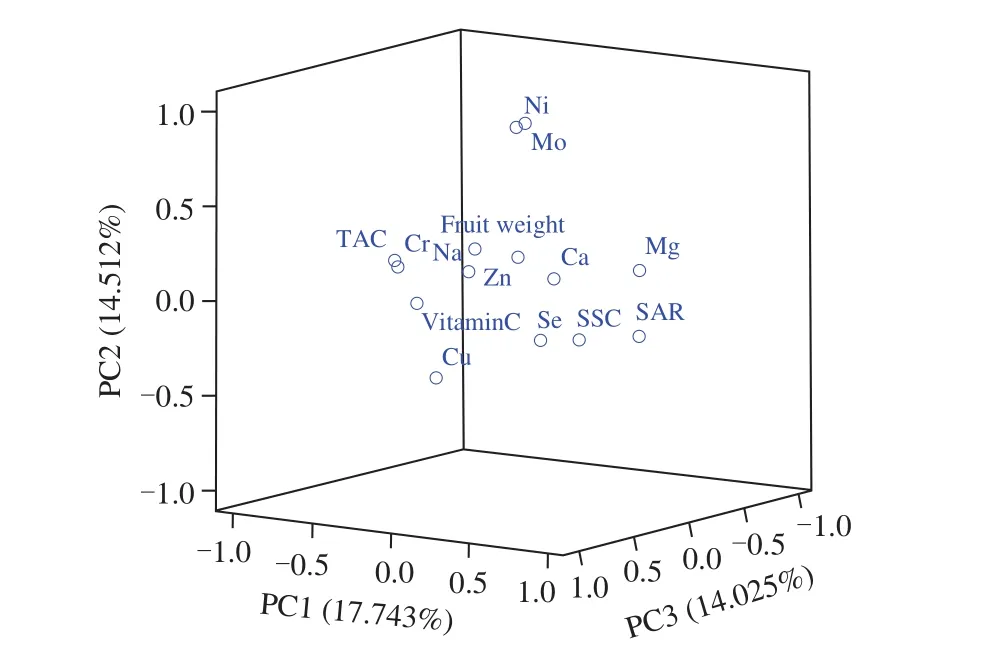
Fig. 6 Three-dimensional PCA plot of the 14 quantitative traits with regard to the first three principal components.
3.7.2 Ranking according to comprehensive quality
A. argutaquality is a comprehensive concept and is not only based on the single quality attributes but also on interactions among them. It includes the external characteristics (weight, shape, and color) and taste qualities (SSC, TAC, and SAR), and also involves nutritional value (vitamin C and mineral elements) [11]. These indicators can be replaced by 5 PCs, and therefore PCs can represent comprehensive fruit quality. According to the breeding characteristics and current market demand,A. argutaare usually consumed as fresh fruit or processed fruit products. A goodA. argutagermplasm for fresh market consumption requires a high SSC and SAR as well as a high fruit weight [43]. Therefore, PC1 and PC4 were selected as the main components of fresh fruit quality, and PC2-PC5 were selected as the main components of processed fruit quality. Comprehensively,fresh and processing qualities were calculated with the following formulas:
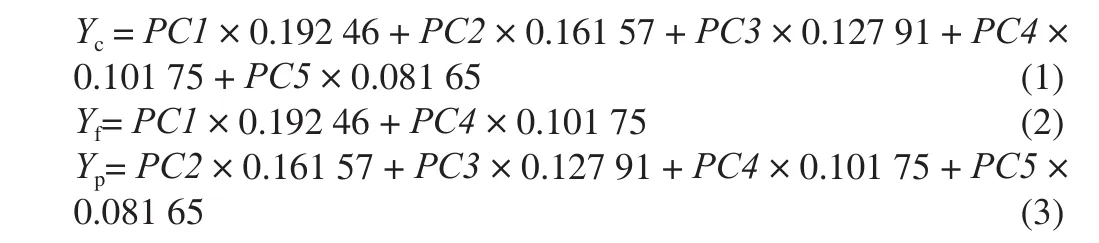
WhereYcwas the comprehensive quality score;Yfwas the comprehensive evaluation score of fresh fruits;Ypwas the comprehensive evaluation score of processing fruits.
The top 10A. argutagermplasms with high potential consumer preferences were No.59, 61, 34, 43, CJ-1, LD133, 16, 33, 30, and 22 based on the final rank of comprehensive quality (Table 4). For fresh utilization, the top ten were No.59, 64, 43, CJ-1, 40, 19, 20, MLF, 47,and LD133. For processed fruit, the comprehensive quality ranked from higher to lower were No.34, 61, 16, 33, 22, 27, MLF, 49, 30, and LD133. It should be noted that this ranking method mainly focused on the fruit quality and nutrients, which were deemed important to consumers.
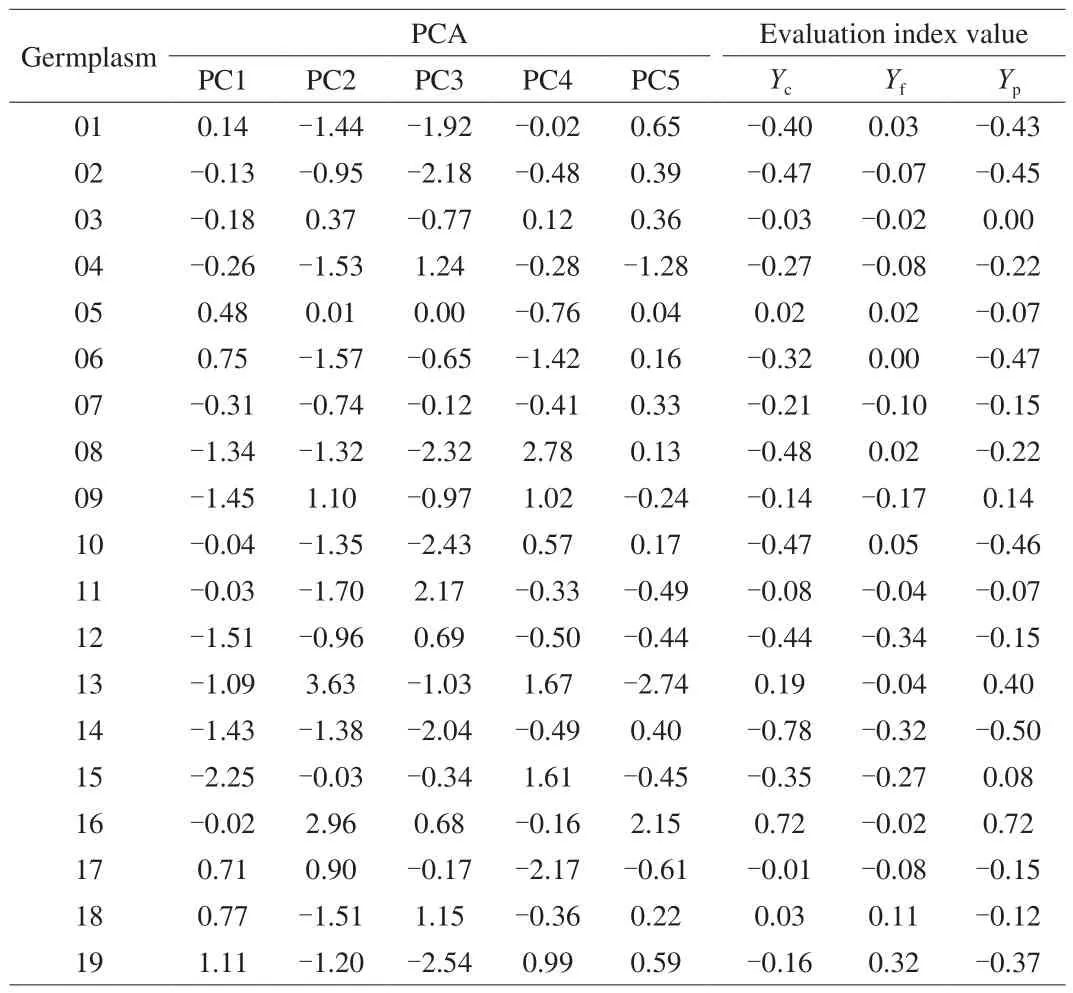
Table 4Principal component value and comprehensive evaluation index of the 67 accessions of A. arguta.
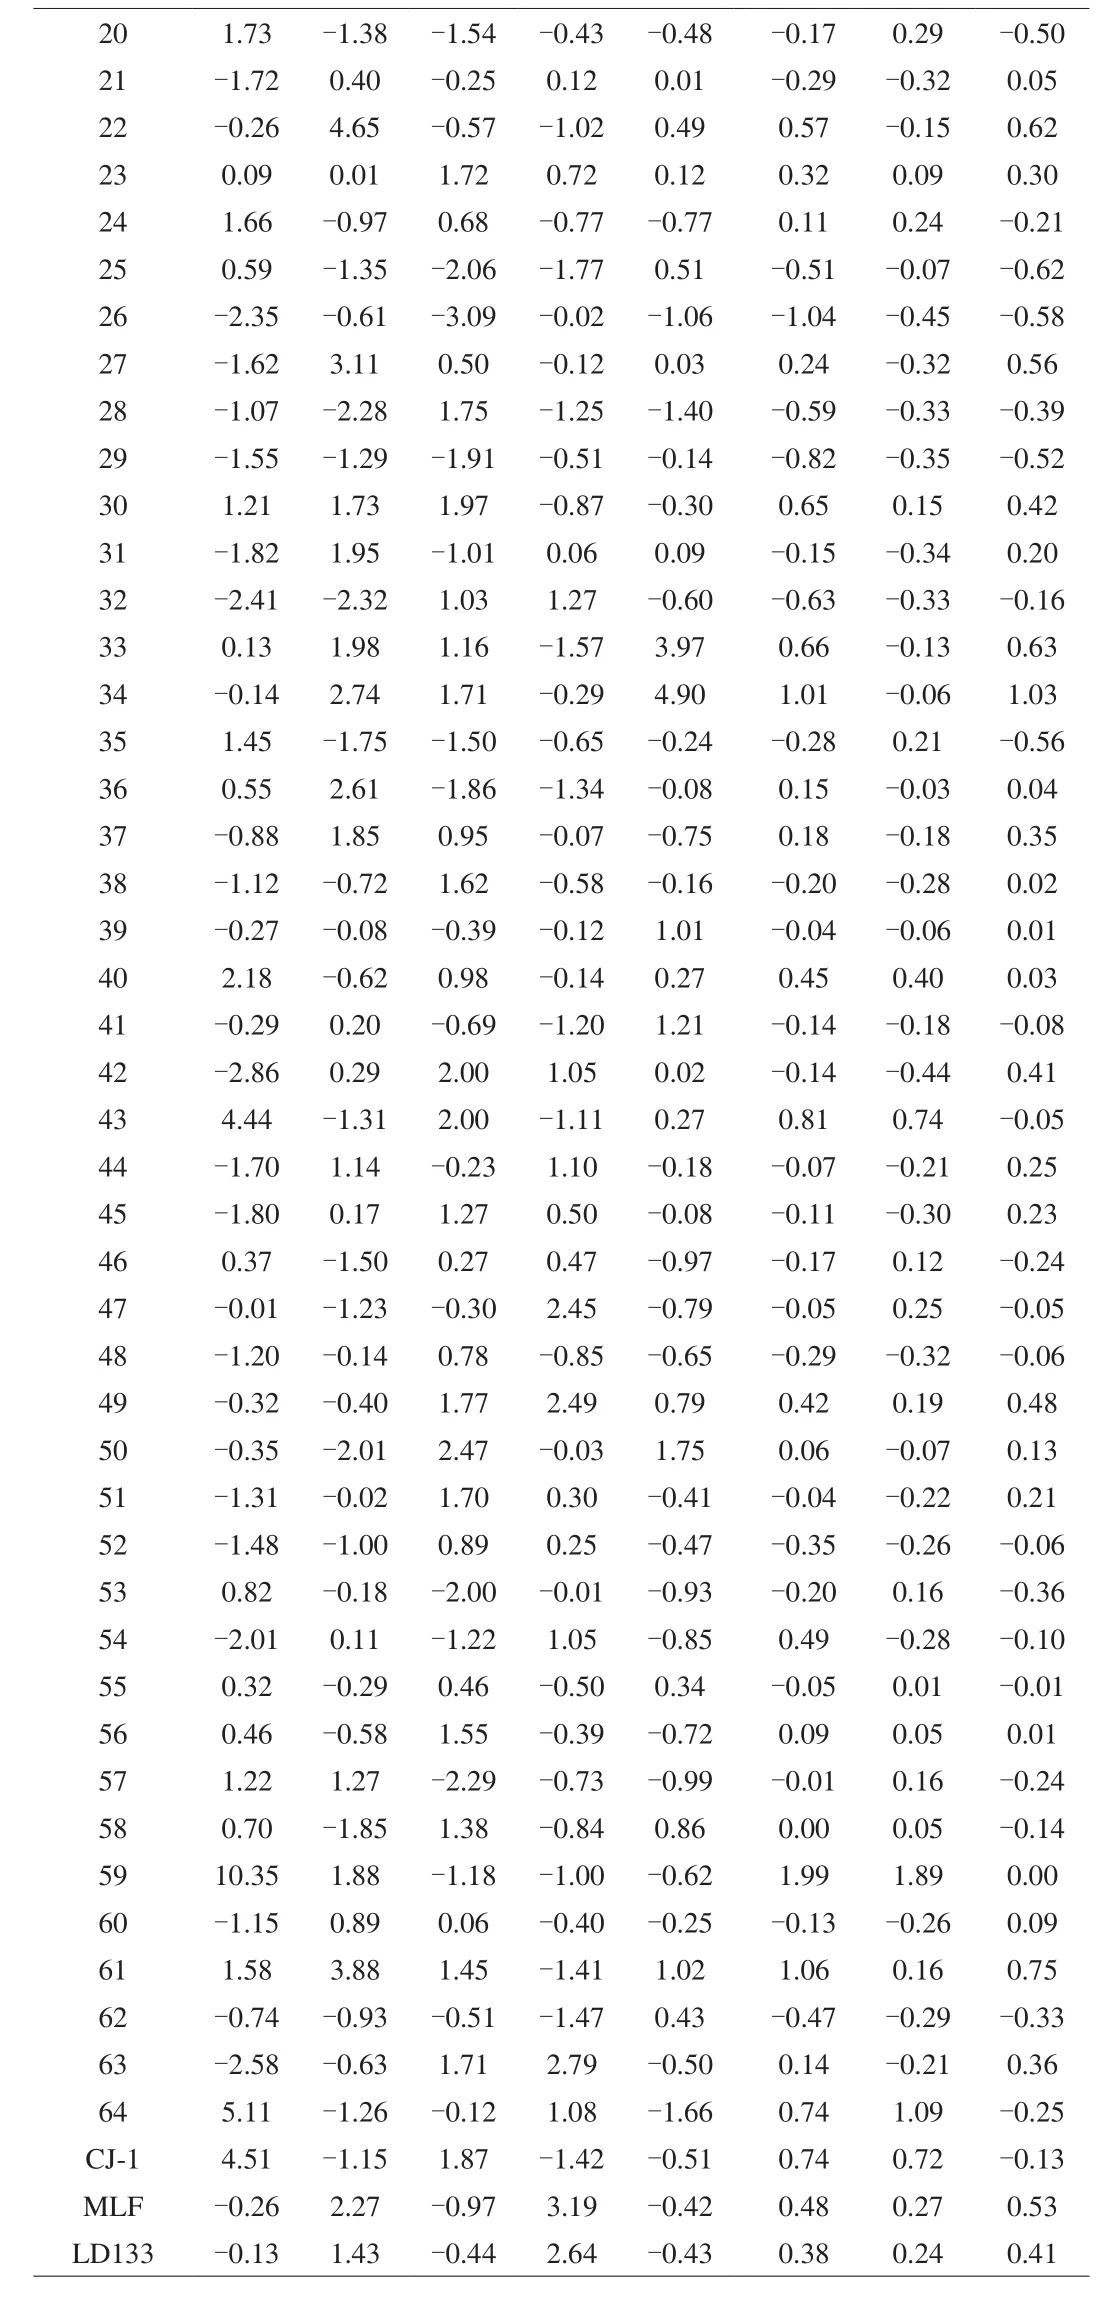
Table 4 (Continued)
4. Conclusions
Overall, significant diversity was revealed regarding the fruit quality and nutraceutical properties of the evaluated germplasms.Additionally, the correlations among the fruits’ properties were fully revealed based on the analytical results.A. argutacan be considered as a good source of macroelements (Na, Cu) and microelements (Se, Zn). These accessions can be classified based on their characteristics with CA. Thus, consumers can choose suitable accessions according to their needs for minerals. Fruit accessions with the highest scores for fresh use were No.59, 64,43, CJ-1, 40, 19, 20, MLF, 47, and LD133. Some accessions such as No.34, 61, 16, 33, 22, 27, MLF, 49, 30, and LD133 were suitable for processing. In future research, we can combine the growth environment and high yield ofA. argutato further screen for high quality accessions to provide rich available resources for quality improvement, breeding and the resource development and utilization ofA. arguta.
Conflicts of interest
The authors declare that they have no known competing financial interests or personal relationships that could have appeared to influence the work reported in this paper.
Acknowledgments
This work was supported by Special Scientific Research Fund of Agricultural Public Welfare Profession of China [grant number 200903013]; and Liaoning Province, Shenyang Agricultural University, high-end talent introduction fund project [grant number SYAU20160003].
Appendix A. Supplementary data
Supplementary data associated with this article can be found in the online version, at http://doi.org/10.1016/j.fshw.2021.11.020.
- 食品科学与人类健康(英文)的其它文章
- Potential application of proteolysis targeting chimera (PROTAC) modification technology in natural products for their targeted protein degradation
- Effects of vegetarian diet-associated nutrients on gut microbiota and intestinal physiology
- Recent progress in preventive effect of collagen peptides on photoaging skin and action mechanism
- Perspectives on diacylglycerol-induced improvement of insulin sensitivity in type 2 diabetes
- Effect of bacteriocin-producing Pediococcus acidilactici strains on the immune system and intestinal flora of normal mice
- A new Lactobacillus gasseri strain HMV18 inhibits the growth of pathogenic bacteria