
The Structure and Formation Mechanism of a Sea Fog Event over the Yellow Sea
2015-03-31 08:41GUOJingtianLIPengyuanFUGangZHANGWeiGAOShanhongandZHANGSuping
GUO Jingtian, LI Pengyuan, FU Gang, *, ZHANG Wei, GAO Shanhong, and ZHANG Suping
The Structure and Formation Mechanism of a Sea Fog Event over the Yellow Sea
GUO Jingtian1), LI Pengyuan2), FU Gang2), *, ZHANG Wei1), GAO Shanhong2), and ZHANG Suping2)
1),,,266033,2),,,266100,
In this paper, a heavy sea fog event occurring over the Yellow Sea on 11 April 2004 was investigated based upon observational and modeling analyses. From the observational analyses, this sea fog event is a typical advection cooling case. Sea surface temperature (SST) and specific humidity (SH) show strong gradients from south to north, in which warm water is located in the south and consequently, moisture is larger in the south than in the north due to evaporation processes. After fog formation, evaporation process provides more moisture into the air and further contributes to fog evolution. The sea fog event was reproduced by the Regional Atmospheric Modeling System (RAMS) reasonably. The roles of important physical processes such as radiation, turbulence as well as atmospheric stratification in sea fog’s structure and its formation mechanisms were analyzed using the model results. The roles of long wave radiation cooling, turbulence as well as atmospheric stratification were analyzed based on the modeling results. It is found that the long wave radiative cooling at the fog top plays an important role in cooling down the fog layer through turbulence mixing. The fog top cooling can overpower warming from the surface. Sea fog develops upward with the aid of turbulence. The buoyancy term,, the unstable layer, contributes to the generation of TKE in the fog region. However, the temperature inversion layer prevents fog from growing upward.
sea fog; the Yellow Sea; developing mechanism
1 Introduction
Sea fog is often a deadly impediment to oceanic navigation (Trémant, 1987), and is frequently observed over the Yellow Sea (hereafter YS) and around the Korean Peninsula coasts in spring and summer (Wang, 1985; Zhou and Liu, 1986; Cho, 2000; Fu, 2006, 2010; Kim and Yum, 2012; Li, 2011; Li and Zhang, 2013). Sea fog study for the eastern Asian area only emerged in the middle of the twenties (Wang, 1948), whereas in western countries, sea fog has been studied as early as in the beginning of twentieth (Taylor, 1917). Generally, sea fog over the YS is the advection cooling fog (Wang, 1985; Zhou and Liu, 1986; Fu, 2004a, 2006; Gao, 2007; Zhang, 2009; Kim and Yum, 2011), in which the warm and moist air is brought by the southerlies from the south of East China Sea to the YS where the sea surface temperature (SST) is usually colder than that of the southern seas. Thus, the fog is formed when the air is cooled down below its dew-point and reaches saturation.
Previous studies have indicated that weak winds, stable atmospheric conditions and continuous supply of moist air are necessary conditions for the sea fog formation over the YS (Wang, 1985). Zhou and Liu (1986) indicated that 80 percent of sea fog over the YS is advection cooling fog. Cho(2000) documented historical data of sea fog and investigated the relationship between the environmental factors and sea fog occurrence around the Korean Peninsula (including the YS). Fu(2004b) provided a comprehensive view of the nature of sea fog over the YS by describing climate characteristics such as the duration and dissipation of sea fog, and the seasonal and daily variations of sea fog. In addition, Zhou(2004) explored the oceanic features and synoptic conditions during the spring fog season over the YS.
Recent years, a series of work has been conducted on sea fog over the YS and other seas by using state-of-the-art numerical modeling systems (Ballard, 1991; Koračin and Dorman, 2001; Koračin, 2005; Fu, 2006; Gao, 2007; Fu, 2008; Zhang, 2009; Fu, 2010). Koračin(2005) identified the roles of radiation cooling, advection, surface heat flux, and en- trainment in a fog case along the California coastal waters from 14 to 16 April 1999 by using a three-dimensional model. Fu(2006) investigated a heavy sea fog case of 11 April 2004 by using observational data and the modeling results of the Regional Atmospheric Modeling System (RAMS). It was shown that this sea fog event was caused mainly by advection cooling effect. Gao(2007) successfully employed the Fifth-generation Pennsylvania State University/National Center for Atmospheric Research Mesoscale Model (MM5) to reproduce a spring fog case over the YS and found that turbulence mixing was the primary mechanism for the cooling and moistening of the marine layer. Zhang(2009) indicated that the Yellow Sea fog season is characterized by an abrupt onset in April in the southern coast of the Shan- dong Peninsula and an abrupt, basin-wide termination in August. They investigated the mechanisms for such step-like evolution of the YS fog season by using the Weather Research and Forecasting (WRF) modeling results.
Although some typical sea fog cases (Koračin and Dorman, 2001; Fu, 2006; Gao, 2007; Fu, 2010) and the large-scale meteorological factors, such as surface anticyclones (Zhang, 2011), marine boundary layer structure (Kim and Yum, 2011) have been investigated based upon observational data and modeling results, issues related to various aspects of sea fog still remain, especially to the roles of turbulence, long wave radiation as well as the underlying sea surface (Gultepe, 2007). Kim and Yum (2011) mentioned that radiative cooling rather than turbulence seems to be critical in the eventual formation of cold sea fog cases (air temperature minus (T) sea surface temperature (SST) larger than 0,, T-SST>0) off the west coast of the Korean Peninsula based on the observational analysis. Turbulence and radiation cooling make opposite contributions to the heat and moisture budget of the air. However, in specific sea fog cases, T-SST may vary differently. The sea fog case occurring over the YS on 11 April 2004 was investigated and it was found that the T-SST showed different phases during the formation period,, before fog formation, T-SST>0, while during fog development, T-SST<0.
The main purpose of the present study is to quantitatively investigate these physical processes, including radiation, turbulence, and atmospheric stratification, in order to understand their roles in influencing sea fog structure and its formation mechanism. The paper is organized as follows. The data is introduced in Section 2. Section 3 presents a brief overview of the fog event and observational analyses. Section 4 describes the modeling and verification. The structure and formation mechanism of this sea fog event is discussed in Section 5. Conclusion and discussion will be given in Section 6.
2 Data
The data used in the present study are as follows. (1) 6-hourly (00, 06, 12, 18 UTC①) 1.25˚×1.25˚grid reanalysis data (Onogi, 2007) issued by Japan Meteorological Agency (JMA). The variables used in the present RAMS modeling are the zonal and meridional wind, air temperature, dew point temperature, geopotential height at 1000, 925, 850, 700, 500, 400, 300, 250, 200, 150, 100hPa, respectively. (2) The skin temperature of Final Ana- lyses (FNL) data from 18 UTC 10 to 00 UTC 12 April 2004 which can be downloaded from the web http://dss.ucar.edu/datasets/ds083.2/data/fnl-200404/ issued by the National Centers for Environmental Prediction (NCEP). (3) Geostationary Operational Environmental Satellite (GOES)-9 satellite image at 02 UTC 11 April 2004 down- loaded from the web http://weather.is.kochi-u.ac.jp at the Kochi University of Japan. (4) Sea Surface Temperature (SST) and air temperature observed at 5 coastal stations in the YS and Bohai Sea region from 12 UTC 9 to 12 UTC 12 April 2004. (5) Sounding profiles from 12 UTC 10 to 00 UTC 12 April 2004 downloaded from the web of http://weather.uwyo.edu/upperair/sounding.html at the Uni- versity of Wyoming. JMA and FNL data are used as the initial and boundary conditions for RAMS modeling. Data (4) and (5) are used for observational analyses and modeling verification.
3 Case Overview and Observational Analyses
3.1 Case Overview
From 11 to 13 April 2004,a heavy sea fog event was observed over the YS. As shown in GOES-9 satellite image (Fig.1), the YS and its western coastal areas were influenced by this sea fog episode. The fog patch spread several tens of kilometers into the Shandong Peninsula and lasted about 20 hours, reducing the atmospheric horizontal visibility to several tens of meters on a coastal stretch of a major highway and leading to a series of traffic collisions. Its evolutionary process has been documented by Fu(2006) by using GOES-9 visible images.
3.2 Observational Analyses
The southerlies associated with the Northwestern Pacific high pressure system (NPH) centering around (30˚N, 140˚E) during the onset period prevailed over the YS (Fig.2). The maximum air-sea temperature difference (surface air temperature minus SST, SAT-SST) is about 4℃ located in the northern part of the YS. The specific humidity (SH) is larger in the south than that in the north. The SH is about 5 to 6gkg−1 in the fog region at 00 UTC 10 April 2004. The distribution of SAT-SST, specific humidity and wind are typical for the advection cooling fog which was previously identified by Wang (1985), Fu et al. (2006) and Li et al. (2011).
Fig.3 shows the evolution of SST and air temperature (AT) at 5 coastal stations, from south to north, Rizhao (RZ), Qingdao (QD), Qianlianyan (QY), Chengshantou (CT), Dalian (DL). The shaded area denotes the atmospheric visibility less than 1km, which indicates fog. The atmospheric visibility data are only available at QD, CT, and DL stations. During most of this period (18 UTC 09 to 12 UTC 12 April), AT showed a decreasing trend for all the stations. The air temperature dropped about 7.4℃ during this period at CT, which is the largest decrease among these five stations. During the period (18UTC 09 to 00 UTC 11), the air temperature dropped about 4.6℃, 3.3℃, 2.5℃, 4.8℃, 1℃ at RZ, QD, QY, CT, DL stations, respectively. SST is warmer in the southern area than that in the northern area. SST varied little during the fog episode and showed a 5℃ south-north gradient. During the onset period of this fog event, SST is colder than AT, which is identified in Fig.2. The configuration of SST is favorable for advection cooling fog formation (Wang, 1985; Fu, 2006). It is noteworthy that AT is colder than SST at these stations sometime after fog formation except for DL station. Turbulence exchange due to the fog top radiation cooling may contribute to the air temperature cooling. The radiation effect on fog formation mechanism will be illustrated in Section 5. The satellite image (Fig.1) showed that the edge of the fog patch reached DL station, whereas the atmospheric visibility observed at DL station was larger than 1km during the whole fog episode.
4 Modeling Design and Verification
4.1 RAMS Modeling
RAMS is a non-hydrostatic, compressible equation model using a rotated polar-stereographic projection in the horizontal grid, where the pole of the projection is rotated to an area near the center of the domain, thus minimizing the distortion of the projection in the main area of interest (Cotton, 2003). A 36-h simulation of this sea fog event initialized at 12 UTC 10 April 2004 is conducted by using the RAMS version 4.4. In this simulation, the domain center and the rotated pole point are located at (125˚E, 35˚N) with the horizontal resolution 6km×6km, and horizontal 240×240 grid points. Theσterrain-following coordinate system is used in the vertical structure of the grid (Gal-Chen and Somerville, 1975; Clark, 1977; Tripoli and Cotton, 1982). 40σlevels are employed in the simulation with a high-resolution below 850hPa (20 levels). The domain covers the area of 115.6˚–130.4˚E, 29.6˚–42.1˚N (Fig.1). JMA grid data are used as the initial and boundary conditions. All available sounding data are assimilated to improve the initial and boundary conditions. FNL skin temperature data is used as the surface temperature data with 6 hourly update. The microphysics scheme accounting for each form of condensate (, cloud, rain, snow, crystal, hail, aggregate and ice water) is adopted in this simulation (Walko, 1995, particle number of cloud droplets is selected to be 3×10⁸kg−1). Sea fog typically happens under high pressure system without deep convection. Hence, the cumulus parameterization scheme is not used in the simulation. The short wave scheme proposed by Chen and Cotton (1983), and the long wave radiation scheme developed by Harrington (1997) are employed. The turbulent kinetic energy parameterization scheme developed by Mellor and Yamada (1982) is used in the simulation.
4.2 Verification
In order to verify the modeling results, the observed relative humidity, atmospheric horizontal visibility and air temperature at QD, DL and CT stations are compared with the modeling results. From Figs.4a–c, it can be seen that the simulated relative humidity at QD, DL and CT agrees reasonably well with the observations. The simulated atmospheric horizontal visibility is calculated based upon the following formula proposed by Stoelinga and Warner (1999):

whereis the threshold of contrast and equal to 0.02,is the extinction coefficient,144.7(LWC)0.88(Kunkel, 1984), where LWC is Liquid Water Content (kgm−3). In fact, LWC is the product of mixing ratio of cloud water (kgkg−1) and air density (kgm−3). Hence, if there is no cloud, the simulated atmospheric horizontal visibility (SV) will be infinite due to144.7(LWC)0.88≈0. In the present study, the calculated atmospheric horizontal visibility is within the range of 0–3km. It can be seen that at QD station (Fig.4a) the observed atmospheric horizontal visibil-ity (OV) was close dropped rapidly to 0km from 17 to 18 UTC 10 April, and lasted during the next period. The evolution of the SV showed that dense fog (, atmospheric horizontal visibility below 1km) appeared about 1 hour later, and disappeared 2h earlier. At CT station (Fig.4b), the SV (below 1km) showed appeared 5h later than the observation. No fog appeared at DL station (Fig.4c) for both OV and SV. Judging from the station observations, it can be inferred that the fog would make it appearance later than the observations about 1-hour and 5-hour at QD and CT, respectively. The simulated relative humidity shows good agreement with observations. Figs.4d–f show the evolution of temperature at QD, CT,DL, respectively. One can see that the air temperature trend is similar between the observed and the simulated. The temperature difference between the observed and the simulated is within the range of 0–3℃, except for 03 UTC 11 April 2004 at CT the temperature difference is about 8℃. The observed temperature had a big jump at 03 UTC 11, which may be due to instrument error. By comparing the air temperature profiles at QD, DL and CT stations (Figs.5a–c), temperature difference between observations and simulation results varies from 1 to 2℃. At three stations, at the low atmosphere level, there existed an inversion layer. It was reproduced by RAMS model reasonably well in terms of the top height and the intensity of the inversion layer. The cloud liquid water path (LWP)is calculated in the following way:
, (2)
whereis air density. Figs.6a–e show the evolution of the LWP of the sea fog event from 00 to 08 UTC 11 April 2004. Compared with the satellite images (Fu, 2006), the simulated fog patch is smaller than that of the satellite images at 02 UTC, 04 UTC and 06 UTC. The timing of fog appearance is appropriate. Based on the analysis, the RAMS model is able to predict the general behavior of the sea fog event. Consequently, model results can be used for investigating the structure and formation mechanism of the sea fog event as discussed in the following sections.

Fig.3 Time evolutions of SST (in℃, solid line) and air temperature (AT, in℃, dashed line) at (a) RZ, (b) QD, (c) QY, (d) CT, (e) DL from south to north (locations shown in Fig.1) from 18 UTC 09 to 12 UTC 12 April 2004 (LST=UTC+8h). SST observation is of 6-hour interval except for 18 UTC at these 5 stations. Shaded area denotes ‘fog’ in terms of the time of visibility ≤1km at QD and CT stations.

Fig.4 Comparisons between observed relative humidity (RH, solid line with plus sign), atmospheric horizontal visibility (solid line with closed circle) and simulated RH (dash line with plus sign), atmospheric horizontal visibility (dash line with closed circle) at 10m altitude at (a) QD, (b) CT, (c) DL stations from 12 UTC 10 to 06 UTC 11 April 2004. (d)–(f) same as (a)–(c) respectively but for air temperature.
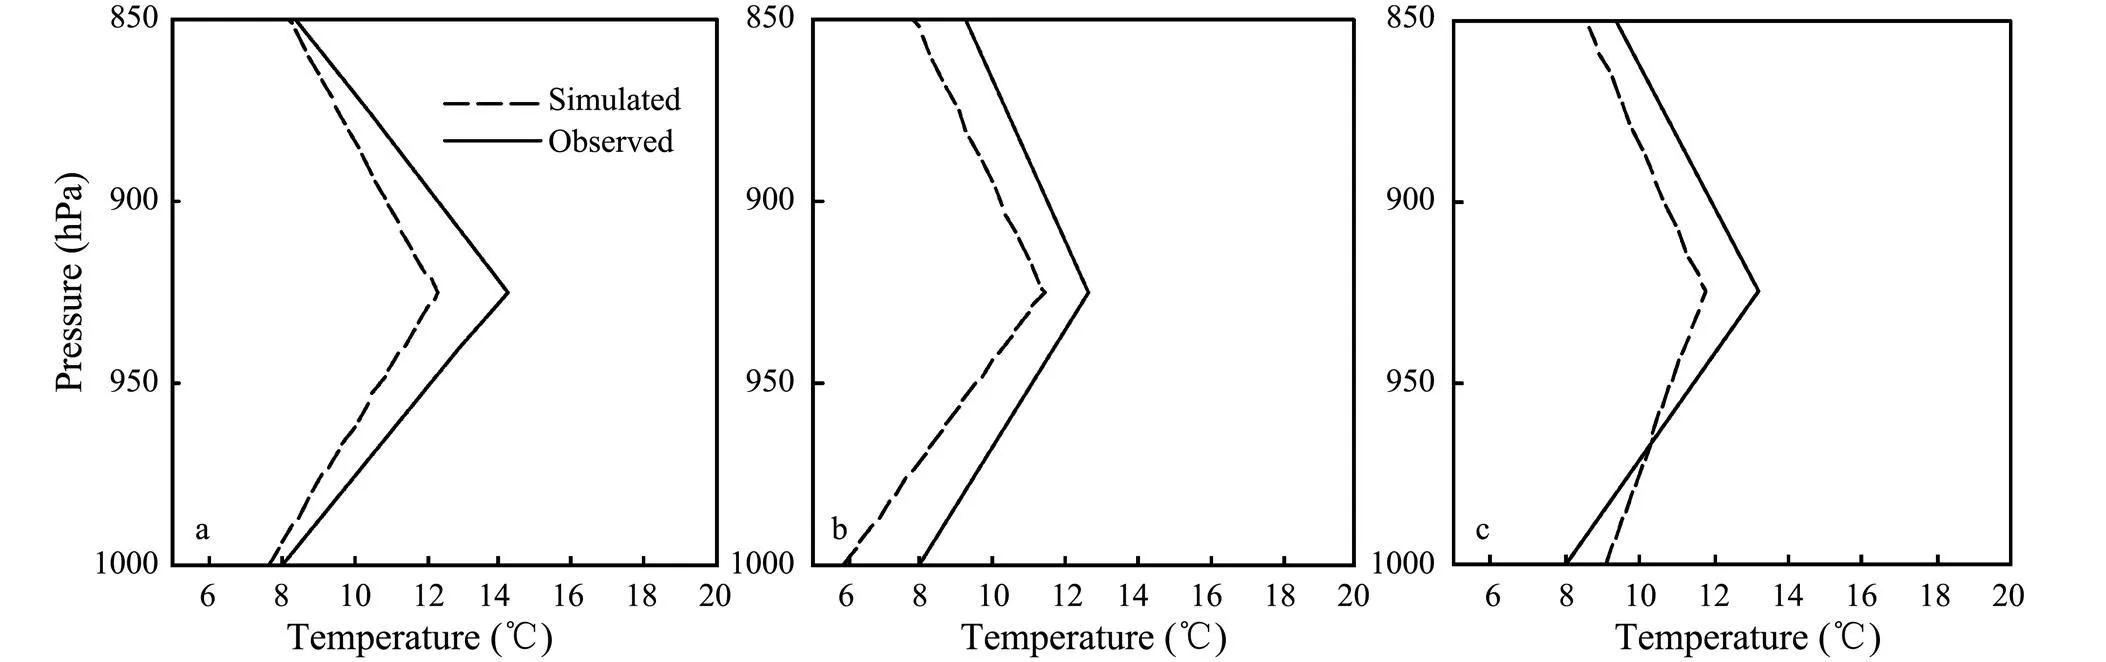
Fig.5 Comparison between simulated (dashed) and observed (solid) air temperature (℃) profiles at (a) QD, (b) CT, (c) DL at 00 UTC 11 April 2004.

Fig.6 Time evolution of the simulated LWP (shaded, in kgm−2) at (a) 00 UTC, (b) 02 UTC, (c) 04 UTC, (d) 06 UTC, (e) 08 UTC 11 April 2004.
5 The Structure and Formation Mechanism
Fig.7 shows the distribution of the simulated mixing ratio of cloud water (q, which represents sea fog in modeling) at 10m altitude at 01 UTC 11 April 2004. It clearly shows that the sea fog covers the sea areas of south and east of the Shandong Peninsula. The region ofq>0.9gkg−1is located at the lower southern section of the sea fog. From the simulated cross section profile (Figs.8a–d), it can be seen that the bottom of the temperature inversion layer is low in the south and high in the north and the intensity of the temperature inversion layer is enhanced during this period. Meanwhile, the fog layer is suppressed. There is no temperature inversion layer over land. In Figs.8b–d, the region ofq>0.9gkg−1is located near the sea surface and the fog top is only about 50m in the southern section (35˚–35.5˚N), the region ofq>0.6gkg−1is located near the fog top and the fog top reaches 300m in the northern section (36˚–36.7˚N). On the other hand, the long wave radiation cooling rate reaches a maximum of 10×10−4Ks−1near the surface around 35.4˚N at 02 UTC 11 (Fig.8c). The maximum core of the radiation cooling rate coincides with the large value center ofqin Figs.8a–d. Note that the radiation cooling rate almost occurs near the fog top. The radiative cooling effect is gradually weakened as the inversion layer gradually intensifies. The intensity of the inversion layer plays an important role in the fog formation and development. It is verified by sensitivity tests conducted by Koračin and Dorman (2001) that there is an optimal inversion strength favorable to fog formation.
Simulated wind speed is about 2 to 4ms−1 in the fog layer as well as in the cross section area (Fig.9). Weak wind is favorable for fog formation. The prevailing wind is primarily southerlies during this period (figure not shown). Virtual potential temperature also shows the weak inversion layer over the fog layer as well as the southern area. The vertical exchange of air is limited by the weak stable layer.
Fig.10 is the time evolution of simulated mixing ratio of cloud water, air-sea temperature difference, radiation heating rate, as well as sensible and latent heat flux from 12 UTC 10 to 06 UTC 11 April 2004. It can be seen from Fig.10a that the dense fog (q>1gkg−1) appears after 23 UTC 10, and then rapidly develops southward in the next 5h. At 05 UTC 11, the fog area almost reaches 34˚N and the air-sea temperature difference is above 3℃ around 35˚N. According to the observations in Fig.3, there was little variation of SST among these 5 coastal stations. It can be inferred that the air temperature decreases about 3K during this period. Meanwhile, the sensible and latent heat flux increase by about 7–8Wm−2. These results suggest that evaporation process favors the southward development of this fog patch. The long wave radiative cooling rate reaches about 8Ks−1. The relative humidity in the fog region is larger than 99% and there is no turbulence in south of 35˚N during this period (figure not shown). It suggests that near surface long wave radiative cooling effect plays an important role in stabilizing the near surface layer and cooling the fog.
The cross section analyses of Richardson’s number, turbulent kinetic energy (TKE), the stability of atmospheric stratification ∂θ/∂, and the vertical wind shear ∂/∂along the line AB are shown in Fig.11. Richardson’s numbercan be used to qualitatively evaluate the contributions of the buoyancy term and vertical wind shear to the turbulence development. The Richardson number is calculated by using the following formula:

The vertical wind shear is calculated using the following formula:
.
It is shown from Fig.10a that Ri is larger than 0.25 near the sea surface from 35˚–36˚N at 22 UTC 10 April, which is not favorable for the turbulence generation and the air-sea heat exchange, whereas around 33˚–34˚N and 36˚–36.5˚N,is less than 0.25 and 0, respectively. Consequently, turbulence is generated mainly due to wind shear around 33˚–34˚N (Fig.11c). Note that around 36˚–36.5˚N, there is little wind shear (Figs.11c, d). Turbulence is strongest at 100 m around 36˚–36.5˚N and TKE reaches 10×10−2m2s−2. Hence, the buoyancy term contributes to the generation of TKE due to<0 in this region,, the atmospheric layer is unstable. It is consistent with the aforementioned analysis that the radiative cooling of fog top around 36˚N makes the layer unstable and hence, TKE increases. At 00 UTC 11 April,is smaller than 0.25 around 35˚N near the sea surface, which is in favor of the production of turbulence (Fig.11b). Around 36˚–36.5˚N, the area of<0 is enlarged. Consequently, TKE increases. Fog develops upward at this time with the aid of the enhanced turbulence (Fig.8b). The analyses suggested that the TKE increase region and<0.25 region match well during the fog formation process and turbulence is created mainly due to both the wind shear with no fog appearance and the unstable layer with fog appearance. It can be inferred that long wave radiative cooling effect plays an important role in the fog growth, especially in vertical extension. The long wave radiative cooling effect makes the fog layer unstable and cools down the fog layer due to the turbulence mixing. However, due to the existence of the inversion layer, fog cannot break through the lid. Fog is confined to the bottom of the inversion layer (Fig.8). It is also confirmed that the inversion layer prevents the fog from growing upward.

Fig.8 Cross section analyses of simulated mixing ratio of cloud water (in gkg−1, shaded), radiation heating rate (10−4Ks−1, solid line), and air temperature (in ℃, dash line) along the line AB at (a) 22 UTC 10, (b) 00 UTC 11, (c) 02 UTC 11, (d) 04 UTC 11 April 2004. Fog top (mixing ratio of cloud water =0.05gkg−1) is indicated by the dotted line.

Fig.9 Cross section analyses of simulated mixing ratio of cloud water (in gkg−1, shaded), virtual potential temperature (in K, solid line), and wind speed (in ms−1, dash line) along the line AB at (a) 22 UTC 10, (b) 00 UTC 11, (c) 02 UTC 11, (d) 04 UTC 11 April 2004. Fog top (mixing ratio of cloud water =0.05gkg−1) is indicated by the dotted line.

Fig.10 Time evolution of mixing ratio of cloud water (in gkg−1, shaded) and (a) air temperature minus SST (in℃, contour), (b) radiation heating rate (in 10−4Ks−1, contour), (c) sensible heat flux (in Wm−2, contour), (d) latent heat flux (in Wm−2, contour) at 10m altitude in the RAMS modeling from 12 UTC 10 to 06 UTC 11 April 2004.

Fig.11 Cross section analyses of Richardson’s Number Ri (shaded) and turbulent kinetic energy (in 10−2m2s−2, contour) along the line AB at (a) 22 UTC 10, (b) 00 UTC 11 and the vertical wind shear (in 10−2s−1, shaded) and the vertical gradient of θv (in 10−2Km−1, contour) at (c) 22 UTC 10, (d) 00 UTC 11 April 2004.
6 Discussion and Conclusion
A heavy sea fog event occurring over the YS on 11 April 2004 is investigated observationally and numerically in the present study. The RAMS model owns the capacity to predict the general features of this event. The roles of important physical processes such as radiation, turbulence as well as atmospheric stratification in sea fog’s structure and its formation mechanisms have been analyzed using the model results.
It can be concluded that the transportation of warm and moisture air from the south provides favorable conditions for the sea fog formation. There exists a strong gradient of SH and SST from south to north. The specific humidity (SH) is larger in the south than that in the north. The SH is about 5 to 6gkg−1 in the fog region at 00 UTC 10 April 2004. SST varies little during the fog episode and shows a 5℃ south-north gradient. The maximum air-sea temperature difference (SAT-SST) is about 4℃ in the northern part of the YS during the fog onset period, which is a favorable condition for fog formation, this agrees well with previous researchers’ work (Wang, 1985; Fu et al., 2006; Gao et al., 2007). After fog formation, the air temperature drops dramatically about 3K and is lower than SST. Hence, during this period, evaporation process will provide more moisture into the air and further contribute to fog evolution.
Through the formation mechanism analysis of this sea fog event, it is suggested that the radiative cooling at the fog top plays an important role in cooling down the fog layer and generating turbulence. The fog layer is cooled down through turbulence mixing. The fog top cooling can overpower the warming from the surface and the near surface weak unstable layer contributes little to the TKE generation. Sea fog develops vertically mainly due to the generation of TKE. TKE is generated by the unstable layer around fog region and by the wind shear around fog-free region. However, due to the existence of the inversion layer, fog cannot penetrate through the bottom of the inversion layer with the aid of TKE. As the inversion layer intensified, the fog was gradually weakens.
The present study depicts the formation mechanism of a sea fog event in terms of radiation and turbulence. However, advection and evaporation/condensation also contribute to fog evolution. In our study, we have not take into account advection in fog formation mechanism. The role of the advection remains uncertain in our study and is needed to be clarified in the future. Based on our knowledge, this term for the case under consideration (advection cooling fog) is mainly responsible for transporting warm/moisture air to the YS areas. The transported air was then cooled by the underlying sea surface and fog forms. Evaporation/condensation processes do enter into our study. The quantitative effect of these terms was not investigated in this study and we hope the role of these terms will be studied thoroughly in our following case studies. Issues related to fog formation mechanism of sea fog over the YS still remain, such as the formation mechanism of the inversion layer and the effect of the modification of the inversion layer on sea fog’s life. We have conducted some numerical experiments on the formation mechanism of the inversion layer and will further explore the problem.
Acknowledgements
This paper ispart of the first author’s Ph.D thesis submitted to Ocean University of China in 2008. J. Guo was supported by the 201205010-5 program of the State Oceanic Administration of China and the Natural Science Foundation of China under the grant 41306028. G. Fu was partly supported by the National Natural Science Foundation of China under the grant number, 406750060 and 41275049, the Chinese Ministry of Science and Technology under the 863 Project grant number 2006AA09Z151, and the Chinese Meteorological Administration under the grant number GYHY(QX)200706031. P. Li would like to express his sincere thanks to the China Scholarship Council for the financial support to his study in NOAA from 2008 to 2010, which enables him to participate in the present work.P. Li was supported by China postdoctoral funding under the grant 2012M511545 and the Natural Science Foundation of China under the grant 41305086. This work was also supported by the open project of the Lab. of Physical Oceanography, Ocean University of China. Special thanks go to Dr. Shan Sun from Earth System Research Laboratory of NOAA for her kind improvement of the English.
Ballard, S., Golding, B., and Smith, R., 1991. Mesoscale model experimental forecasts of the haar of northeast Scotland,119: 2107-2123.
Chen, C., and Cotton, W., 1983. A one-dimensional simulation of the stratocumulus-capped mixed layer, 25: 289-321.
Cho, Y., Kim, M., and Kim, B., 2000. Sea fog around the Korean Peninsula., 39:2473-2479.
Clark, T., 1977. A small-scale dynamic model using a terrain-following coordinate transformation, 24: 186-215.
Cotton, W., Pielke, R., Walko, R., Liston, G., Tremback, C., Jiang, H., McAnelly, R., Harrington, J., Nicholls, M., Carrio, G., and McFadden, J., 2003. RAMS 2001: Current status and future direction, 82: 5-29.
Fu, G., Guo, J., Angeline, P., and Li, P., 2008. An analysis and modeling study of a sea fog event over the Yellow and Bohai Sea, 7: 27-34.
Fu, G., Guo, J., Xie, S., Duan, Y., and Zhang, M., 2006. Analysis and high-resolution modeling of a dense sea fog event over the Yellow Sea, 81: 293-303.
Fu, G., Li, P., Crompton, J., Guo, J., Gao, S., and Zhang,S., 2010. An observational and modeling study of a sea fog event over the Yellow Sea on 1 August 2003, 107: 149-159.
Fu, G., Wang, J., Zhang, M., Guo, J., Guo, M., and Guo, K., 2004a. An observational and numerical study of a sea fog event over the Yellow Sea on 11 April 2004, 34: 720-726 (in Chinese with English abstract).
Fu, G., Zhang, M., Duan, Y., Zhang, T., and Wang, J., 2004b. Characteristics of sea fog over the Yellow Sea and the East China Sea., 38: 99-108.
Gal-Chen, T., and Somerville, J., 1975. On the use of a coordinate transformation for the solution of the Navier-Stokes equations.ics, 17: 209-228.
Gao, S., Lin, H., Shen, B., and Fu, G., 2007. A heavy sea fog event over the Yellow Sea in March 2005: Analysis and numerical modeling., 24:65-81.
Gultepe, I., Tardif, R., Michaelides, S. C., Cermak, J., Bott, A., Bendix, J., Muller, M. D., Pagowski, M., Hansen, B., Ellrod, G., Jacobs, W., Toth, G., and Cober, S. G., 2007. Fog research: A review of past achievementsand future perspectives., 164: 1121-1159.
Harrington, J., 1997. The effects of radiative and micro-physical processes on simulated warm and transition season Arctic stratusPhD thesis. Atmospheric Science Paper No. 637, Colorado State University, Department of Atmospheric Science, Fort Collins, 289pp.
Kim, K., and Yum, S., 2011. Marine boundary layer structure for the sea fog formation off the west coast of the Korean Peninsula., DOI: 10.1007/s00024-011-0325-z.
Kim, K., and Yum, S., 2012. A numerical study of sea-fog formation over cold sea surface using a one-dimensional turbulence model coupled with the Weather and Forecasting Model., 143: 481-505.
Koračin, D., and Dorman, C., 2001. Marine atmospheric boundary layer divergence and clouds along California in June 1996., 129: 2040-2055.
Koračin, D., Businger, J., Dorman, C., and Lewis, J., 2005. Formation, evolution, and dissipation of coastal sea fog, 117: 447-478.
Kunkel, B., 1984. Parameterization of droplet terminal velocity and extinction coefficient in fog models, 23: 34-41.
Li, M., and Zhang, S., 2013. Impact of sea surface temperature front on stratus-sea fog over the Yellow and East China Seas–A case study with implications for climatology., 12: 301-311.
Li, P., Fu, G., and Lu, C., 2011. Large-scale environmental influences on the onset, maintenance, and dissipation of six sea fog cases over the Yellow Sea.ics, DOI: 10.1007/s00024-011-0348-5.
Mellor, G., and Yamada, T., 1982. Development of a turbulence closure model for geophysical fluid problems, 20: 851-875.
Onogi, K., Tsutsui, J., Koide, H., Sakamoto, M., Kobayashi, S., Hatsushika, H., Matsumoto, T., Yamazaki, N., Kamahori, H., Takahashi, K., Kadokura, S., Wada, K., Kato, K., Oyama, R., Ose, T., Mannoji, N., and Taira, R., 2007. The JRA-25 reanalysis., 85: 369-432.
Stoelinga, M., and Warner, T., 1999. Nonhydrostatic, mesobeta-scale model simulations of cloud ceiling and visibility for an east coast winter precipitation event., 38:385-404.
Taylor, G., 1917. The formation of fog and mist, 43: 241-268.
Trémant, M., 1987. La Prévision du brouilliard en mer, Meteorologie Maritime et Activies, WMO. 20, 127pp.
Tripoli, G. J., and Cotton, W. R., 1982. The Colorado State University three-dimensional cloud/mesoscale model-1982. Part I: General theoretical framework and sensitivity experiments., 16: 185-220.
Walko, R., Tremback, C., Pielke, R., and Cotton, W., 1995. An interactive nesting algorithm for stretched grids and variable nesting ratios, 34: 994-999.
Wang, B., 1948. Qingdao weather, 35-38 (in Chinese with English abstract).
Wang, B., 1985.China Ocean Press, 330pp.
Zhang, S., Liu, J., Xie, S., and Meng, X., 2011. The formation of a surface anticyclone over the Yellow and East China Seas in Spring., 89: 119-131.
Zhang, S., Xie, S., Liu, Q., Yang, Y., Wang, X., and Ren, Z., 2009. Seasonal variations of Yellow Sea fog: Observations and mechanism, 22: 6758-6772.
Zhou, F., and Liu, L., 1986. Comprehensive survey and research report on the water areas adjacent to the Changjiang River estuary and Chejudo island marine fog, 16: 114-131 (in Chinese with English abstract).
Zhou, F., Wang, X., and Bao, X., 2004. Climatic characteristics of sea fog formation of the Huanghai Sea in spring, 26: 28-37 (in Chinese with English abstract).
(Edited by Xie Jun)
① Local Standard Beijing Time=UTC+8h.
DOI 10.1007/s11802-015-2466-7
ISSN 1672-5182, 2015 14 (1): 27-37
© Ocean University of China, Science Press and Springer-Verlag Berlin Heidelberg 2015
(August 28, 2013; revised October 28, 2013; accepted July 1, 2014)
* Corresponding author. Tel: 0086-532-66782808 E-mail: fugang@ouc.edu.cn
 Journal of Ocean University of China2015年1期
- Journal of Ocean University of China的其它文章
- The Influence of El Niño on MJO over the Equatorial Pacific
- Research on the Interannual Variability of the Great Whirl and the Related Mechanisms
- Brightness Temperature Model of Sea Foam Layer at L-band
- Parametric Instability Analysis of Deepwater Top-Tensioned Risers Considering Variable Tension Along the Length
- DPOI: Distributed Software System Development Platform for Ocean Information Service
- Nonlinear Contact Between Inner Walls of Deep Sea Pipelines in Buckling Process