
DPOI: Distributed Software System Development Platform for Ocean Information Service
2015-03-31 02:53GUOZhongwenHUKeyongJIANGYongguoandSUNZhaosui
GUO Zhongwen, HU Keyong, JIANG Yongguo, and SUNZhaosui
DPOI: Distributed Software System Development Platform for Ocean Information Service
GUO Zhongwen1), HU Keyong2), *, JIANG Yongguo1), and SUNZhaosui1)
1),,266100,..2),,266520,..
Ocean information management is of great importance as it has been employed in many areas of ocean science and technology. However, the developments of Ocean Information Systems (OISs) often suffer from low efficiency because of repetitive work and continuous modifications caused by dynamic requirements. In this paper, the basic requirements of OISs are analyzed first, and then a novel platform DPOI is proposed to improve development efficiency and enhance software quality of OISs by providing off-the-shelf resources. In the platform, the OIS is decomposed hierarchically into a set of modules, which can be reused in different system developments. These modules include the acquisition middleware and data loader that collect data from instruments and files respectively, the database that stores data consistently, the components that support fast application generation, the web services that make the data from distributed sources syntactical by use of predefined schemas and the configuration toolkit that enables software customization. With the assistance of the development platform, the software development needs no programming and the development procedure is thus accelerated greatly. We have applied the development platform in practical developments and evaluated its efficiency in several development practices and different development approaches. The results show that DPOI significantly improves development efficiency and software quality.
ocean information system; development platform; software customization; components
1 Introduction
Ocean observing is the fundamental approach for humans to increase their knowledge of oceans, which contributes to various fields of oceanographic research, such as improving understanding of climate change, en- hancing national security, and reducing public health risks. At present, great efforts have been made to meet a broad range of observing requirements. Projects such as Argo(Pouliquen., 2010; Goni., 2010; Smith., 2010) reveal that ocean observing is evolving into a global and long-term trend. Many regional OISs (Moltmann., 2010; Proctor., 2010; Seim., 2009)have been deployed to obtain the observations on regional scales.
Conceptually, an OIS is composed of hardware and software parts. The hardware part refers to a wide variety of instruments that are often equipped on specific survey platforms. The instruments sample ocean phenomena and represent them in the form of numbers. The software part consists of a suite of applications and tools, which are responsible for acquiring measurements from instruments, preserving them in a database, analyzing them according to specific algorithms and delivering the results to end users. With the rapid development of instrument and sensor technology, the need for cost-efficient software applications to support ocean information processing has increased.
However, practical developments often suffer from low development efficiency and poor software quality, re- sulting from insufficient development capabilities. The problems could be summarized as follows: first, demand analysis and software design are complicated in company with dynamic requirements. Second, programming and testing are very time consuming. The procedure has to be iterated after bugs are detected in the testing process. In addition, the developers have to master several program- ming languages and a complete knowledge of various formats of ocean data. Third, reusability and scalability are not enabled in the development process. Similar functional modules are hardly reused due to a monolithic development mode. The impact on the applications because of the addition of new functions is not mitigated. Finally, the systems are hard to maintain and update due to a nonstandard development mode. Maintenance costs are often the highest portion of the total development costs since the modularization is not adopted.
Most previous work focuses on data management (de La Beaujardière., 2010; Fletcher., 2008), es- pecially data exchange such as NetCDF-CF conventions (Hankin., 2010). Few work has discussed how to simplify OIS software developments. In (O’Reilly., 2004), a standard software interface is defined to enable uniform access to instruments. Method invocations are translated into specific instrument protocols by instrument services. New instruments can be added without the need of any client modifications. NWIS web services (Goodall., 2008) that are developed to share hydrologic data openly can be applied to other hydrologic databases. In (Horsburgh., 2009), ODM tools are developed to assist the manager to load data and manage them, but it is very hard to integrate them into other systems since few Application Programming Interfaces (APIs) are provided. This kind of work mostly contributes to particular aspects of OIS developments. In this paper, the requirements that should be satisfied in different development phases of OISs are generalized. Then, a Distributed Software Sys- tem Development Platform for Ocean Information Ser- vice (DPOI), is built to provide technical support to OIS developers. Leveraging DPOI, OISs on the regional and integrated scales can be established efficiently. Generally speaking, the advantages of DPOI could be described as follows:
1) The database is universal. It can unify the storage ofobservations from fixed and mobile surveys, and can accommodate the growing variables. The stored data as well as their metadata are syntactically homogeneous.
2) The development process is greatly simplified. The configuration toolkit is designed to turn the developments into configurations. The designer doesn’t need to master any programming language.
3) The data acquisition tools cover the data collection from instruments and files. The collection functions for existing instruments can be reused in the acquisition middleware, and the data loader can extract the data from files of various formats.
The remainder of this paper is organized as follows: In Section 2, a brief description of the requirements that are considered in DPOI design is given. In Section 3, DPOI structure is presented in detail, including design and implementation strategy. In Section 4, the development efficiency is validated through several development practices. Finally, the conclusions and plans for future work are proposed in Section 5.
2 DPOI Requirements
DPOI is used to assist the designer to accelerate the OIS development. Hence it should support all the fun- ctions from data acquisition to front-end application. In this section, we first generalize the common services that are required for OISs and then describe DPOI requirements that focus on improving the development efficiency of these services.
From the viewpoint of users, a set of services should be supported to facilitate users’ operations, including easy discovery, open access, and uniform viewing for desired data (Jones., 2009; Reed., 2010). Data discovery is used to locate data of interest. Users can specify geospatial and temporal extents, instrument information, specific parameter names or ‘free text’ to find which data are available. With the information in discovery results, users could know if the data is useful and then make access decisions. Data access provides reliable transport of real-time and delay-mode data. Uniform viewing is regarded as the capabilities of providing geo- and time- referenced graphics and tabular data to marine specialists and the general public. Besides, several fundamental ser- vices are indispensable, including data acquisition, data storage and data integration. The observations are collected through acquisition applications and stored into the database. For distributed OISs, data integration refers to aggregating the data together by transforming them consistently.
DPOI provides off-the-shelf resources to satisfy the OIS requirements. From the viewpoint of system designer, DPOI requirements should consider the reusability, customizability, scalability and interoperability in the development process. It is expected that the software modules that are developed time and again should be generalized and abstracted for future reuse. The constituent parts of DPOI should provide customization interface so that the designer can configure them according to specific user requirements. The instrument types and file formats can be specified in acquisition applications, and software interfaces can be configured in user applications. For scalability, the acquisition applications should support new instruments with little modifications; the database should be adaptive to include new variables; the user applications can add new functions with little impacts. Additionally, it is expected that OISs based on DPOI are interoperable, and the data distributed at multiple sources can be exchanged without difficulties and integrated seamlessly. Based on these requirements, DPOI continuously adjusts the structure of the constituent parts and evolves to provide sustainable development supports for future OIS developments.
3 DPOI Design
As shown in Fig.1, the platform provides acquisition middleware, data loader, component repository, web ser- vices and configuration toolkit to assist the development of OISs. Acquisition middleware acquires observations from instruments, while data loader extracts the data from files of various formats. Web services wrap the database with defined schemas and make the data from multiple sources consistent syntactically. Component repository is composed of functional components that are commonly used. Regional and integrated applications can be built through assembling the useful components with glue code. Configuration toolkit is responsible for configuring the parts that vary with the requirements. Besides, the complete documentation for DPOI is organized orderly, in which the service specifications are provided and the development procedure is illustrated clearly.

Fig.1 DPOI structure.
3.1 Database
We have designed the relational database for efficiently organizingobservation data and providing them to the applications. Observations from fixed and mobile survey platforms can be stored in a unified format. The database is able to accommodate incremental variables without the need of modifications. Fig.2 shows the database structure, in which the entities, their attributes and relationships are presented.
ObsRecord, Station and Variable tables are used to store the descriptive data (.., metadata) of fixed and mobile surveys. The general information of a survey is stored in ObsRecord table, in which the survey platform, organization and project can be referenced. The observing location information in the survey is stored into Station table. A fixed survey is described with one station, while a mobile survey corresponds to multiple stations. Varia- ble table stores all the variable information, in which a variable is defined as an ocean phenomenon of a location identified by a triple (latitude, longitude, depth). A profile in Profile table is regarded as a group of variables with different depths. The records, stations, profiles and variables are related hierarchically through foreign keys.
The database design supports data retrieval according to multiple conditions, including beginning time, ending time,organizations and projects in ObsRecord table, locations in Station table, platforms in SurveyPlatform table, instruments in Instrument table and variable types in VariableType table. Variable table can be reached from these tables directly or indirectly. Hence the desired variable data can be retrieved from ObservationData table according to VariableID attribute. Based on the database, data discovery with the above mentioned conditions can be realized in software applications.

Fig.2 Database structure.
The storage structure of the observation data is simple and general. As shown in Fig.3, traditional Observation Data table needs new columns to accommodate new vari- ables, which will increase data management complexity and result in modifications of the upper applications. By contrast, the current mechanism is flexible since new variables are inserted as new records to the Variable table, and the observation data of all the variables are stored in the consistent format. For avoiding the performance degradation when the table becomes too large, ObservationData table is fragmented into small tables by means of horizontal partitioning (Taniar., 2008), each of which is called a fragment. Once current fragments exceed the maximum record number, a new fragment will be created to store the values of new variables, while the succeeding values of existing variables are still stored in the current fragment to avoid cross-table retrieval. DataTable attribute of Variable table indicates the fragment in which its data are stored.
The database utilizes controlled vocabulary for explicit interpretation of the stored data. For example, two varia- bles ‘WaterTemp’ and ‘W_TEMP’ have the same stand- ard name ‘Water_Temperature’. Variable types are con- structed by referring to CF Standard Name Table (http:// cf-pcmdi.llnl.gov/documents/cf-standard-names/) and SE- ACOOS data dictionary (http://marinemetadata.org/references/ioosparameter). The other vocabularies such as organizations are regulated in accordance with the national standard GB/T 12460, in which their keys and values are enumerated. With the assistance of controlled vocabulary, the data from distributed sources can be used correctly. As DPOI evolves, the vocabulary will be complemented and enhanced.
The database structure is independent of physical implementation, so it could be built in different database management systems. For all the tables, data access functions are realized and assembled in advance for simplifying database operations. The developers could use these functions without knowing much about database programming.

Fig.3 Evolution of observation data structure.
3.2 Component Repository
DPOI adopts component-based technology (Lau., 2007) to facilitate software application developments. Regional and integrated applications are not developed from scratch, but built from existing components. As shown in Fig.4, the entire process consists of component stage and application stage. At component stage, compo- nent designer is responsible for designing new components according to new function requirements and injecting them to component repository; at application stage, component integrator obtains the available components from component repository and assembles them to the applications. Repository manager is responsible for centralized maintenance to the components, including authorized access to component documents and timely upgrade of component libraries.
Functional components are either built on the platform or provided by DPOI users. In the former case, we have designed time profile component for modeling the varia-tion trend of each variable over a period of time, vertical profile component for modeling the vertical variation trend of profile variables, variable correlation component for displaying the variation trend relation between two variables, tabular display component for presenting raw observation data to users in human-readable numeric ta- ble, data export component for supporting the data export in common file formats, rose diagram component for dis- playing statistics results of vector data over a period of time, and navigation map component for assisting users to locate the desired data. In the latter case, DPOI allows users to design additional components that implement functions they need and upload them to the repository. It is important to note that components should be designed following DPOI development documents, or else they are not able to be loaded and used correctly. All the compo- nents are configurable to satisfy dynamic requirements.

Fig.4 Component-based devleopment process.
Due to space constraints, we just present the detailed design of time profile component. The graphical window of the component includes three parts: the legend that displays the names and values of variables, the timeline that shows current time range and the subwindows that consist of at most four coordinates and variable curve area. The variables with the same type are generally placed in one coordinate for the convenience of comparison. Fig.5 illustrates a configuration scheme with two subwindows, seven coordinates and seven variables. The configuration method is described in configuration toolkit. Besides zooming and moving, the component provides five mark operations,.., InstantValue for displaying the values of variables at a timestamp, TimeDiff for giving the time difference between any two time points, KeyPoint for denoting a special point in the variation trend, TextLabel for adding the comments in specific locations and ValueDiff for computing the value difference of a variable during a time period.

Fig.5 User interface of time profile component.
3.3 Acquisition Middleware
The use of acquisition middleware as a stand-alone application is to efficiently relieve the impact caused by acquisition environment changes. It is designed to collect measurements from the instruments directly and provide data sequence following the structure (Time, VariableID, Value, QCFlag) to the upper applications. The measure- ments are acquired through communicating with instruments periodically. The communication operations including establishing connections, sending commands and retrieving data conform to specific instrument drivers and are encapsulated in the collection functions. The developers don’t have to write collection functions for existing instruments. For new types of instruments, new collection function is programmed based on the instrument driver and injected into the collection function library.
After the measurements are retrieved, the middleware checks them with quality control process. The process mainly consists of two steps: first, the measurements will be flagged with ‘missing’ when the messages are truncated or corrupted; second, the middleware compares the measurement value with upper and lower limits that are predefined through the configuration toolkit. If it is greater than the upper limit or less than the lower limit, the flag field in the database will be filled with ‘Range’. The measurements with poor quality will go through manual processes further.
All the collection functions are realized in the form of dynamic link library (DLL). Through setting the DLL path and function name with configuration toolkit, the mid- dleware can dynamically invoke the corresponding functions to communicate with instruments.Hence the middleware is loosely-coupled and can achieve better hardware independence.
3.4 Data Loader
Many observations are delayed due to the limitations of collection methods, for example, the observations col- lected by submersible buoys and man-observed number of specific types of fishes. These observations are often recorded in files and then read into database. Several types of files are commonly used in ocean observing domain, including eXtensible Markup Language (XML), Comma Separated Values (CSV) and Tab Separated Values (TSV). These files are of various formats and can’t be easily unified across communities and projects. The objective of data loader is extracting the measurements from structured data files in a flexible way.
With the assistance of configuration toolkit, data loader can adapt to files of various formats. The first step of data extraction is identifying the metadata contained in files. The stations, profiles and variables are configured so that the measurements can be associated after they are stored into the database. After that, data loader needs to be aware of the locations of variable values and their sampling time, which can be represented as the eXtensible path (Berglund., 2007) of the node that has the observed value for XML files, and specific column identifiers for CSV and TSV files. Then data loader finds the variables and extracts their values according to the configured locations. Fig.6 illustrates an example of extracting data from an XML file.

Fig.6 An example of extracting data from an XML file.
3.5 Web Services
Data access service is designed to facilitate data ex- change and integration across different regional systems. The regional systems that provides data through data access service can exchange data without difficulties since the data are transferred in a consistent format. The service consists of a set of interfaces, in which the structures of request and response messages are defined in the form of XML schema. Based on the service, integrated applications could realize uniform access to distributed data sources.
The service provides data step by step. The metadata are acquired first, and the observation data are retrieved subsequently according to the request metadata para- meters. In this way, the service performance is improved greatly since the transmissions of undesired data are avoided. We have designed GetObservationRecords inter- face for returning all the observation records, GetStation- ByRecord interface for returning the stations associated with the specified record, GetVariableByRecord and GetVariable ByStation interfaces for returning the varia- bles associated with specified records and stations res- pectively, GetObservationByRecord, GetObservation- ByStation, and GetObservationByVariable interfaces to support obtaining of the data in the fine-grained way.
3.6 Configuration Toolkit
The constituent parts of DPOI could not be reused directly in the systems that have different requirements. We have designed the configuration toolkit that transforms the dynamic requirements into configurable parameters. Values of the parameters can be assigned by the de- velopers according to specific requirements and be loaded by the application at run time. Hence the development procedure is simplified greatly and software customizabil- ity is enabled.
The toolkit consists of parameters setting tool and setting examination tool. The former is responsible for setting all the parameters from data acquisition to user interface. It turns the complex programming and de- bugging into visual parameter configuration. The latter is used to examine the errors in the configuration scheme. If the examination fails, the developers have to go back to find the faults and correct them. After this step, the developers can compose the system with the configured parts.
The developers can complete the parameters configure- tion through interactive dialog boxes step by step and be allowed to go back and forth. The configuration process is divided into settings for vocabulary, variables, acquisition middleware, data loader and components. Two configuration methods are supported in the toolkit. One is reusing the configuration schemes that are ever used in the past. It is suitable for applications with similar requirements. The other is reconfiguring a brand-new scheme according to the requirements. Next, the configuration procedure is described sequentially.
3.6.1 Settings for controlled vocabulary
Controlled vocabularies are configured first because they will be referenced in the following settings. It mainly includes variable types, organizations, sea areas, survey ships and quality flags. Standard name, abbreviation, description and unit information of each variable are configured in a variable type setting. The other settings are configured with key value pairs such as (37, ocean103) in survey ship settings. The controlled vocabulary increases gradually and never decreases. The deprecated items are marked with negative values. The stationary information such as sea areas can be exported and reused as an XML file.
3.6.2 Setting for variables
All variables observed in the system are configured in variable settings. The left side of Fig.7 shows how the variables are organized. Records, stations, profiles and variables can be configured hierarchically. The variables of the same type in different depths are grouped into a profile. The types, instrument and profile information of the variables can be inputted by reference. In addition, virtual variables whose values are calculated based on other variables’ values could also be configured.

Fig.7 Graphical user interfaces of parameter setting tool.
3.6.3 Settings for acquisiton middleware
In this step, survey platform and instrument information are confirmed. The instrument part includes settings for collection function information and mappings from the acquisition fields to the variables. The collection function is configured by specifying DLL path, DLL name and function name. The acquisition fields provided by the collection function are mapped to the variables so thatthe collected measurements can be parsed and assigned to each variable correctly.
3.6.4 Setting for data loader
Before this step, the contained variables in files should be configured in variable settings. Hence the configuration for data loader is just setting XPath value in XML files, and the column identifier in CSV and TSV files for each variable.
3.6.5 Settings for components
The configuration parameters of components are specified at this step. The window, subwindow and coordinate information are configured in time profile and vertical profile components. In the correlation settings, variables foraxis andaxis are specified by selecting from variable list. In the configuration for tabular display component, the display mode and page record numbers are specified. As an example, Fig.8 shows a configuration scheme for time profile component.

Fig.8 XML configuration scheme for time profile com- ponent.
4 System Development
We have applied DPOI to practical developments to demonstrate its effectiveness and efficiency. The overall architecture is illustrated in Fig.9. Two regional OISs are developed for acquiring and providing data to regional users. The integrated system is built by interconnecting two regional systems with data access service. The comprehensive data view of two regions can be seen from integrated web client. The DPOI development efficiency is then evaluated in different development practices and approaches.

Fig.9 System architecture.
4.1 Application Examples
The first system (Regional I) is deployed with twenty floats (See Fig.10a) that carry temperature and light sensors. These floats are connected by wireless com- munications and constitute an observing network. Their positions vary with sea current all the time. Theobservations are transmitted to shore station in real-time manner and stored in local database. Regional web server processes the observed data timely. The navigation map illustrated in Fig.11a shows topology structure of the observing network.
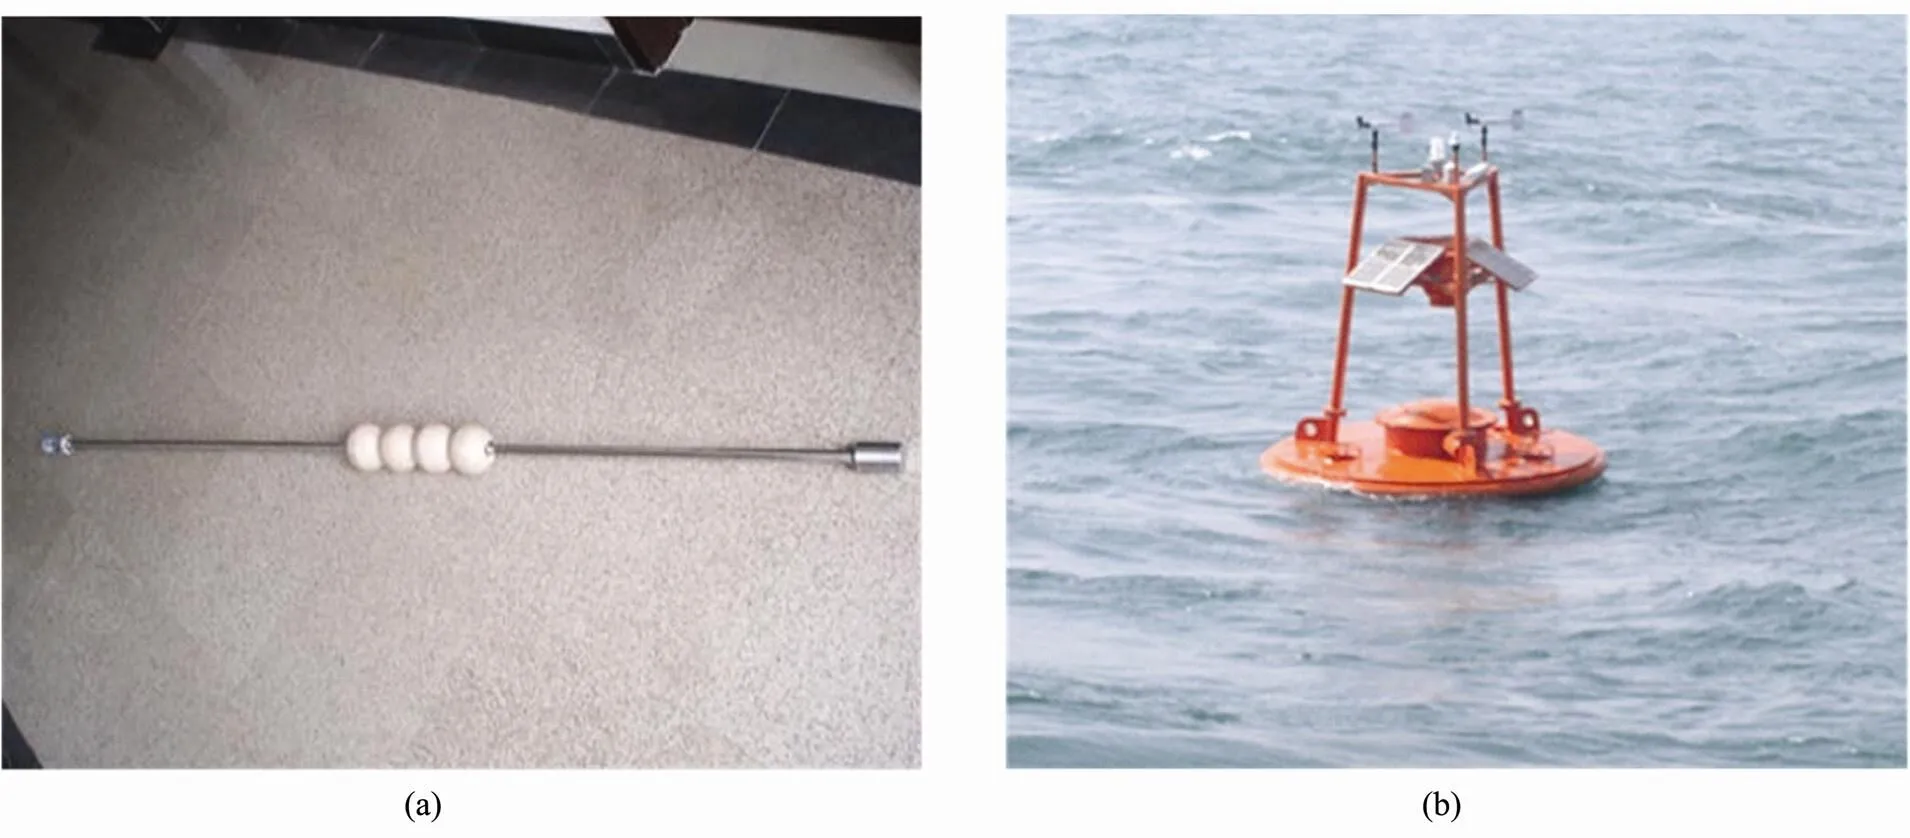
Fig.10 Survey platforms. (a) A float used in Regional I. (b) Small-size buoy in Regional II.

Fig.11 User interfaces. (a) Navigation for Regional I. (b) Rose diagram component.
We have deployed another system (Regional II) to monitor the meteorological, hydrological and chemical phenomena of a designated sea area. The survey platforms in use include small-size buoy (Fig.10b), medium-size buoy, wave rider, seabed base, underwater experiment platform and shore station. Seabed base and underwater experiment platform work at the sea floor and are recycled every half a year approximately. Each platform carries several types of instruments that sample multiple variables. Most of the variables are sampled every one hour while few are measured more frequently.
An integrated system (Integrated) has been established for achieving uniform data viewing. Web services are deployed to wrap the regional databases to provide standardized access. The integrated application obtains the station information from two regional systems and denotes them with symbols in the map. The variables and their values are obtained depending on users’ operations. The integrated application has similar functions with the regional applications. Fig.11b shows the user interface of rose diagram component.
4.2 Development Efficiency
We evaluate the efficiency of three system develop- ments in terms of development, test and maintenance. As illustrated in Fig.12a, the development of Regional I is very time-consuming. There are two main reasons: on one hand, complex programming and iterative tests result in long development phase; one the other hand, lack of clear definitions of function modules leads to large maintenance cost. Component technology is adopted in the design phase of Regional II. Each function is encapsulated as a reusable component. It is obvious that each phase of Regional II needs less human resource than that of Regional I. Integrated system is developed based on DPOI in a short time since the developers do not write any codes with the assistance of the configuration toolkit. Furthermore, the test and maintenance costs are remarkably reduced since each part of DPOI has been tested in advance.
Further comparison is conducted among several deve- lopment approaches. The first is monolithic mode, in which each part is tightly coupled with the rest and no modularization is considered in the design phase. The second approach is to separate the entire system into sev- eral functional modules. Similar functions in other sys- tems can be realized with code copying and modifications. The third approach is based on components that can be reused without any modification. DPOI continues the adoption of component technology and provides software customization to assist system developments. We have investigated the projects related to ocean observing that involves underwater sensor network, marine test site, ocean data integration and internal wave information, which experience one or several development approaches. The four approaches are evaluated according to the development cycle evaluation rules in software engineer- ing and the comparison is shown in Fig.12b. The results show that DPOI earns the highest cost-effectiveness in comparison with other approaches.

Fig.12 Development efficiency. (a) Comparison among practices. (b) Comparison among different approaches.
5 Conclusion
Due to the lack of powerful development platform, OIS software developments often result in low efficiency. In this paper, DPOI requirements that are derived from OIS requirements are summarized based on previous development practices. Following these requirements, a new development methodology has evolved from tradi- tional mode to platform-supported mode. A suite of available tools are built into the platform. Especially the customization mechanism enabled by DPOI has shortened the development cycle and improved the software quality drastically. The evaluation results are also manifested through practical developments and applications.
Sustained efforts are still needed to make the platform mature adequately, since the limitations and disadvantages exist inevitably. For example, the vocabulary is incom- plete to meet the evolving requirements; the web services should be enhanced to enable fast and efficient trans- portation; component repository should be extended to support more functions; user-friendly interface of con- figuration toolkit should be improved for the conven- ience of the developers,. For the pursuit of software quality and development efficiency, the platform will be broadened to meet the growing demands in future work.
Acknowledgements
This work is supported in part by National Natural Science Foundation of China under grant No. 61170258 and 61379127, National Ocean Public Benefit Research Foundation under grant No. 201305033-6 and 2011 05034-10, Marine Renewable Energy Special Foundation under grant No. GHME2012ZC02 and Science and Technology Development Plan of Qingdao City under Grant No. 12-1-3-81-jh.
Berglund, A., Boag, S., Chamberlin, D., Fernandez, M. F., Kay, M., Robie, J., and Siméon, J., 2007. XML path language (XPath) 2.0. W3C recommendation, 23.
de La Beaujardière, J., Beegle-Krause, C., Bermudez, L., Hankin, S., Hazard, L., Howlett, E., Le, S., Proctor, R., Signell, R. P., and Snowden, D., 2010. Ocean and coastal data management.’09:. Venice, Italy, DOI: 10.5270/ OceanObs09.cwp.22.
Fletcher, M., Cleary, J., Cothran, J., and Porter, D., 2008. South- east Atlantic Coastal Ocean Observation System (SEACOOS) information management: Evolution of a distributed com- munity system., 42 (3): 28-34.
Goni, G., Roemmich, D., Molinari, R., Meyers, G., Rossby, T., Sun, C., Boyer, T., Baringer, M., and Vissa, G., 2010. The ship of opportunity program.’09:. Venice, Italy, DOI: 10.5270/OceanObs09. cwp.35.
Goodall, J. L., Horsburgh, J. S., Whiteaker, T. L., Maidment, D. R., and Zaslavsky, I., 2008. A first approach to web services for the National Water Information System., 23 (4): 404-411.
Hankin, S. C., Blower, J. D., Carval, T., Casey, K. S., Donlon, C., Lauret, O., Loubrieu, T., Srinivasan, A., Trinanes, J., and Godoy, O., 2010. NetCDF-CF-OPeNDAP: Standards for ocean data interoperability and object lessons for community data standards processes.’09:. Venice, Italy, DOI: 10.5270/OceanObs09.cwp.41.
Horsburgh, J. S., Tarboton, D. G., Piasecki, M., Maidment, D. R., Zaslavsky, I., Valentine, D., and Whitenack, T., 2009. An integrated system for publishing environmental observations data., 24 (8): 879-888.
Jones, D. W., and Olsonbaker, J. I., 2009. Developing best practices for IOOS web portals.’ 2009,, 14-18.
Lau, K. K., and Wang, Z., 2007. Software component models.,, 33 (10): 709-724.
Moltmann, T., Proctor, R., Hill, K., and McGowen, M., 2010. The Integrated Marine Observing System-delivering data- streams to support marine research and applications.2010, 12pp.
Pouliquen, S., Schmid, C., Wong, A., Guinehut, S., and Belbeoch, M., 2010. Argo Data Management.’09:. Venice, Italy, DOI: 10.5270/OceanObs09. cwp.70.
Proctor, R., Roberts, K., and Ward, B., 2010. A data delivery system for IMOS, the Australian Integrated Marine Obser- ving System., 28 (28): 11-16.
Reed, G., Keeley, R., Belov, S., and Mikhailov, N., 2010. Ocean Data Portal: A standards approach to data access and disse- mination.’09:. Venice, Italy, DOI: 10.5270/ OceanObs09.cwp.72.
Seim, H., Fletcher, M., Mooers, C., Nelson, J., and Weisberg, R., 2009. Towards a regional coastal ocean observing system: An initial design for the Southeast Coastal Ocean Observing Regional Association., 77 (3): 261-277.
Smith, S. R., Bourassa, M., Bradley, E. F., Cosca, C., Fairall, C. W., Goni, G. J., Gunn, J. T., Hood, M., Jackson, D. L., and Kent, E. C., 2010. Automated underway oceanic and atmos- pheric measurements from ships.’09:. Venice, Italy, DOI: 10.5270/OceanObs09. cwp.82.
Taniar, D., Leung, C. H., Rahayu, W., and Goel, S., 2008.. Hoboken, John Wiley & Sons, 24-67.
(Edited by Ji Dechun)
DOI 10.1007/s11802-015-2494-3
ISSN 1672-5182, 2015 14 (1): 65-74
© Ocean University of China, Science Press and Springer-Verlag Berlin Heidelberg 2015
(September 30, 2013; revised May 20, 2014; accepted June 4, 2014)
* Corresponding author. E-mail:hukeyongouc@163.com
 Journal of Ocean University of China2015年1期
- Journal of Ocean University of China的其它文章
- The Influence of El Niño on MJO over the Equatorial Pacific
- Research on the Interannual Variability of the Great Whirl and the Related Mechanisms
- Brightness Temperature Model of Sea Foam Layer at L-band
- Parametric Instability Analysis of Deepwater Top-Tensioned Risers Considering Variable Tension Along the Length
- Nonlinear Contact Between Inner Walls of Deep Sea Pipelines in Buckling Process
- Floating Escherichia coli by Expressing Cyanobacterial Gas Vesicle Genes