
Chemical characterization of submicron particles during typical air pollution episodes in spring over Beijing
2016-11-23 03:30YANGTingSUNYeLeZHANGWeiWANGZiFndWANGXiQun
YANG Ting, SUN Ye-Le, ZHANG Wei, WANG Zi-Fnd WANG Xi-Qun
aState Key Laboratory of Atmospheric Boundary Layer Physics and Atmospheric Chemistry, Institute of Atmospheric Physics, Chinese Academy of Sciences, Beijing, China;bAviation Meteorological Center of China, Beijing, China
Chemical characterization of submicron particles during typical air pollution episodes in spring over Beijing
YANG Tinga, SUN Ye-Lea, ZHANG Weib, WANG Zi-Faaand WANG Xi-Quana
aState Key Laboratory of Atmospheric Boundary Layer Physics and Atmospheric Chemistry, Institute of Atmospheric Physics, Chinese Academy of Sciences, Beijing, China;bAviation Meteorological Center of China, Beijing, China
Beijing experienced a long-lasting pollution episode in April 2012. Here, the authors characterize the sources and evolution processes of the pollution, with a focus on a haze and a dust episode that occurred during 15-30 April. All submicron aerosol species (PM1) showed substantial increases during the haze episode (HE), with nitrate being the largest, contributing on average 32.2% of the non-refractory PM1(NR-PM1) mass (maximum: ~42.0%), which was diferent from other seasons. Secondary inorganic aerosol (SIA) species (55.1 ± 23.8 μg m-3; SIA = nitrate, ammonium, sulfate)played enhanced roles in the haze formation, accounting for 66.5% of the total NR-PM1mass. In contrast to the HE, organics exhibited their highest levels (8.9 ± 5.4 μg m-3) among the NR-PM1aerosol species during the dust episode, accounting for 64.0% on average. SIAs exhibited low concentration levels (4.6 ± 4.2 μg m-3) during the dust episode, contributing only 34.0% to the total NR-PM1mass. This study suggests that air quality improvement strategies should be designed according to aerosol particle characteristics and formation mechanisms.
ARTICLE HISTORY
Revised 19 February 2016
Accepted 11 March 2016
Particulate matter; haze;
pollution; nitrate; secondary inorganic aerosols; Beijing
2012年春季北京经历了罕见的连续污染过程,本研究着眼于霾及沙尘污染事件,对比探讨了两典型污染事件中亚微米细颗粒物(PM1)化学组分的差异。结果表明:霾事件中,PM1浓度迅速增加,其中硝酸盐增长最为明显且所占比重最大,硝酸盐在PM1质量浓度的平均占比为32.2%,最大可达42%,这与其它季节霾污染特性显著不同,二次无机气溶胶(硝酸盐,硫酸盐,铵盐)增长明显,平均质量浓度为55.1 ± 23.8 μg m-3,PM1的质量贡献为66.5%。沙尘污染事件的化学组分特性与霾事件显著不同,有机气溶胶所占比重最大,PM1平均质量贡献为64.0%,平均浓度为8.9 ± 5.4 μg m-3,二次无机气溶胶质量浓度较低,且仅占PM1质量浓度的34.0%。本研究表明,空气污染控制策略的制定需依据气溶胶的特点及形成机理有针对性进行。
1. Introduction
China is currently facing tremendous challenges with respect to air quality because of the substantial increases in anthropogenic emissions associated with rapid industrialization, motorization, and urbanization (Chan and Yao 2008). Beijing, the capital of China, is the national center for politics, culture, and international business. The city's population is 21 million and the population density is greater than that of other global megacities, e.g. London and Tokyo. The high population density and rapid economic growth have inevitably resulted in high air pollutant emission levels in Beijing. Decreased visibility is one of the most notable efects of aerosol pollution. In the Beijing region,visibility showed a decreasing trend during 1980-2008,and the number of hazy days has increased since the 1990s(Zhao et al. 2011). Due to the many negative efects on human health, in recent years air quality problems have received much public and governmental attention (Li et al. 2014; Zhang, Song, and Cai 2007).
Air pollution in Beijing is a complex phenomenon, so a clear understanding of its characteristics and formation mechanisms is the frst priority in the development of efective environmental protection policies. Research on the various chemical components of airborne particles can provide useful information for understanding the key aspects of the formation mechanisms (Sun et al. 2013b). Multiple studies have been conducted on the chemical characteristics of atmospheric aerosols in Beijing in recent years. Crustal matter, secondary inorganic aerosols (SIAs), and organic materials have been identifed as the three main chemical components of the aerosols in Beijing (Zhao et al. 2013). Sulfate, nitrate, andammonium) represent the dominant water soluble inorganic ions of aerosols during haze episodes (HE) (Sun et al. 2013b). Ammonium sulfate ((NH4)2SO4), ammonium nitrate (NH4NO3), and calcium nitrate (Ca(NO3)2) are the major species present on hazy spring days (Wang et al. 2006a). Wang et al. (2006a) found thatand calcium ions (Ca2+) were the two primary chemical components during dust episodes in Beijing.
Most previous studies have been conducted using flter samples, which have two disadvantages as compared with online analysis when studying the rapid evolution processes of diferent types of serious air pollution in Beijing. These problems are as follows: (1) The temporal resolution is poor, being one day or even longer, and the sub-micron particulate matter (PM1) concentration can increase to more than 500 μg m-3in less than half day (Sun et al. 2014). As such, flter samples do not provide the temporal resolution necessary for investigating the formation and transformation of particles. (2) Some volatile components deteriorate between the time of sampling and analysis. For example, NH4NO3will evaporate signifcantly to gas-phase nitric acid (HNO3) and ammonia (NH3) under relatively high temperatures (Ianniello et al. 2011). The 15-min online chemical analysis used in our study makes up for these disadvantages, and can adequately measure chemical species in PM1, which illustrates the most adverse efects on public health (Polichetti et al. 2009).
In this study, we employed various high temporal resolution instruments to investigate the rapid evolution of aerosol properties during a lengthy haze pollution episode and a dust storm in Beijing (15-30 April 2012). We compared the chemical composition of non-refractory PM1(NR-PM1) during hazy, clean, and dusty days to determine the diferences in their formation mechanisms. In particular, our online analysis captured a rare occurrence of a highconcentration in the NR-PM1mass. We also investigated the chemical composition of NR-PM1during the dust episode, which ofered insights into submicron particle formation during alkaline conditions.
2. Methods
2.1. Sampling site
Field measurements were carried out at the IAP, Chinese Academy of Sciences (39°58′28″N, 116°22′16″E), which is located between the north 3rd and 4th ring roads in Beijing,during 15-30 April 2012. The sampling site is located on the roof of a second-story building (~8 m high). All aerosol and gaseous species, including NR-PM1species, fne particles (PM2.5), nitric oxide (NO), nitrogen dioxide (NO2), total reactive nitrogen (NOy), ozone (O3), sulfur dioxide (SO2),and carbon monoxide (CO), were measured at this site. The meteorological variables, including temperature, RH, wind speed, and wind direction, were obtained from the frst foor (8 m) of the meteorological tower (325 m) at the IAP.
NR-PM1aerosol species, including organics,, and chloride (Chl), were measured in situ with an Aerodyne Aerosol Chemical Speciation Monitor (ACSM)(Ng et al. 2011).
2.2. Aerosol and gaseous species measurements
Positive matrix factorization (PMF), using the PMF2.exe algorithm (v4.2) in robust mode (Paatero and Tapper 1994),was performed on the ACSM organic aerosol (OA) mass spectra following the procedures described in Ulbrich et al. (2009). The PMF2 solutions were then evaluated with an Igor Pro-based PMF Evaluation Tool (PET, v2.04) (Ulbrich et al. 2009) following the procedures detailed in Zhang et al. (2011). The two-factor solution, including a hydrocarbon-like OA (HOA) and an oxygenated OA (OOA) with fpeak= 0, was chosen in this study.
The PM2.5mass was simultaneously measured using a Tapered Element Oscillating Microbalance (TEOM series 1400a, Thermo Scientifc, USA), and the collocated gaseous species, including CO, SO2, NO2, NO/NOy, and O3,were measured using various gas analyzers from Thermo Scientifc.
3. Results and discussion
3.1. Identification of two pollution episodes
Figure 1 shows the temporal variations of the mass concentrations of NR-PM1and PM2.5and the meteorological conditions during the measurement period. Two distinct pollution episodes with largely diferent NR-PM1/PM2.5ratios were observed. The HE was formed after a precipitation event on 16 April, and lasted more than one week until 24 April. The average (±1σ) concentrations of NR-PM1and PM2.5were 82.8 ± 34.3 μg m-3and 98.7 ± 50.6 μg m-3,respectively. As illustrated in previous work, the averaged NR-PM1concentration was 50 μg m-3in summer (Sun et al. 2012) and 66.8 μg m-3in winter (Sun et al. 2013a). The average PM2.5mass concentration was almost three times the National Ambient Air Quality Standards (NAAQS) of the U.S. Environmental Protection Agency (35 μg m-3, 24 h average), and approximately 1.3 times the second grade of China's NAAQS (75 μg m-3, 24 h average).

Figure 1.Time series of meteorological parameters and particulate concentrations during the study period (15-30 April 2012) in Beijing, including (a) wind speed and wind direction, (b) precipitation and pressure, (c) RH and temperature, (d) visibility, and (e) the hourly particulate concentrations of NR-PM1and PM2.5. The two pollution episodes, i.e. HE and DE, are marked. 48-h air mass backward trajectories during (e1) HE and (e2) DE. The starting altitude was 100 m for the two episodes, and the start time was 0000 UTC (= Beijing Standard Time - 8 h) for each day. MODIS true color composite images at around (f1) 1030 LST 22 April 2012 (Terra: bright white pixels are clouds and bluish-white pixels are haze (Engel-Cox et al. 2004)) and (f2) 1330 LST 27 April 2012 (sand colored pixels are dust storms(Kaufman et al. 2005)). The red dots in (f1) are fre spots.
The average ratio of NR-PM1/PM2.5was 0.84 during HE,indicating that submicron particles dominated the total mass of fne particles. The meteorological conditions were stagnant. The winds were dominantly from the south with low speed (~0.6 m s-1) and the RH was high (>60%). The stagnant dispersion conditions were also caused by a low-pressure system, the front of which persisted around Beijing during HE. As a result, the mass concentration of PM2.5remained consistently high during HE until the meteorological conditions had a noticeable change on 24 April. The back trajectories in Figure 1(e) show that the air masses during HE were dominantly from the south and southeast, with relatively short distances. The MODIS true color composite image on 22 April further showed evident gray haze clouds over the North China Plain, including Beijing, indicating that HE formed over a regional scale(Figure 1(f)).
The dust episode (DE) formed on 27 April in association with a rapid decrease in RH (from >90% to <10%)and a corresponding increase in wind speed (Figure 1). The PM2.5mass concentration continuously increased and reached a maximum of 259.3 μg m-3at 02:25, 29 April(LST). The average mass concentration of PM2.5during DE was 133.2 ± 70.5 μg m-3, which was even higher than that observed during HE. However, the NR-PM1mass remained consistently low during DE, with an average concentration of 13.9 ± 9.4 μg m-3. The average ratio of NR-PM1/ PM2.5was ~0.1, which was much lower than that during HE, indicating diferent chemical characteristics of the pollution between HE and DE. Given that the ACSM does not measure the refractory dust component at a vaporizer temperature of ~600 °C, the low NR-PM1/PM2.5ratio was primarily caused by the largely elevated dust particles during DE. This was also supported by the evident yellow dustclouds on 27 April over the North China Plain (Figure 1(f2)). The back trajectories confrmed that the air masses during DE originated from the Gobi Desert in Mongolia and Inner Mongolia (Figure 1(e2)). These results together suggested that DE was an episode with strong dust storm infuences.

Figure 2.Time series of the (a) mass concentrations and (b) mass fraction of NR-PM1species measured by the ACSM. The pie charts showthe average chemical compositions of NR-PM1during HE, DE, and a clean period (25 April 2012). (c) Average diurnal cycles of the mass concentration and PBL height normalizedduring HE.
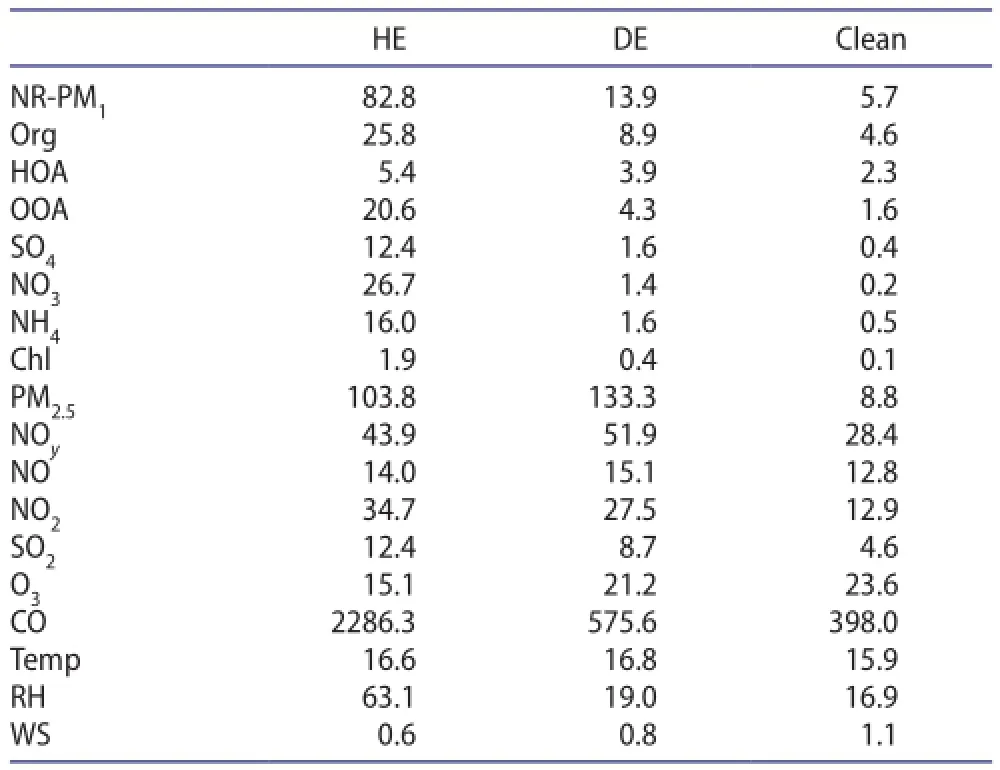
Table 1.Summary of the mass concentrations of NR-PM1species and PM2.5(μg m-3); gaseous concentrations of SO2, NOy, NO, NO2,and CO (ppb); and meteorological parameters including wind speed (WS, m s-1), RH (%), and temperature (Temp, °C).
3.2. Temporal variation of aerosol composition
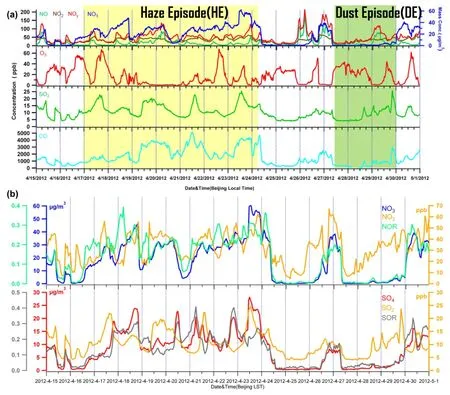
Figure 3.(a) Time series of the hourly gaseous concentrations of NO, NO2, NOy, O3, SO2, CO, andmass concentration. (b) Time series of the hourly concentration of, NO2, NOR, SO2, and SOR.
Figure 2 shows the time series of the mass concentration and mass fractions of NR-PM1species (organics, SO4, NO3,NH4, and Chl) for the entire study. SIAsdominated NR-PM1during HE, on average accounting for 66.5% of the total NR-PM1mass. The SIA mass was elevated by a factor of ~11-50 compared to that observed during the clean period (Table 1). Previous results illustrated that, andtogether accounted for 54%-61% of the total PM2.5mass, based on flter work carried out in spring in Beijing (Shen et al. 2016), which corresponds well with our fnding that, andwere the most important fractions of submicron particles. In comparison, organics contributed 31% of NR-PM1during HE, with OOA-a surrogate of secondary OA-accounting for 79% of OA. These results suggest that HE was primarily caused by secondary formation. Enhanced roles of secondary species during HE have also been observed previously at various sites in eastern China (Huang et al. 2012; Li et al. 2011; Sun et al. 2006; Tan et al. 2009; Wang et al. 2006a). However, different from previous studies,NO-3was the most abundant secondary species, contributing 32.2% of NR-PM1on average. TheNO-3contribution was much higher than those observed in summer (16%-25%) (Sun et al. 2010, 2012) and winter (14%-16%) (Sun et al. 2013a); Zhang et al. 2014),which indicates thatplayed a leading role in the formation of HE. As shown in Figure 2, thecontribution reached up to 42% during HE. Higher contributions ofto PM in spring than other seasons were also observed by flter sampling (Zhang et al. 2013). The formation ofis mainly driven by three processes: daytime photochemical production; gas-particle partitioning; and nighttime heterogeneous reactions. As shown in Table 1, the temperature averaged 16.6 °C during HE, under which NH4NO3will not evaporate signifcantly to gas-phase HNO3and NH3. This is further supported by the relatively fat diurnal cycle of(Figure 2). In addition, the high humidity (63.1%) facilitated the uptake of HNO3into the particle phase, and also nighttime heterogeneous reactions. For example, most of the time during HE was associated with high NO2and O3(Figure 3), which facilitated the formation of NO3radicals and dinitrogen pentoxide (N2O5), and hence the heterogeneous formation of HNO3under high conditions of RH. The results are consistent with the fndings of Parrish and Zhu(2009); namely, thatwas most probably formed via the heterogeneous hydrolysis process of N2O5on the surface of moist and acidic aerosols in Beijing and Shanghai,especially under humid and hazy weather. Photochemical production might also have been important, as suggested by the higher concentration ofNO-3in the afternoon by excluding the dilution efects of the PBL (Figure 2(c)). Moreover, the nitrogen oxidation ratio,+nNO2) (where n refers to molar concentration) during HE(0.21 ± 0.06) was also much higher than that during other periods (Figure 3(b)). All these factors together led to the high concentration ofin spring. Indeedexceededall other secondary species for most of the time during HE(Figure 2).also showed a signifcant increase during HE(12.4 ± 5.7 μg m-3) compared to DE (1.6 ± 1.5 μg m-3) and the clean period (0.4 ± 0.1 μg m-3). The larger contribution ofduring HE could have been related to the higher oxidation ratio of SO2. The average sulfur oxidation ratio(SOR) was 0.19 ± 0.08 during HE, which was almost fve times higher than during DE (0.04 ± 0.01) and the clean period (0.02 ± 0.01). The increased SOR indicated an enhanced secondary formation during HE. The conversion of SO2tois mainly attributed to the gas-phase oxidation by OH radicals and/or heterogeneous oxidation by hydrogen peroxide, O3, and oxygen/iron/manganese etc. (Calvert et al. 1985; Seinfeld and Pandis 2006). Many studies have suggested that the conversion of SO2toduring HE takes place dominantly via aqueous-phase oxidation (Li et al. 2011; Sun et al. 2006; Tan et al. 2009). In this study, the high RH during HE was a favorable factor for the aqueous-phase oxidation of SO2. Despite this, the contribution ofto NR-PM1remained relatively constant(~15%) during HE. The mass ratio ofin the present study was 2.2 ± 0.8, which was signifcantly higher than observed in 2006 (0.64) (Wang et al. 2006b) and 1999-2000(0.43) (Yao et al. 2002; Ye et al. 2003). The higher ratio offurther demonstrates the signifcant role ofin haze formation in spring.
Compared to HE, NR-PM1contributed only ~10% to the PM2.5mass during DE. Given that the ACSM does not measure the refractory dust component at a vaporizer temperature of ~600 °C, the low NR-PM1/PM2.5ratio was primarily caused by the largely elevated dust particles during DE. According to the fndings of Wang et al. (2005), the mass fraction of mineral dust can reach up to ~94.3% of PM2.5in a super dust storm and ~91% during a regular dust storm in Beijing (Wang et al. 2006a). The NR-PM1during DE was mainly composed of organics. Organics exhibited their highest levels (8.9 ± 5.4 μg m-3) among NR-PM1aerosol species during DE, accounting for 64.0% on average. This was signifcantly diferent from the dominance of SIA during HE. However, the organic contribution was similar to that observed during winter clean periods (63%) (Sun et al. 2013a), when the air masses were from the upwind areas of Beijing and characterized by a high mass fraction of organics (Sun et al. 2012). A similar dominance of organics at low PM loadings was also observed at the rural site of Yufa (Takegawa et al. 2009) and the urban site of Peking University (Huang et al. 2010). The organics at low mass loadings are characterized by a dominant contribution from local trafc and cooking emissions (Sun et al. 2012). SIAs exhibited low concentration levels (4.6 ± 4.2 μg m-3)during DE and contributed 34% to the total NR-PM1mass. Inorganicshowed an apparently lower contribution to the total NR-PM1mass during DE (10%) than HE (32%),which can be explained by low precursors (nitrogen oxides, NOx) and humidity. Secondarypresented a similar contribution to the total NR-PM1mass during DE and HE (12% and 15%, respectively), although the mass concentrations of the two episodes were markedly diferent (1.6 μg m-3versus 12.4 μg m-3, Table 1). The ratio ofalso showed a large decrease, from 2.2 during HE to 0.9 during DE. Theratio during DE was higher than the value of ~0.3 during 2001-04 dust episodes in Beijing (Wang et al. 2006a). According to the results of Zhang et al. (2016), the control of SO2emissions has been proven to be successful in Beijing from 1998. In comparison, NOxreduction was less obvious from 2008 through 2013 in Beijing, possibly attributable to the increase in vehicle emissions counteracting the reduction of coal-burning emissions (Zhang et al. 2015). Because the RH during DE was low, the heterogeneous reactions of SO2on dust particles might have dominated theformation (He et al. 2014; Wang et al. 2006a). In addition,the surface soil in desert areas might have been another important source ofduring DE (Wu et al. 2012).
4. Summary
We measured the aerosol particle composition and trace gases at an urban site in the megacity of Beijing during 15-30 April 2012. Two distinct pollution episodes were identifed, i.e. HE and DE, on the basis of measurements of visibility, aerosol composition, satellite images, and air mass trajectories. The average concentrations of NR-PM1and PM2.5during HE were 82.8 ± 34.3 μg m-3and 98.7 ± 50.6 μg m-3, respectively, with an average NR-PM1/ PM2.5ratio of 0.84. DE, however, showed a much lower NR-PM1concentration (13.9 ± 9.4 μg m-3), and higher concentrations of PM2.5(133.2 ± 70.5 μg m-3). The average NR-PM1/PM2.5ratio was ~0.1, indicating the dominance of PM1-2.5dust particles during DE.
Disclosure statement
No potential confict of interest was reported by the authors.
Funding
This work was supported by the National Key Basic Research Program of China [grant number 2014CB447900]; the National Natural Science Foundation of China [grant number 41305115]; the Strategic Priority Research Program (B) of the Chinese Academy of Sciences [grant number XDB05020501];the Project of High-resolution Earth Observation System [grant number 05-Y30B02-9001-13/15-7-WX02]; and Commonwealth Project in Ministry of Environmental Protection [grant number 201309011].
Notes on contributor
YANG Ting is an assistant professor at State Key Laboratory of Atmospheric Boundary Layer Physics and Atmospheric Chemistry, Institute of Atmospheric Physics, Chinese Academy of Sciences. Her main research interests focus on the air quality monitoring and modeling. Ting's recent publications include papers in Atmospheric Chemistry and Physics, Atmospheric Environment, Journal of Geophysical Research: Atmospheres.
References
Calvert, J. G., A. Lazrus, G. L. Kok, B. G. Heikes, J. G. Walega,J. Lind, and C. A. Cantrell. 1985. “Chemical Mechanisms of Acid Generation in the Troposphere.” Nature 317: 27-35.
Chan, C. K., and X. Yao. 2008. “Air Pollution in Mega Cities in China.” Atmospheric Environment 42: 1-42.
Engel-Cox, J. A., C. H. Holloman, B. W. Coutant, and R. M. Hof. 2004. “Qualitative and Quantitative Evaluation of MODIS Satellite Sensor Data for Regional and Urban Scale Air Quality.” Environment Atmospheric 38: 2495-2509.
He, H., Y. Wang, Q. Ma, J. Ma, B. Chu, D. Ji, G. Tang, C. Liu,H. Zhang, and J. Hao. 2014. “Mineral Dust and NOx Promote the Conversion of SO2to Sulfate in Heavy Pollution Days.”Scientific Reports 4: 4172-4177.
Huang, X.-F., L.-Y. He, M. Hu, M. Canagaratna, Y. Sun, Q. Zhang,T. Zhu, L. Xue, L.-W. Zeng, and X.-G. Liu. 2010. “Highly Time-Resolved Chemical Characterization of Atmospheric Submicron Particles during 2008 Beijing Olympic Games Using an Aerodyne High-Resolution Aerosol Mass Spectrometer.”Atmospheric Chemistry and Physics 10: 8933-8945.
Huang, K., G. Zhuang, Y. Lin, J. Fu, Q. Wang, T. Liu, R. Zhang,Y. Jiang, C. Deng, and Q. Fu. 2012. “Typical Types and Formation Mechanisms of Haze in an Eastern Asia Megacity,Shanghai.” Atmospheric Chemistry and Physics 12: 105-124.
Ianniello, A., F. Spataro, G. Esposito, I. Allegrini, M. Hu, and T. Zhu. 2011. “Chemical Characteristics of Inorganic Ammonium Salts in PM2.5in the Atmosphere of Beijing (China).” Atmospheric Chemistry and Physics 11: 10803-10822.
Kaufman, Y., I. Koren, L. Remer, D. Tanré, P. Ginoux, and S. Fan. 2005. “Dust Transport and Deposition Observed from the Terra-Moderate Resolution Imaging Spectroradiometer(MODIS) Spacecraft over the Atlantic Ocean.” Journal of Geophysical Research: Atmospheres 110: D10S12.
Li, L., H. Li, X. Zhang, L. Wang, L. Xu, X. Wang, Y. Yu, Y. Zhang,and G. Cao. 2014. “Pollution Characteristics and Health Risk Assessment of Benzene Homologues in Ambient Air in the Northeastern Urban Area of Beijing, China.” Journal of Environmental Sciences 26: 214-223.
Li, W., S. Zhou, X. Wang, Z. Xu, C. Yuan, Y. Yu, Q. Zhang, and W. Wang. 2011. “Integrated Evaluation of Aerosols from Regional Brown Hazes over Northern China in Winter: Concentrations, Sources, Transformation, and Mixing States.”Journal of Geophysical Research: Atmospheres 116: D09301.
Ng, N. L., S. C. Herndon, A. Trimborn, M. R. Canagaratna,P. Croteau, T. B. Onasch, D. Sueper, D. R. Worsnop, Q. Zhang,and Y. Sun. 2011. “An Aerosol Chemical Speciation Monitor(ACSM) for Routine Monitoring of the Composition and Mass Concentrations of Ambient Aerosol.” Aerosol Science and Technology 45: 780-794.
Paatero, P., and U. Tapper. 1994. “Positive Matrix Factorization: A Non-negative Factor Model with Optimal Utilization of Error Estimates of Data Values.” Environmetrics 5: 111-126.
Parrish, D. D., and T. Zhu. 2009. “Clean Air for Megacities.” Science 326: 674-675.
Polichetti, G., S. Cocco, A. Spinali, V. Trimarco, and A. Nunziata. 2009. “Efects of Particulate Matter (PM10, PM2.5and PM1) on the Cardiovascular System.” Toxicology 261: 1-8.
Seinfeld, J. H., and S. N. Pandis. 2006. Atmospheric Chemistry and Physics: From Air Pollution to Climate Change. New York: Wiley. Shen, R., K. Schäfer, L. Shao, J. Schnelle-Kreis, Y. Wang, F. Li, Z. Liu,S. Emeis, and H. P. Schmid. 2016. “Chemical Characteristics of PM 2.5 during Haze Episodes in Spring 2013 in Beijing.” Urban Climate. (In press).
Sun, Y., G. Zhuang, A. Tang, Y. Wang, and Z. An. 2006. “Chemical Characteristics of PM2.5 and PM10 in Haze-Fog Episodes in Beijing.” Environmental Science & Technology 40: 3148-3155.
Sun, J., Q. Zhang, M. R. Canagaratna, Y. Zhang, N. L. Ng, Y. Sun,J. T. Jayne, X. Zhang, X. Zhang, and D. R. Worsnop. 2010. “Highly Time-and Size-Resolved Characterization of Submicron Aerosol Particles in Beijing Using an Aerodyne Aerosol Mass Spectrometer.” Atmospheric Environment 44: 131-140.
Sun, Y., Z. Wang, H. Dong, T. Yang, J. Li, X. Pan, P. Chen, and J. T. Jayne. 2012. “Characterization of Summer Organic and Inorganic Aerosols in Beijing, China with an Aerosol Chemical Speciation Monitor.” Atmospheric Environment 51: 250-259.
Sun, Y., Z. Wang, P. Fu, T. Yang, Q. Jiang, H. Dong, J. Li, and J. Jia. 2013a. “Aerosol Composition, Sources and Processes during Wintertime in Beijing, China.” Atmospheric Chemistry and Physics 13: 4577-4592.
Sun, Z., Y. Mu, Y. Liu, and L. Shao. 2013b. “A Comparison Study on Airborne Particles during Haze Days and Non-Haze Days in Beijing.” Science of the Total Environment 456-457: 1-8.
Sun, Y., Q. Jiang, Z. Wang, P. Fu, J. Li, T. Yang, and Y. Yin. 2014.“Investigation of the Sources and Evolution Processes of Severe Haze Pollution in Beijing in January 2013.” Journal of Geophysical Research: Atmospheres 119: 4380-4398.
Takegawa, N., T. Miyakawa, M. Kuwata, Y. Kondo, Y. Zhao, S. Han,K. Kita, Y. Miyazaki, Z. Deng, and R. Xiao. 2009. “Variability of Submicron Aerosol Observed at a Rural Site in Beijing in the Summer of 2006.” Journal of Geophysical Research: Atmospheres 114: D00G05.
Tan, J.-H., J.-C. Duan, D.-H. Chen, X.-H. Wang, S.-J. Guo,X.-H. Bi, G.-Y. Sheng, K.-B. He, and J.-M. Fu. 2009. “Chemical Characteristics of Haze during Summer and Winter in Guangzhou.” Atmospheric Research 94: 238-245.
Ulbrich, I., M. Canagaratna, Q. Zhang, D. Worsnop, and J. Jimenez. 2009. “Interpretation of Organic Components from Positive Matrix Factorization of Aerosol Mass Spectrometric Data.” Atmospheric Chemistry and Physics 9: 2891-2918.
Wang, Y., G. Zhuang, Y. Sun, and Z. An. 2005. “Water-Soluble Part of the Aerosol in the Dust Storm Season - Evidence of the Mixing between Mineral and Pollution Aerosols.” Atmospheric Environment 39: 7020-7029.
Wang, Y., G. Zhuang, Y. Sun, and Z. An. 2006a. “The Variation of Characteristics and Formation Mechanisms of Aerosols in Dust, Haze, and Clear Days in Beijing.” Atmospheric Environment 40: 6579-6591.
Wang, Y., G. Zhuang, X. Zhang, K. Huang, C. Xu, A. Tang, J. Chen,and Z. An. 2006b. “The Ion Chemistry, Seasonal Cycle, and Sources of PM2.5and TSP Aerosol in Shanghai.” Atmospheric Environment 40: 2935-2952.
Wu, F., D. Zhang, J. Cao, H. Xu, and Z. An. 2012. “Soil-Derived Sulfate in Atmospheric Dust Particles at Taklimakan Desert.”Geophysical Research Letters 39: L24803.
Yao, X., C. K. Chan, M. Fang, S. Cadle, T. Chan, P. Mulawa, K. He, and B. Ye. 2002. “The Water-Soluble Ionic Composition of PM2.5in Shanghai and Beijing, China.” Atmospheric Environment 36: 4223-4234.
Ye, B., X. Ji, H. Yang, X. Yao, C. K. Chan, S. H. Cadle, T. Chan, and P. A. Mulawa. 2003. “Concentration and Chemical Composition of PM2.5in Shanghai for a 1-Year Period.” Atmospheric Environment 37: 499-510.
Zhang, M., Y. Song, and X. Cai. 2007. “A Health-based Assessment of Particulate Air Pollution in Urban Areas of Beijing in 2000-2004.” Science of the Total Environment 376: 100-108.
Zhang, Q., J. L. Jimenez, M. R. Canagaratna, I. M. Ulbrich,N. L. Ng, D. R. Worsnop, and Y. Sun. 2011. “Understanding Atmospheric Organic Aerosols via Factor Analysis of Aerosol Mass Spectrometry: A Review.” Analytical and Bioanalytical Chemistry 401: 3045-3067.
Zhang, R., J. Jing, J. Tao, S. C. Hsu, G. Wang, J. Cao, C. S. L. Lee, et al. 2013. “Chemical Characterization and Source Apportionment of PM2.5in Beijing: Seasonal Perspective.” Atmospheric Chemistry and Physics 13: 7053-7074.
Zhang, J., Y. Sun, Z. Liu, D. Ji, B. Hu, Q. Liu, and Y. Wang. 2014.“Characterization of Submicron Aerosols during a Month of Serious Pollution in Beijing, 2013.” Atmospheric Chemistry and Physics 14: 2887-2903.
Zhang, H., S. Wang, J. Hao, X. Wang, S. Wang, F. Chai, and M. Li. 2016. “Air Pollution and Control Action in Beijing.” Journal of Cleaner Production 112: 1519-1527.
Zhao, P., X. Zhang, X. Xu, and X. Zhao. 2011. “Long-Term Visibility Trends and Characteristics in the Region of Beijing, Tianjin, and Hebei, China.” Atmospheric Research 101: 711-718.
Zhao, X. J., P. S. Zhao, J. Xu, W. Meng, W. W. Pu, F. Dong, D. He,and Q. F. Shi. 2013. “Analysis of a Winter Regional Haze Event and Its Formation Mechanism in the North China Plain.”Atmospheric Chemistry and Physics 13: 5685-5696.
可吸入颗粒物; 霾; 硝酸盐; 二次无机气溶胶; 北京
28 December 2015
CONTACT YANG Ting tingyang@mail.iap.ac.cn
© 2016 The Author(s). Published by Informa UK Limited, trading as Taylor & Francis Group.
This is an Open Access article distributed under the terms of the Creative Commons Attribution License (http://creativecommons.org/licenses/by/4.0/), which permits unrestricted use, distribution, and reproduction in any medium, provided the original work is properly cited.
猜你喜欢
中老年保健(2022年3期)2022-11-21
辐射防护通讯(2019年3期)2019-04-26
四川环境(2019年6期)2019-03-04
学生天地(2017年12期)2017-05-17
高原山地气象研究(2016年2期)2016-11-10
中国果业信息(2015年12期)2015-01-24
西安建筑科技大学学报(自然科学版)(2014年5期)2014-11-10
植物营养与肥料学报(2010年6期)2010-10-26
 Atmospheric and Oceanic Science Letters2016年4期
- Atmospheric and Oceanic Science Letters的其它文章
- A decadal abruption of midwinter storm tracks over North Pacific from 1951 to 2010
- Comparison of convective parameterizations in RegCM4 experiments over China with CLM as the land surface model
- Two different periods of high dust weather frequency in northern China
- Pressure gradient errors in a covariant method of implementing the σ-coordinate: idealized experiments and geometric analysis
- Biogenic isoprene emissions over China: sensitivity to the CO2inhibition effect
- The link between the Victoria mode in the preceding boreal winter and spring precipitation over the southeastern USA and Gulf of Mexico