
Two different periods of high dust weather frequency in northern China
2016-11-23 03:30FANKeXIEZhiMinganXUZhiQing
FAN Ke, XIE Zhi-Mingan XU Zhi-Qing
aNansen-Zhu International Research Centre, Institute of Atmospheric Physics, Chinese Academy of Sciences, Beijing, China;bCollaborative Innovation Center on Forecast and Evaluation of Meteorological Disasters, Nanjing University of Information Science & Technology, Nanjing,China;cUniversity of the Chinese Academy of Sciences, Beijing, China;dClimate Change Research Center, Chinese Academy of Sciences, Beijing,China
Two different periods of high dust weather frequency in northern China
FAN Kea,b, XIE Zhi-Minga,cand XU Zhi-Qingd
aNansen-Zhu International Research Centre, Institute of Atmospheric Physics, Chinese Academy of Sciences, Beijing, China;bCollaborative Innovation Center on Forecast and Evaluation of Meteorological Disasters, Nanjing University of Information Science & Technology, Nanjing,China;cUniversity of the Chinese Academy of Sciences, Beijing, China;dClimate Change Research Center, Chinese Academy of Sciences, Beijing,China
This study reveals that, during the period 1966-2014, dust weather frequency (DWF) in northern China (north of 30°N) features two high-DWF periods, in 1966-1979 (P1) and 2000-2014 (P2), when the linear trend of DWF is removed during the study period. Here, DWF denotes the number of days of dust weather events in the spring season (March-April-May), including dust haze, blowing dust,and dust storms, which occurred in northern China. The results show that the DWF is much higher in P1 than in P2, with increased DWF distributed over southern Xinjiang, the central part of northern China. The main cause is the SST diference in the Atlantic and Pacifc between the two periods. It is also found that a meridional teleconnection over East Asia in P1 and a zonal wave-like pattern over Eurasia in P2 at 200 hPa play a signifcant role in the interannual variability in the two periods,respectively. SST over the subtropical North Atlantic (extratropical SST between the Norwegian and Barents seas) may partly contribute to the upper-level meridional (zonal) teleconnection in P1 (P2).
ARTICLE HISTORY
Revised 17 March 2016
Accepted 18 March 2016
Dust weather frequency;
northern China; meridional teleconnection; zonal wavelike pattern; North Atlantic SST
近几十年,我国北方春季沙尘的频次的线性趋势下降,但去掉线性趋势后,发现我国北方春季沙尘频次在1966-2014期间有两段沙尘频次的多发年,前一段是1966-1979(P1),后一段是2000-2014 (P2)。认识这两段高频沙尘发生的主要特点和可能原因将进一步理解不同年代际背景下沙尘年际变异机理,为沙尘的气候预测提供依据。研究表明前一阶段沙尘的强度是高于后一阶段,沙尘中心分布在南疆和北方中部(华北、河套和内蒙)。主要的原因是北大西洋和北太平洋海温异常不同造成。前者主要受北大西洋副热带海温异常的影响,后者受北大西洋高纬海温异常的影响。前一阶段200 hPa 高层环流出现经向的大气遥相关,导致40-45°N东亚急流加强一方面有利于动量下传造成蒙古气旋活跃,另一方面有利于新疆和蒙古的沙尘输送到我国北方中部区域。后一阶段从北大西洋高纬到东亚呈现纬向波列,导致蒙古气旋南部西风气流加强,沙尘从新疆输送到我国北方。与后一阶段比较,前一阶段的两极冷空气更为活跃,沙尘发生动力条件更强,且春季蒙古和北方中部降水减少均有利于沙尘更强
1. Introduction
Dust weather in northern China, including dust haze,blowing dust, and dust storms, mainly occurs in spring(March-April-May), afecting human health, the environment, and climate change via its direct and indirect efects on radiation over the Asia-Pacifc region. Studies show that the long-term variation in dust weather frequency (DWF) in northern China features a decreasing trend during the past several decades, but increased after 1997, with a remarkable increase in DWF in 2000-2002(Qian, Quan, and Shi 2002; Zhang et al. 2002; Kurosaki and Mikami 2003; Fan and Wang 2004, 2006a; Zhou and Zhai 2004). The variability of DWF in northern China is infuenced by the surface wind and vegetation (Kurosaki and Mikami 2003; Zhou and Zhai 2004; Lee and Sohn 2009), northern cyclone frequency (Sun, Zhang, and Liu 2001; Qian, Quan, and Shi 2002), East Asian winter monsoon (Qian, Quan, and Shi 2002; Kang and Wang 2005; Fan and Wang 2006a, 2006b; Wu et al. 2010), and large-scale atmospheric teleconnection, including the Antarctic Oscillation (AAO) (Fan and Wang 2004, 2007),Arctic Oscillation (AO) (Kang and Wang 2005), and the Pacifc-North America pattern (Gong et al. 2007). Based on this knowledge, an efective dust climate prediction model containing the AAO, AO, and dust-related climate factors was developed to improve the ability to predict the dust climate in China (Lang 2008).
In this study, considering the long-term decreasing trend of DWF in northern China is partly related to globalwarming (Zhu, Wang, and Qian 2008), we remove the linear trend of DWF during 1966-2014 and discover that the detrended-DWF in northern China exhibits two high-DWF periods, in 1966-1979 (P1) and 2000-2014 (P2). These features can be detected using the moving t-test and Lepage test statistical methods, with the statistical signifcance exceeding the 95% confdence level. We then present the characteristics of the two high-DWF periods and explore the underlying physical mechanisms involved. The overall purpose of this work is to further our understanding of DWF variability in northern China.

Figure 1.(a) The frst spatial EOF mode of normalized DWF at 245 stations in northern China during 1966-2014 (dots denote stations).(b) The time series of the frst EOF mode of DWF, in which the red lines denote the average value of DWF for 1966-1979, 1980-1999,and 2000-2014. (c) The decadal change points of DWF variation as determined by a moving t-test, where the upper (lower) transverse lines denote signifcance at the 95% (90%) confdence level. (d) The diference in the spatial pattern of DWF between 1966-1979 and 2000-2014.
2. Data and method
The monthly data of the number of days of dust weather,including dust haze, blowing dust, and dust storms, at 245weather stations in China during 1966-2014 are from the National Climate Information Center, China. The DWF at a station in China denotes the number of days of dust haze,blowing dust, and dust storms in the spring (March-April-May) at that station. The monthly reanalysis data used, with a horizontal resolution of 2.5° × 2.5°, are from the NCPEPNCAR data-set (Kalnay et al. 1996). The monthly SST data used, with a horizontal resolution of 1.0° × 1.0°, are from the Characteristics of the Global Sea Surface Temperature data-set of the Japan Meteorological Agency, covering 1891-2015. EOF analysis is used to present the spatiotemporal structure of DWF in northern China. As the frst spatial EOF mode (EOF1) of DWF in northern China at 245 weather stations shows basically coherent change, accounting for 28.4% of the total variance of DWF, DWF PC1 is defned as the index of DWF in northern China (Figure 1(a)). All calculations are based on the detrended data.
3. Results
There are three decadal change points, 1970/1971, the mid-1980s, and 2000/2001, in the variation of PC1 DWF in northern China, all statistically signifcant at the 0.05 level (Figure 1(c)). This indicates that DWF in northern China increased both in 1966-1979 (P1) and in 2000-2014(P2), and decreased in 1980-1999. Moreover, the intensity of DWF in 1966-1979 (P1) is much larger than that in 2000-2014 (P2), accompanied by increased DWFs over the central part of northern China, including Inner Mongolia,the Hetao region, North China, and the southern part of Xinjiang (Figure 1(d)). But which climate factors likely infuenced the two high-DWF periods? To address this question, we investigate the decadal diferences in mean SLP and SST between them, as well as the dust-related interannual variation in these two periods.
We begin by plotting the decadal diferences of mean SLP and SST between P1 and P2 (P1-P2). As shown in Figure 2(a), relative to P2 in March-April-May, negative phases of the North Atlantic Oscillation (NAO) and AAO are evident in P1, with increased SLP over the high latitudes of the North Atlantic and Antarctic and decreased SLP over the midlatitudes of the Eurasian continent and the SH. Previous research shows that the winter and spring NAO and AAO may impact upon the Siberian high and Aleutian low, upper-level polar jet, and subtropical east Asian jet via atmospheric teleconnection, further infuencing DWF variation in northern China (Wu and Wang 2002; Fan and Wang 2004, 2006a, 2006b, 2007; Kang and Wang 2005; Gong et al. 2007). Meanwhile, the Siberian high and Aleutian low are more robust in P1 compared with P2 and stronger northeasterly fow prevails along the eastern fank of the Siberian high and East Asian coast. These diferences of the above atmospheric circulation, particularly for the polar regions, show more active cold air over east Asia in P1, generating favorable dynamical conditions for increased DWF in northern China, which may explain why the intensity of DWF is stronger in P1 than in P2. As shown in Figure 2(b), while a greater portion of the SSTs (excluding those of the subtropical and tropical North Pacifc) are cooling in P1 than in P2 (Figure 2(b)),along with decreased surface air temperature over the Eurasian continent (fgure not shown), accordingly, the land-ocean thermal contrast over East Asia can increase,resulting in more robust northeasterly fow over East Asia in P1 than in P2 (Figure 2(c)). Therefore, the change in the SST pattern provides favorable dynamical conditions for a stronger intensity of DWF in P1. Additionally, compared with P2, spring precipitation over Mongolia and northern China decreases in P1, resulting in poorer vegetation coverage in these regions (Figure 2(d)) (Zhou and Zhai 2004;Kurosaki, Shinoda, and Mikami 2011).
Next, we investigate the diferences in the interannual variability of DWF-related atmospheric circulation in the two periods. Figure 3 shows a regression of the spring wind feld at 200 and 850 hPa on the DWF index in northern China in P1 and P2, separately. Associated with the high DWF index in P1, a remarkable meridional atmospheric pattern at 200 hPa is apparent, consisting of an anomalous cyclone and an anomalous anticyclone over the north and south of 40°N over the area (15-60°N, 90-135°E), respectively. Accordingly, the upper westerly East Asian jet at 40°N can be strengthened, which facilitates not only lowlevel cyclogenesis but also the upper westerly momentum downward. Correspondingly, there is an anomalous cyclone centered over Northeast Asia (45°N, 135°E), causing strong northwesterly fow from its rear (Figures 3(a)and (b)). As a result, greater quantities of dust can be transported from Mongolia to the central part of northern China by the northwesterly, and that is why the increased DWFs are distributed over the central part of northern China (see Figures 3(a) and 1(c)). Note that cold air activity from the polar region can easily invade southward via a weakened polar jet over Eurasia. Therefore, the DWFs in P1 are stronger than in P2, with most dust transported via Mongolia (Figure 1(d)). Moreover, spring soil moisture decreases more over Mongolia and northern China in P1 than in P2, which is favorable for increased DWFs in the central part of northern China in P1 (fgure not shown).
In contrast, a zonal wave-like atmospheric pattern at 200 hPa is prominent in P2, which is characterized by a diferent anomalous cyclone over the extratropical North Atlantic centered at 60°N, an anomalous anticyclone over the Caspian Sea at 40°N, and an anomalous cyclone spanning from Mongolia to northern China at 35°N where the Mongolian cyclogenesis occurs (Figures 3(c) and (d)). Consequently, greater quantities of dust from the desertsof Northwest China can be transported to northern China via the strong westerly fow of the southern part of the Mongolian cyclone. Therefore, a dust-related atmospheric pattern plays a key role in the northwesterly (westerly) dust pathways of P1 (P2).
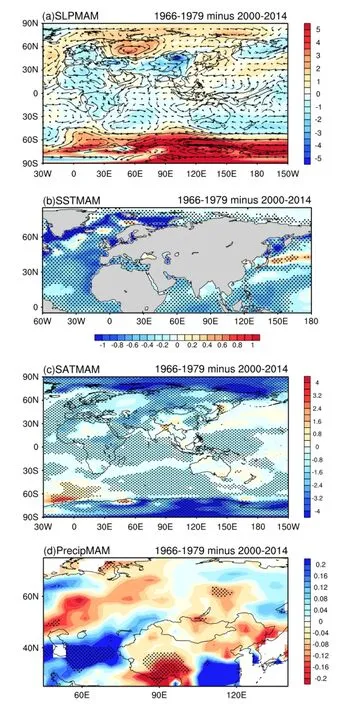
Figure 2.Diference in spring (a) SLP (units: millibars) and surface wind at 2 m (units: m s-1), (b) SST (units: °C), (c) surface air temperature(units: °C), and (d) precipitation (units: mm) between 1966-1979 and 2000-2014.
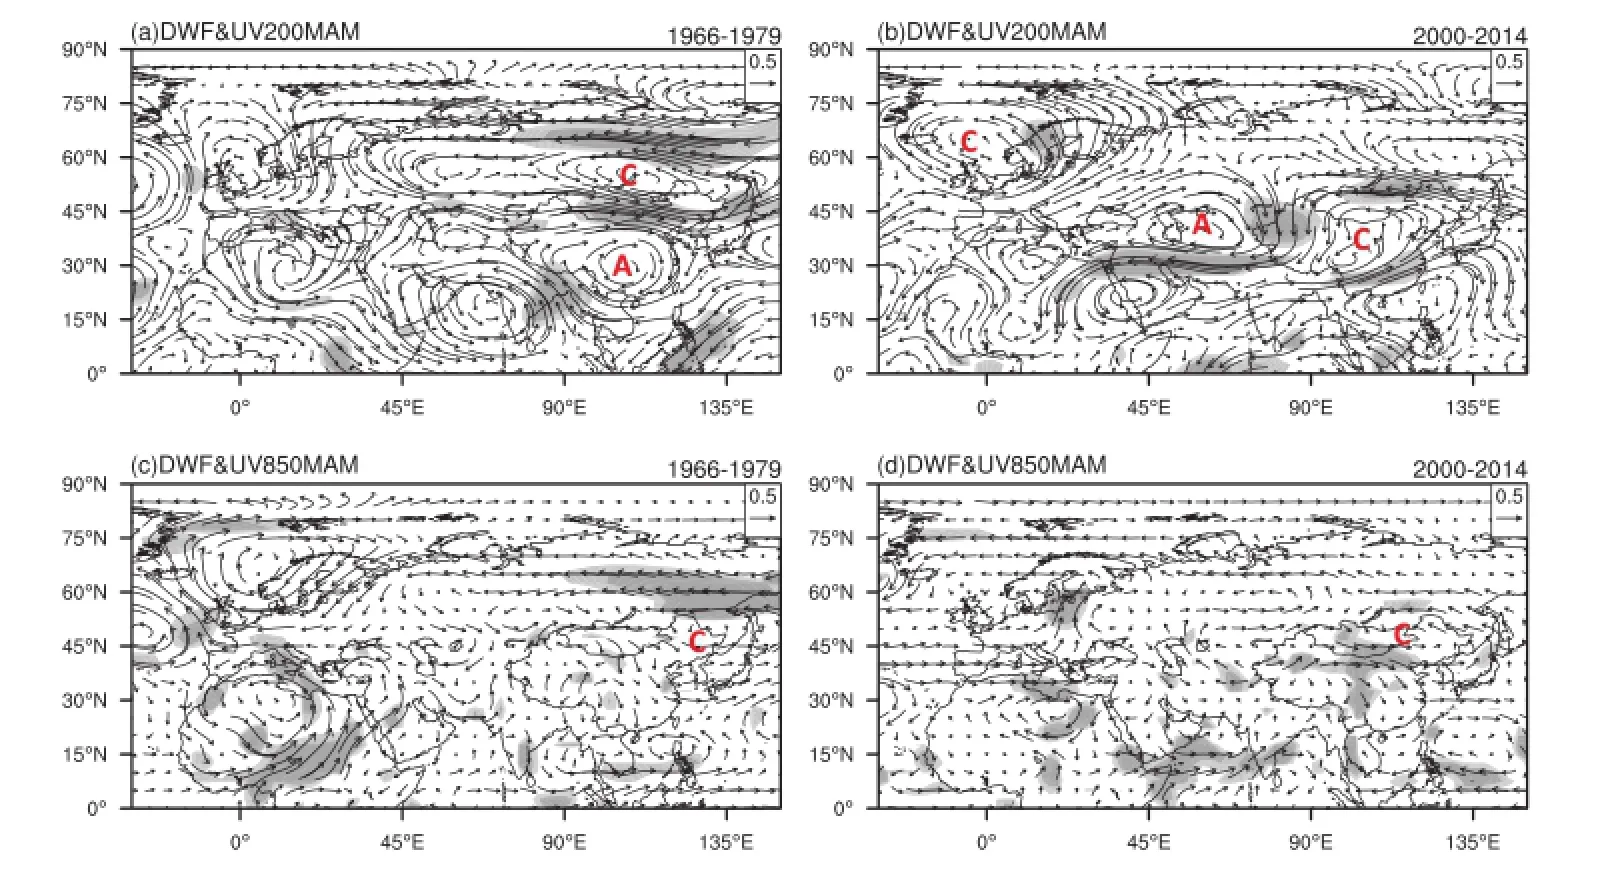
Figure 3.Regression of spring wind on the DWF index in (a, c) 1966-1979, and (b, d) 2000-2014 at (a, b) 200 hPa and (c, d) 850 hPa.

Figure 4.Regression of SST in (a) 1966-1979, and (b) 2000-2014.
But what about the linkage between the interannual variation of SSTs and dust-related atmospheric circulation in the two periods? As shown in Figure 4, associated with the increased DWF in P1, a negative SST anomaly (SSTA)occurs in the subtropics of the North Atlantic, persisting from winter to spring, which is related to the negative phase of the NAO (e.g. Rodwell and Rowell 1999). A so-called ‘North Atlantic horseshoe pattern,' with warm SST southeast of Newfoundland and cold SST to the northeast and southeast, precedes a positive phase of the NAO. The predictability of the winter NAO partly derives from the SSTA over the subtropical North Atlantic (Fan, Tian, and Wang 2015; Tian and Fan 2015). Meanwhile, the SSTA pattern over the North Pacifc is characterized by a positive SSTA extending from the subtropical North Pacifc to the South China Sea and a negative SSTA surrounding the other regions, which favors a strengthened east Asian jet. However, the North Pacifc SSTA may mainly refect the results of atmospheric forcing (Yang, Lau, and Kim 2001). On the other hand, corresponding to increased DWF in P2, a positive SSTA over the Barents Sea and a negative SSTA over the Norwegian Sea are apparent. Thus, we next focus on how the SSTA over the North Atlantic and Barents-Norwegian Sea may infuence the DWF-related atmosphere in the two periods.
We defne the NA1 index as the averaged SST in the subtropical North Atlantic (40-50°N, 25-45°W) in P1. NA2,meanwhile, is defned as the averaged SST over the Barents Sea (70-75°N, 30-40°E) minus the averaged SST over the Norwegian Sea (60-65°N, 0°-5°E) in P2, because an opposite change in SSTA between the two regions is prominentin the EOF SST between 50-80°N and 30°W-60°E (fgure not shown).
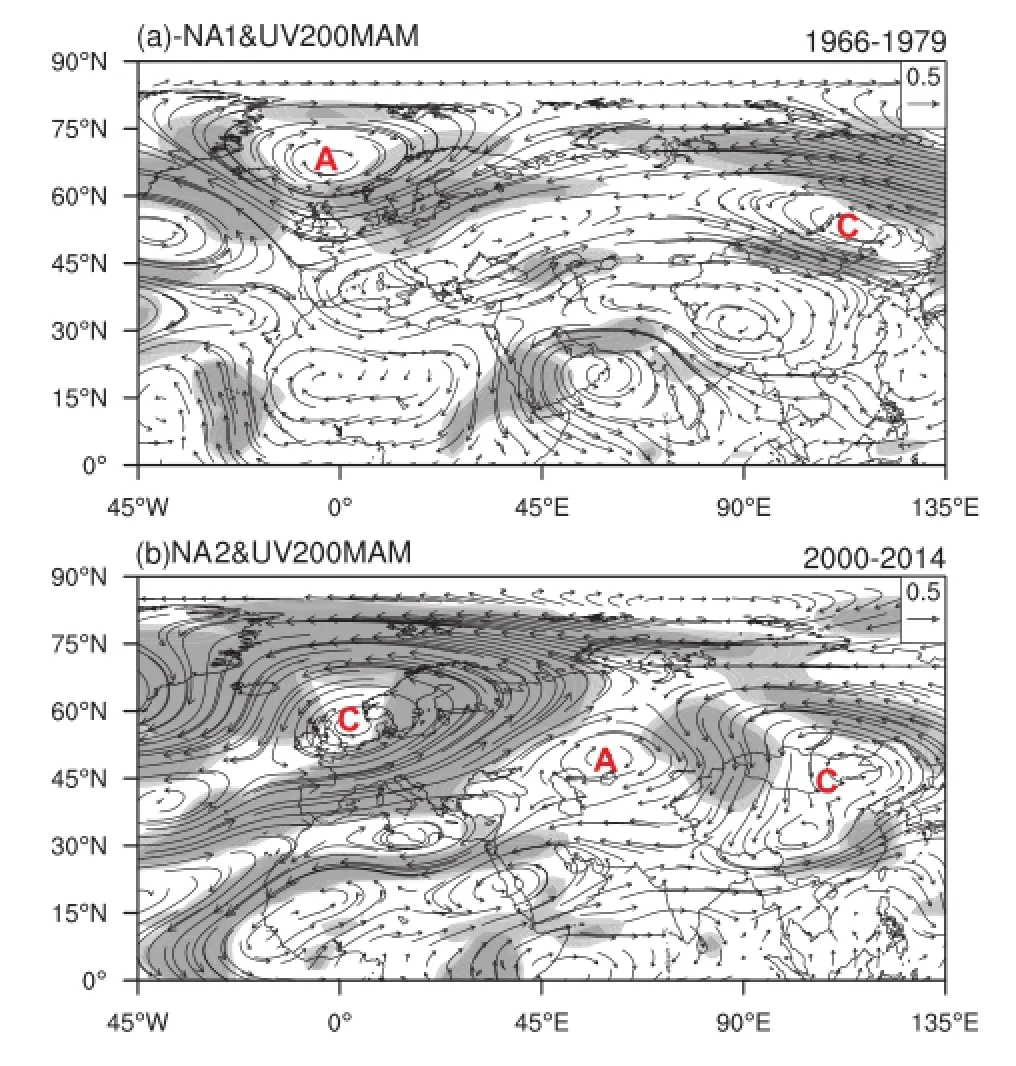
Figure 5.Regression of spring wind at 200 hPa on the (a) - NA1 index in 1966-1979, and (b) NA2 in 2000-2014.
In P1, the linear regression of the spring wind feld at 200 hPa on the - NA1 index shows a diferent anomalous anticyclone over Greenland and a cyclonic anomaly spanning from northern Russia to east of Lake Baikal (around 45-60°N, 0°-135°E), and the occurrence of a meridional wave-like pattern over East Asia (Figure 5(a)). When we calculate the linear regression of the spring 200-hPa geopotential height and wave activity fux (Plumb 1985) in the troposphere, it shows that anomalous adiabatic heating related to the subtropical North Atlantic excites a stationary Rossby wave propagating into Eurasia, forming the meridional teleconnection over East Asia (fgure not shown). In P2, by regression of the wind feld at 200 hPa on the NA2 index, a zonal wind pattern is seen to dominate from the high latitudes of Eurasia to East Asia, refecting the role of the extratropical ocean in the DWF in P2. However, the reasons for the change in the extratropical SST are highly complex, possibly being infuenced by the accelerated decrease in Arctic sea ice or sea-Arctic sea-ice interaction (Comiso et al. 2008; Liu et al. 2012; Li, Wang, and Gao 2015). Furthermore, according to the fndings of Liu et al. (2012), the atmospheric circulation related to the recent decline in Arctic sea ice shows much broader meridional meanders in the midlatitudes, possibly attributable to the occurrence of the meridional pattern in P2 and the zonal wave-like pattern in P2 (Figures 2(a), (b) and 3(a)).
4. Summary
This study reveals two high-DWF periods in northern China during the overall study period of 1966-2014, when the decreasing trend of DWF is removed; namely, 1966-1979(P1) and 2000-2014 (P2). Compared with P2, the intensity of DWF is much stronger in P1, together with the increased DWFs being mainly distributed in the central part of northern China and the south of Xinjiang. The results show a remarkable diference in mean atmospheric circulation and the global SST pattern between the two periods,including prominent changes in the polar regions. The magnitude of land-sea thermal contrast over East Asia can provide diferent dynamical conditions for the two high-DWF periods. Moreover, decreased spring precipitation over Mongolia and northern China in P1 may result in poor vegetation coverage over these regions. Actually,it was found that the sharp decrease of spring vegetation coverage over northern China in recent years was one of the major contributors to frequent spring dust storms over northern China during 2000 and 2001 (Zhou and Zhai 2004; Kurosaki, Shinoda, and Mikami 2011). In terms of the interannual variation of the two high-DWF periods, it is found that an upper-level meridional teleconnection in P1 is favorable for a strengthening of the East Asian westerly jet around 40-45°N, which can facilitate not only low-level cyclogenesis but also westerly momentum downward from the upper level (Uccellini 1986; Fan and Wang 2004). Thus, greater quantities of dust can be transported from Mongolia into northern China by the northwesterly fow. In P2, a zonal wave-like pattern at 200 hPa results in westerly fow from the southern part of the Mongolian cyclone,with most of the dust transported from the deserts of Xinjiang. The SSTA over the subtropical North Atlantic and extratropical ocean may induce, via sea-atmosphere interaction, the meridional and zonal wave-like patterns of P1 and P2, respectively, which is partly illustrated by the result of the regression of the wave activity fux in the troposphere on NA1 and NA2. However, the extratropical SST change in P2 might be the response of the rapidly declining Arctic Sea ice, and the atmospheric circulation related to the high-DWF in P2 might be related to change in the Pacifc Decadal Oscillation (Zhu et al. 2011). These questions will be explored in future work.
Disclosure statement
No potential confict of interest was reported by the authors.
Funding
This research was supported by the National Natural Science Foundation of China [grant numbers 41325018, 41575079,41421004].
Notes on contributors
FAN Ke is a professor at IAP, NZC. Her main research interests are climate dynamics, climate prediction. She has published over 70 scientifc papers, over 40 of which are SCI-indexed.
XIE Zhi-Ming is a masters student at IAP, NZC. His main research interests are dust climate and climate variability.
XU Zhi-Qing is a PH at IAP, NZC. His main research interests are climate variability.
References
Comiso, J. C., C. L. Parkinson, R. Gersten, and L. Stock. 2008. “Accelerated Decline in the Arctic Sea Ice Cover.”Geophysical Research Letters 35 (1): L01703. doi:http://dx.doi. org/10.1029/2007GL031972.
Fan, K., and H. J. Wang. 2004. “Antarctic Oscillation and the Dust Weather Frequency in North China.” Geophysical Research Letters 31 (10): L10201. doi:http://dx.doi.org/10. 1029/2004GL019465.
Fan, K., and H. J. Wang. 2006a. “The Interannual Variability of Dust Weather Frequency in Beijing and Its Global Atmospheric Circulation.” Chinese Journal of Geophysics 49: 890-897.
Fan, K., and H. J. Wang. 2006b. “Interannual Variability of Antarctic Oscillation and Its Infuence on East Asian Climate during Boreal Winter and Spring.” Science in China Series D 49(5): 554-560.
Fan, K., and H. J. Wang. 2007. “Dust Storms in North China in 2002: A Case Study of the Low Frequency Oscillation.”Advances in Atmospheric Sciences 24 (1): 15-23.
Fan, K., B. Q. Tian, and H. J. Wang. 2016. “New Approaches for the Skillful Prediction of the Winter North Atlantic Oscillation Based on Coupled Dynamic Climate Models.” International Journal of Climatology 36 (1): 82-94. doi:http://dx.doi.org/10.1002/ joc.4330.
Gong, D. Y., R. Mao, P. J. Shi, and Y. Fan. 2007. “Correlation between East Asian Dust Storm Frequency and PNA.”Geophysical Research Letters 34 (14): L14710. doi:http:// dx.doi.org/10.1029/2007GL029944.
Kalnay, E., M. Kanamitsu, R. Kistler, W. Collins, D. Deaven,L. Gandin, M. Iredell et al. 1996. “The NCEP/NCAR 40-year Reanalysis Project.” Bulletin of the American Meteorological Society 77: 437-471.
Kang, D. J., H. J. Wang, 2005: “Analysis on the Decadal Scale Variation of the Dust Storm in North China.” [In Chinese.]Science in China (Series D), 35 (11): 1096-1102.
Kurosaki, Y., and M. Mikami. 2003. “Recent Frequent Dust Events and Their Relation to Surface Wind in East Asia.”Geophysical Research Letters 30 (14): 1736. doi:http://dx.doi. org/10.1029/2003GL017261.
Kurosaki, Y., M. Shinoda, and M. Mikami. 2011. “What Caused a Recent Increase in Dust Outbreaks over East Asia?”Geophysical Research Letters 38 (11): L11702. doi:http:// dx.doi.org/10.1029/2011GL047494.
Lang, X. M. 2008. “Prediction Model for Spring Dust Weather Frequency in North China.” Science in China Series D: Earth Sciences 51: 709-720.
Lee, E. H., and B. J. Sohn. 2009.“Examining the Impact of Wind and Surface Vegetation on the Asian Dust Occurrence over Three Classifed Source Regions.” Journal of Geophysical Research 114(D6): D06205. doi:http://dx.doi.org/10.1029/2008JD010687.
Li, F., H. J. Wang, and Y. G. Gao. 2015. “Extratropical Ocean Warming and Winter Arctic Sea Ice Cover since the 1990s.”Journal of Climate 28: 5510-5522.
Liu, J. P., J. A. Curry, H. J. Wang, M. Song, and R. M. Horton. 2012.“Impact of Declining Arctic Sea Ice on Winter Snowfall.”Proceedings of the National Academy of Sciences 109: 4074-4079.
Plumb, R. A. 1985. “On the Three-dimensional Propagation of Stationary Waves.” Journal of the Atmospheric Sciences 42: 217-229.
Qian, W. H., L. S. Quan, and S. Y. Shi. 2002. “Variations of the Dust Storm in China and Its Climatic Control.” Journal of Climate 15: 1216-1229.
Rodwell, M. J., and D. P. Rowell. 1999. “Oceanic Forcing of the Wintertime North Atlantic Oscillation and European Climate.”Nature 398: 320-323.
Sun, J. M., M. Y. Zhang, and T. S. Liu. 2001. “Spatial and Temporal Characteristics of Dust Storms in China and Its Surrounding Regions, 1960-1999: Relations to Source Area and Climate.”Journal of Geophysical Research: Atmospheres 106: 10325-10333.
Tian, B. Q., and K. Fan. 2015. “A Skillful Prediction Model for Winter NAO Based on Atlantic Sea Surface Temperature and Eurasian Snow Cover.” Weather and Forecasting 30 (1): 197-205. doi:http://dx.doi.org/10.1175/WAF-D-14-00100.1.
Uccellini, L. W. 1986. “The Possible Infuence of Upstream Upperlevel Baroclinic Processes on the Development of the QE II Storm.” Monthly Weather Review 114: 1019-1027.
Wu, B. Y., and J. Wang. 2002. “Winter Arctic Oscillation, Siberian High and East Asian Winter Monsoon.” Geophysical Research Letters 29(19): 1897. doi:http://dx.doi.org/10.1029/2002GL015373.
Wu, Y. F., R. J. Zhang, Z. W. Han, and Z. M. Zeng. 2010. “Relationship between East Asian Monsoon and Dust Weather Frequency over Beijing.” Advances in Atmospheric Sciences 27: 1389-1398.
Yang, S., and K.-M. Lau, K.-M. Kim. 2001. “Variation of the East Asian Jet Stream and Asian-Pacifc-American Winter Climate Anomalies.” Journal of Climate 15: 306-324.
Zhang, R. J., Z. W. Han, M. X. Wang, and X. Y. Zhang. 2002. “Dust Storm Weather in China: New Characteristics and Origins.” [In Chinese.] Quaternary Sciences 22: 374-380.
Zhou, X. K., and P. M. Zhai. 2004. “Relationship between Vegetation Coverage and Spring Dust Storms over Northern China.” Journal of Geophysical Research 109 (D3): D03104. doi:http://dx.doi.org/10.1029/2003JD003913.
Zhu, C. W., B. Wang, and W. H. Qian. 2008. “Why Do Dust Storms Decrease in Northern China Concurrently with the Recent Global Warming?” Geophysical Research Letters 35 (18): L18702. doi:http://dx.doi.org/10.1029/2008GL034886.
Zhu, Y., H. Wang, W. Zhou, and J. Ma. 2011. “Recent Changes in the Summer Precipitation Pattern in East China and the Background Circulation.” Climate Dynamics 36: 1463-1473.
北方沙尘; 经向遥相关; 纬向波列; 北大西洋海温
29 February 2016
CONTACT FAN Ke fanke@mail.iap.ac.cn
© 2016 The Author(s). Published by Informa UK Limited, trading as Taylor & Francis Group.
This is an Open Access article distributed under the terms of the Creative Commons Attribution License (http://creativecommons.org/licenses/by/4.0/), which permits unrestricted use,distribution, and reproduction in any medium, provided the original work is properly cited.
猜你喜欢
橡胶科技(2022年5期)2022-07-20
海洋通报(2021年3期)2021-08-14
大气科学学报(2021年3期)2021-08-04
海洋通报(2021年1期)2021-07-23
成都信息工程大学学报(2021年2期)2021-07-22
探索科学(学术版)(2021年2期)2021-04-22
应用气象学报(2020年6期)2020-10-28
高原山地气象研究(2020年3期)2020-07-16
热带海洋学报(2020年3期)2020-05-25
中国水运(2020年2期)2020-05-18
 Atmospheric and Oceanic Science Letters2016年4期
- Atmospheric and Oceanic Science Letters的其它文章
- A decadal abruption of midwinter storm tracks over North Pacific from 1951 to 2010
- Comparison of convective parameterizations in RegCM4 experiments over China with CLM as the land surface model
- Chemical characterization of submicron particles during typical air pollution episodes in spring over Beijing
- Pressure gradient errors in a covariant method of implementing the σ-coordinate: idealized experiments and geometric analysis
- Biogenic isoprene emissions over China: sensitivity to the CO2inhibition effect
- The link between the Victoria mode in the preceding boreal winter and spring precipitation over the southeastern USA and Gulf of Mexico