
Biogenic isoprene emissions over China: sensitivity to the CO2inhibition effect
2016-11-23 03:30FUYundLIAOHong
FU Yund LIAO Hong
aClimate Change Research Center (CCRC), Chinese Academy of Sciences, Beijing, China;bSchool of Environmental Science and Engineering,Nanjing University of Information Science & Technology, Nanjing, China
Biogenic isoprene emissions over China: sensitivity to the CO2inhibition effect
FU Yuaand LIAO Hongb
aClimate Change Research Center (CCRC), Chinese Academy of Sciences, Beijing, China;bSchool of Environmental Science and Engineering,Nanjing University of Information Science & Technology, Nanjing, China
Isoprene emissions emitted from vegetation are one of the most important precursors for tropospheric ozone and secondary organic aerosol formation. The authors estimate the biogenic isoprene emissions in China over 2006-2011 using a global chemical transport model (GEOSChem) driven by meteorological felds from the assimilated meteorological data from MERRA. The authors incorporate three diferent parameterizations of isoprene-CO2interaction into the model,and perform three sensitivity simulations to investigate the efect of CO2inhibition on isoprene emissions for the period 2006-2011 in China. The annual isoprene emissions rate across China is simulated to be 12.62 Tg C yr-1, averaged over 2006-2011, and decreases by about 2.7%-7.4% when the CO2inhibition schemes are included. The CO2inhibition efect might be signifcant in regions where the CO2concentration and isoprene emissions are high. Estimates of isoprene emissions can difer depending on the scheme of CO2inhibition. According to the results obtained from the sensitivity simulations, the authors fnd that the CO2inhibition efect leads to 5.6% ± 2.3% reductions in annual isoprene emissions over China. The authors also fnd that inclusion of CO2inhibition can substantially alter the sensitivity of isoprene emissions to the changes in meteorological conditions during the study period.
ARTICLE HISTORY
Revised 5 January 2016
Accepted 1 April 2016
Isoprene emissions; CO2;
inhibition; GEOS-Chem model
陆地植被排放的异戊二烯是对流层臭氧及二次有机气溶胶的形成重要前体物之一。已有研究表明,当CO2浓度超过一定水平时可能使得叶片气孔关闭,对叶片释放异戊二烯产生直接的抑制作用。而这一影响机制在目前大多数异戊二烯排放估算时并没有考虑在内,对其排放的估算仍存在很大的不确定性。本文基于GEOS-Chem及其耦合的MEGAN模式模拟了2006-2011年中国异戊二烯的排放变化。通过引入三种不同CO2抑制作用参数化因子的模拟试验,定量评估了CO2抑制作用对异戊二烯排放的影响及不确定性。结果表明:考虑CO2抑制参数因子后,中国年平均异戊二烯的排放量平均减少了5.6% ± 2.3%。不同参数化方案对排放的抑制程度存在差异。CO2对异戊二烯排放的影响将会改变其对气象条件变化的敏感性,从而影响空气质量。
1. Introduction
Isoprene is a volatile organic compound (VOC) mainly emitted from terrestrial vegetation, and it makes up the largest fraction of non-methane biogenic VOCs, with an estimated emissions rate of 400-600 Tg C yr-1at the global scale (Guenther et al. 2006; Arneth et al. 2008). In polluted regions, biogenic isoprene emissions are an important contributor to tropospheric ozone formation in the presence of nitrogen oxides (NOx), but in remote regions with low-NOxconcentration, isoprene could reduce ozone by sequestering NOxas isoprene nitrate or by ozonolysis(Fiore et al. 2012). In addition, isoprene acts as a major precursor for secondary organic aerosol (SOA) formation,and can afect the atmospheric oxidation capacity through infuencing the regional level of tropospheric hydroxyl radicals (OH) and the lifetime of methane (Peñuelas and Staudt 2010). Therefore, changes in isoprene emissions could modulate atmospheric composition and chemistry. An accurate estimate of isoprene emissions is important for air quality and climate change studies, and thus warrants in-depth investigation.
Many previous studies have shown that biogenic isoprene emissions are not only dependent on changes in environmental factors, such as canopy temperature, light,soil moisture etc., but also related to changes in vegetation type, vegetation distribution, leaf area, and leaf age(Guenther et al. 2006). Some recent studies have reported that changes in atmospheric CO2concentration mightpromote or limit isoprene emissions from vegetation. Increasing CO2concentration could enhance vegetation productivity (Piao et al. 2011), and hence indirectly promote isoprene emissions. However, it is unclear whether a raised atmospheric CO2concentration would increase isoprene emissions intrinsically (Peñuelas and Staudt 2010). Several laboratory and feld studies have indicated that the isoprene emissions rate has an inverse relationship in response to rising CO2concentration in the short and long term because an elevated CO2concentration might uncouple isoprene emissions from photosynthesis and suppress isoprene emissions at leaf level (Rosenstiel et al. 2003; Possell, Hewitt, and Beerling 2005) (known as ‘the CO2-inhibition efect').
A number of previous studies have attempted to introduce the CO2-inhibition efect into chemical transport models for examining the impact of climate change on isoprene emissions, although the relationship between CO2and isoprene is not fully understood (Arneth et al. 2007;Heald et al. 2009; Wilkinson et al. 2009; Lathière, Hewitt,and Beerling 2010; Possell and Hewitt 2010). Arneth et al.(2007) found that observed leaf isoprene emissions were reproduced well by implementing the isoprene response to CO2concentration into the model used in their study,which is expressed as the ratio of the leaf internal CO2concentration at ambient CO2= 370 ppmv to the leaf internal CO2concentration. They also suggested the CO2-inhibition efect could be large enough to counteract the increases in isoprene emissions due to CO2-induced enhancement of vegetation productivity and leaf area growth. According to the isoprene measurements taken from aspen trees growing under four diferent CO2concentrations, Wilkinson et al. (2009) proposed a sigmoidal, Hill-reaction type isoprene-CO2curve to describe the short-term and longterm isoprene response to changes in atmospheric CO2. Heald et al. (2009) used a global coupled land-atmosphere model with the CO2-isoprene parameterization of Wilkinson et al. (2009) to explore the potential role of CO2in isoprene emissions over 2000-2100. They suggested the projected increases in isoprene emissions due to the warming climate in 2100 could be signifcantly modifed by including the CO2inhibition efect. Recently, Possell and Hewitt (2010) improved the isoprene-CO2response curve by considering a wide range of tree species from tropical to temperate regions. The aforementioned studies indicate the important impacts of changes in atmospheric CO2concentration on isoprene emissions simulation, but large discrepancies remain among these isoprene-CO2relationships and related parameters. Such diferences can result in diferent isoprene emissions predictions. Recently,a number of studies have examined biogenic emissions in China (Li et al. 2012; Li, Chen, and Xie 2013; Fu and Liao 2014; Li and Xie 2014). However, those studies were mostly focused on the estimation and spatiotemporal variation of biogenic VOC emissions, and investigating the roles of meteorological factors and vegetation parameters in biogenic emissions. No previous studies have quantifed the impact of CO2concentration on isoprene emissions in China, or evaluated the uncertainty of the CO2-inhibition efect.
In this study, we use a global chemical transport model(GEOS-Chem) to estimate the biogenic isoprene emissions in China over 2006-2011, and examine the efect of CO2inhibition on regional isoprene emissions. We quantify the CO2-inhibition efect on the simulation of isoprene emissions and the uncertainty in comparison with diferent CO2inhibition parameterizations in the model, based on previous studies. We further discuss the implications for regional air quality due to the inclusion of CO2inhibition efects on isoprene emissions.
2. Model and methods
We use the GEOS-Chem global 3D chemical transport model, version 9-02 (http://acmg.seas.harvard.edu/geos/)to simulate the biogenic isoprene emissions in China over 2006-2011. The model is driven by the assimilated meteorological data from MERRA (http://gmao.gsfc.nasa.gov/ merra/), with a horizontal resolution of 2.0° latitude × 2.5° longitude and a reduced vertical resolution of 47 levels. A similar modelling framework was used by Fu and Tai (2015). In GEOS-Chem, biogenic isoprene emissions are calculated by the Model of Emissions of Gases and Aerosols from Nature (MEGAN v2.1) (Guenther et al. 2006, 2012), which is estimated as a function of plant functional type-specifc emission factors (E0, μg C m-2h-1) modulated by environmental activity factors (normalized ratio) to account for the efects of temperature (γT), light (γp), leaf age (γage) ,LAI, soil moisture (γsm) and CO2concentration (γCO2). The biogenic isoprene emissions rate (E) in each model grid cell is computed as

However, the default model does not consider the efect of soil moisture and CO2inhibition by settingγsm=1 and γCO2=1. To account for the CO2-inhibition efect,the empirical relationships between CO2concentration and the isoprene emissions rate from previous studies are applied in this work. For examining the impact of CO2inhibition on isoprene simulation, we perform four sets of simulations: [noCO2_ctrl], [wCO2_A], [wCO2_W],and [wCO2_P]. For each set, a six-year simulation is performed with meteorological felds from 2006 to 2011, present-day vegetation parameters and fxed anthropogenic emissions at year-2005 levels (Streets et al. 2003; Zhang et al. 2009). The simulation [noCO2_ctrl] is the controlsimulation without the CO2-inhibition efect. The simulations [wCO2_A], [wCO2_W], and [wCO2_P] are the sensitivity simulations, which are similar to [noCO2_ctrl] but with diferent CO2-inhibition parameterizations. In the simulation [wCO2_A], the empirical CO2-isoprene relationship is from Arneth et al. (2007) (Equation (2)); and in the simulation [wCO2_W], the CO2inhibition parameterization of Wilkinson et al. (2009) is used (Equation (3)). The simulation[wCO2_P] applies the CO2-inhibition efect given by Possell and Hewitt (2010) (Equation (4)). The CO2concentrations used for calculating the γCO2in all the simulations are from the GEOS-Chem CO2simulation during the same period.
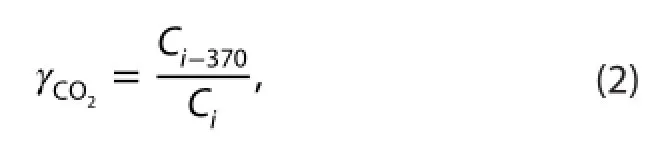
As shown in Arneth et al. (2007), the additional activity factor associated with the CO2suppressed efect can be modelled in Equation (2): where Ciis the leaf internal CO2concentration, and Ci-370is the leaf internal concentration at ambient CO2= 370 ppmv(under non-water-stressed conditions). According to Possell, Hewitt, and Beerling (2005),Ciis about 70% of the ambient CO2concentration (Ca).
We also apply the isoprene-CO2relationship from Wilkinson et al. (2009), which is
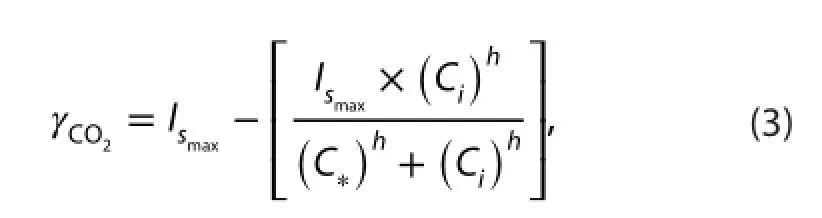
where Isis the isoprene emissions rate,Ismaxis the estimated asymptote at which further decreases in CO2concentration (Ci) would suppress isoprene emissions, andC∗and h are the Hill-type coefcients used to adjust the sigmoidal slope of the relationship between Isand Ci. In this study,the Ismax, C∗, and h are determined from the measurements of plants grown at four diferent CO2concentrations (400,600, 800, and 1200 ppmv), by best-ft lines. The parameters are obtained from Wilkinson et al. (2009, Table 1).
The third normalized ratio to account for the efect of CO2concentration is provided by Possell and Hewitt(2010),

where γCO2=1at a CO2concentration equal to 370 ppmv,and a and b are empirical coefcients. Here, we use the ftting parameters a = 8.9406 and b = 0.0024 ppm-1, which are provided in Possell and Hewitt (2010, Figure 5).
3. Results
Without the CO2efect ([noCO2_ctrl]), the simulated annual isoprene emissions rate averaged over 2006-2011 across China is about 12.62 Tg C yr-1. The annual isoprene emissions rate simulated in this study is within the range of 9.3-23.4 Tg C yr-1reported for China (Fu and Liao 2012;Li, Chen, and Xie 2013). Isoprene emissions are highest in summer (June-July-August, JJA) and lowest in winter (December-January-February, DJF). The isoprene emissions in DJF, MAM (March-April-May), JJA, and SON(September-October-November) account for 4.8%, 18.5%,55.0%, and 21.7% of the annual emissions, respectively(Table 1). Figure 1(a) shows the spatial distribution of summertime and annual mean isoprene emissions from the[noCO2_ctrl] simulation averaged over 2006-2011. We fnd that, largely, isoprene emissions are simulated over southern (south of 35°N) and northeastern China in summer,which are within the range of 10-40 mg C m-2d-1, and mostly attributable to the increases in temperature and vegetation density. In addition, the spatial distribution of isoprene emissions is generally consistent with the distribution of trees in China, as trees are considered the highest isoprene emitter, compared with other vegetation types such as crops and grass.
We fnd that the spatial patterns of CO2efects on isoprene emissions are similar over China, despite the amount of infuence exhibiting some discrepancies among the three diferent CO2-inhibition parameterizations (Figure 1(b-d)). As shown in Figure 1, the CO2efect can substantially reduce isoprene emissions in summer in most of eastern China, especially in the eastern regions of Sichuan Province and southeastern China. The strong reductions in isoprene emissions in those regions are primarily due to the atmospheric CO2concentrations in those regions being generally higher than in other regions. As reportedby a number of laboratory-based studies, when CO2changes within the range of 200-1200 ppmv, trees grown at lower CO2concentrations exhibit signifcantly higher isoprene emission rates compared with those grown at higher CO2concentrations (Possell, Hewitt, and Beerling 2005; Wilkinson et al. 2009). The plant physiological and biochemical mechanisms responsible for the CO2suppression of isoprene emissions are poorly understood, but likely relate to the changes in the substrates for isoprene biosynthesis and metabolism at leaf level under increased CO2concentrations (Rosenstiel et al. 2003). In the eastern regions of Sichuan Province and parts of southeastern China, isoprene emissions decline by more than 9% to a maximum of -3.5 mg C m-2d-1in summer when the CO2-inhibition efects are included, indicating the importance of the CO2-inhibition efect on estimates of isoprene emissions. The consideration of CO2inhibition reduces annual isoprene emissions by around 2.7%-7.4% (Table 1).
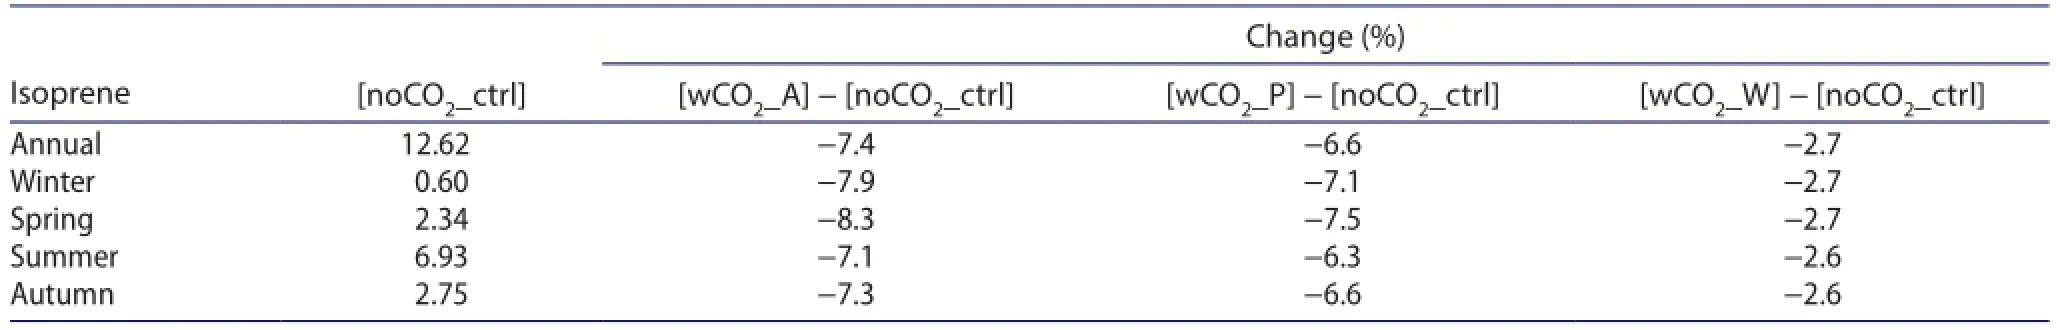
Table 1.Estimates of isoprene emission rates in China averaged over 2006-2011 (Tg C yr-1). Also shown are the percentage changes of isoprene emissions (%) between the experiments with ([wCO2_A], [wCO2_P], and [wCO2_W]) and without ([noCO2_ctrl]) the CO2-inhibition efect.
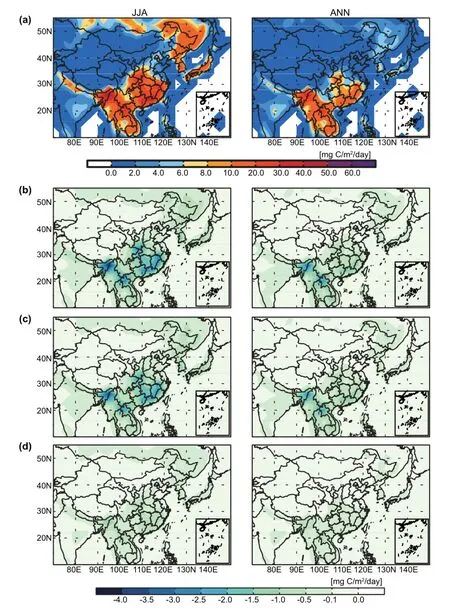
Figure 1.(a) Simulated summertime (left column) and annual (right column) biogenic isoprene emissions averaged over 2006-2011 in China in [noCO2_ctrl]. (b) Spatial distribution of changes in isoprene emissions as a result of the CO2-inhibition efect using the scheme of Arneth et al. (2007) ([wCO2_A] - [noCO2_ctrl]). (c) As in (b) but with the scheme of Possell and Hewitt (2010) ([wCO2_P] - [noCO2_ctrl]).(d) As in (b) but with the scheme of Wilkinson et al. (2009) ([wCO2_W] - [noCO2_ctrl]).
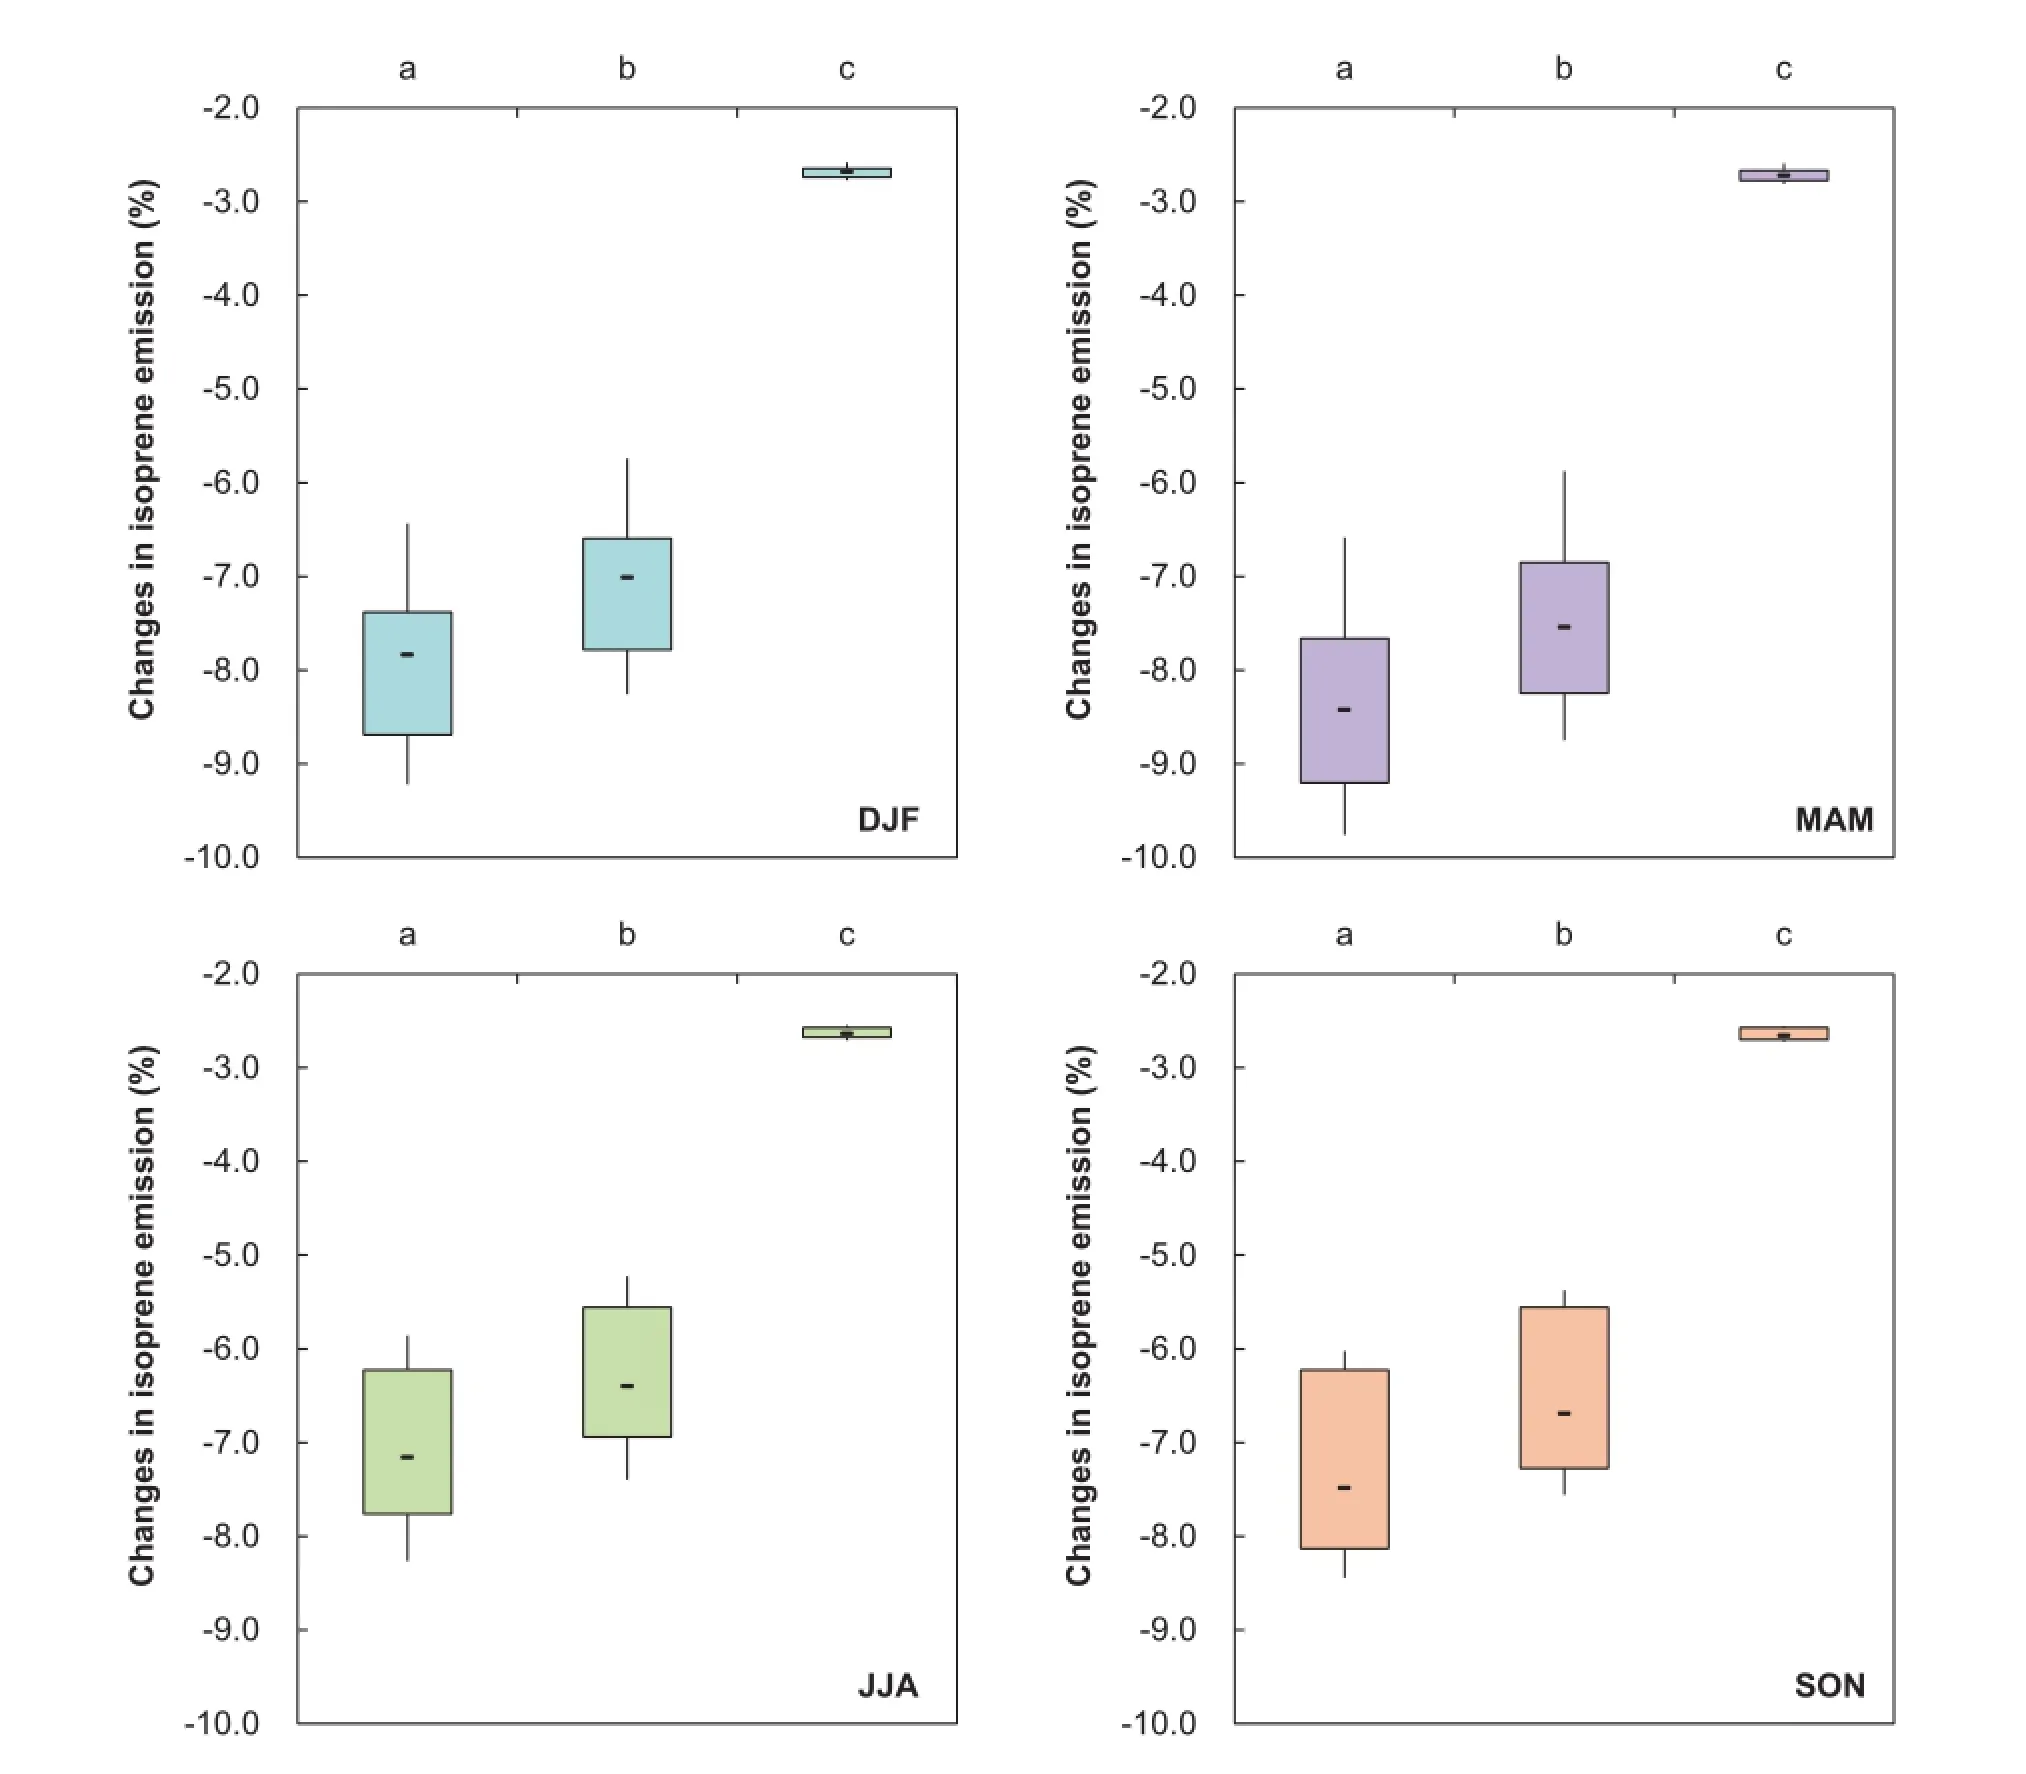
Figure 2.Box-plots for the annual variations of the CO2-inhibition efect on seasonal isoprene emissions in China from three diferent parameterizations of the isoprene-CO2relationship during the years 2006-2011.
Figure 2 represents the efects of CO2inhibition on seasonal isoprene emissions over China during 2006-2011 from [wCO2_A] - [noCO2_ctrl], [wCO2_P] - [noCO2_ctrl],and [wCO2_W] - [noCO2_ctrl]. In all seasons, the maximum reduction in isoprene emissions due to the CO2efect is obtained in [wCO2_A], followed by [wCO2_P] and [wCO2_W]. The CO2efect on isoprene emissions exhibits little seasonal variation in all sensitivity simulations. However, the changes in isoprene emissions resulting from CO2inhibition display interannual variation during 2006-2011, except those in[wCO2_W]. In [wCO2_A], the isoprene emissions in DJF over China decrease by -7.8% (median value) when taking into account CO2inhibition, and the decline in isoprene emissions in MAM due to CO2inhibition varies from -9.8% to-6.6%, with a median of -8.4%. In JJA and SON, the CO2efect leads to a decrease in isoprene emissions of -8.5% to -6.0% in [wCO2_A] over 2006-2011. The reductions in isoprene emissions induced by the CO2efect in [wCO2_P]are similar to the results of [wCO2_A]. We also fnd that the interannual variation in isoprene emissions, induced by the efect of CO2inhibition, is quite important compared to the impact of land-cover and land-use change. As shown by Fu and Liao (2012), simulated isoprene emissions in summer over eastern China change by 5%-8% as a result of vegetation change alone over 2001-2006.
As shown above, estimates of isoprene emissions can difer depending on the CO2-isoprene response curve,which also represents a major source of uncertainty in projecting future isoprene emissions as the atmospheric CO2concentration continues to rise. The discrepancies in the three CO2-isoprene relationships likely result from the diferences in quantitative algorithms and empirical coefcients, which are obtained from diferent plant species in growth-chamber experiments. For example, some studies describe the response as a purely mathematical relationship based on the experimental growth of two isoprene-emitting herbaceous species under diferent CO2levels (Possell, Hewitt, and Beerling 2005; Arneth et al. 2007). Whereas, Wilkinson et al. (2009) constructed an empirical relationship through consideration of the principles of enzyme kinetics based on the measured responses of temperate cottonwood and aspen trees under controlled-environment growth chambers. Possell and Hewitt (2010) attempted to defne the CO2-inhibition efect using laboratory measurements of tropical tree species (Acacia nigrescens). In order to better understand the calculated CO2inhibition in the model, we further quantify the CO2-inhibition efect and its uncertainty according to the results of the sensitivity simulations. As shown in Figure 3, in the presence of CO2-isoprene interaction, the annual present-day (2006-2011) isoprene emissions over China reduce by 5.6% ± 2.3%, while the isoprene emissions in DJF, MAM, JJA, and SON are cut by 5.9% ± 2.5%,6.2% ± 2.7%, 5.3% ± 2.1%, and 5.5% ± 2.2%, respectively.
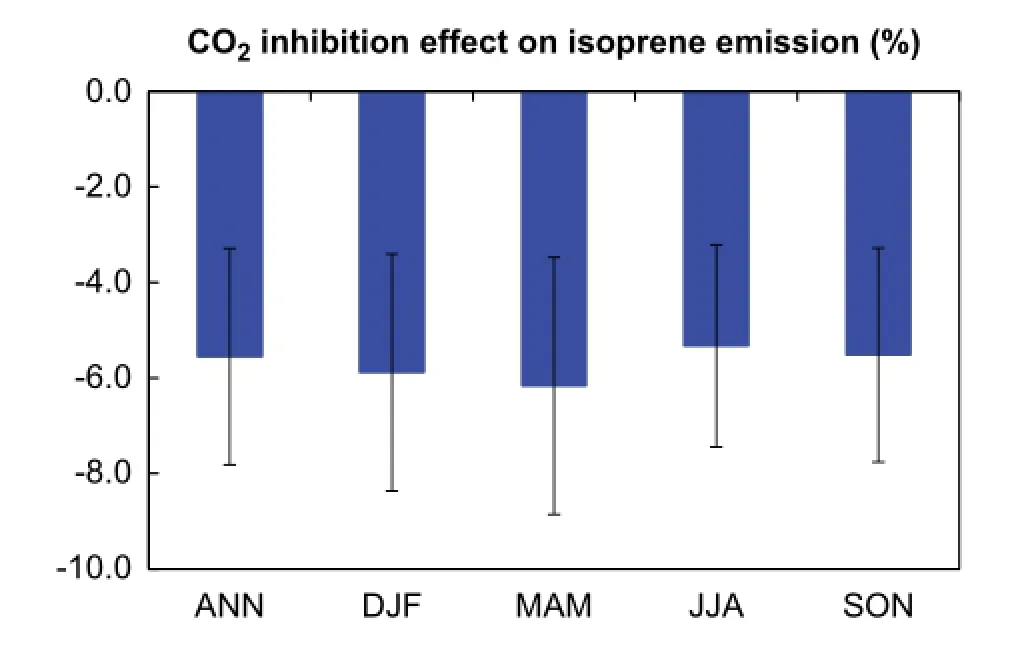
Figure 3.Estimates of the CO2-inhibition efect on isoprene emissions from existing parameterizations in the model.
The signifcance of the variations induced by CO2inhibition can also be demonstrated when compared with the changes in isoprene emissions resulting from climate change alone. For instance, without the CO2efect,changes in meteorological conditions between the two three-year periods of 2006-2008 and 2009-2011 enhances summertime isoprene emissions by about 50 Gg C/ month in China (1 Gg = 109g) (isoprene averaged over 2009-2011 minus isoprene averaged over 2006-2008). However, inclusion of the CO2efect can partly ofset such increases or even reverse the sign. The simulated summertime isoprene increment from the period 2006-2008 to the period 2009-2011 on average shrinks by 20% when the CO2efect is considered in [wCO2_W], while the CO2efect in [wCO2_A] and [wCO2_P] can completely nullify such an increase and lead to 70 Gg C/month and 60 Gg C/month reductions in isoprene emissions, respectively. The results in this study imply that the inclusion of CO2inhibition can substantially afect the sensitivity of isoprene emissions to changes in meteorological conditions. The impact of CO2inhibition can be more signifcant on multi-decadal scales than the magnitudes reported here. Recently, a few studies have indicated that the inclusion of CO2inhibition would generally reduce the sensitivity of air pollution to climate and vegetation change under future projection. Tai et al.(2013) reported that, over 2000-2050, the inclusion of CO2inhibition leads to reduced sensitivity of surface ozone and SOA (by more than 50%) to climate and natural vegetation change where isoprene emissions are important, implying a beneft of air quality in populated, high-NOxregions.
4. Discussion and conclusions
A global transport model (GEOS-Chem) is used in this study to simulate the isoprene emissions over China, with the inclusion of CO2-isoprene interaction, from 2006 to 2011. Without the CO2-inhibition efect, the simulated isoprene emissions rate is approximately 12.62 Tg C yr-1across China. To quantify the impact of CO2inhibition on isoprene emissions, three estimates of isoprene emissions with different parameterizations of the CO2-isoprene response are compared. The results indicate that the CO2-inhibition efect, which is not included in most chemistry or climate modelling studies, is signifcant in estimating isoprene emissions. For instance, applying the Wilkinson et al. (2009)scheme in [wCO2_W] decreases annual isoprene emissions by ~3% relative to the control simulation ([noCO2_ctrl])without CO2inhibition. Whereas, applying the CO2inhibition scheme of Arneth et al. (2007) in [wCO2_A] and Possell and Hewitt (2010) in [wCO2_P] reduces annual isoprene emissions by ~7% over China. This efect might be signifcant in regions where the CO2concentration and isoprene emissions are high. To summarize, the impact of CO2inhibition can lead to an annual isoprene emissions decrease of 5.6% ± 2.3%. Regionally, summertime isoprene emissions might be cut by more than 9% when the CO2-inhibition efect is included. Compared with the changes in isoprene emissions resulting from climate change alone on the multi-decadal scale, the reductions in isoprene emissions induced by CO2inhibition are signifcant. Sensitivity studies have shown that, in China, changes in meteorological conditions between the late 1980s and mid-2000s led to increases in isoprene emissions by 17% (Fu and Liao 2014). The changes in isoprene emissions resulting from climate change can be modifed if the CO2inhibition is accounted for in the model.
There are a few studies that have indicated that the CO2-isoprene efect might have a potential infuence for projected ozone air quality or SOA concentrations under future climate change scenarios (Young et al. 2009; Tai et al. 2013), because they are both sensitive to the spatial and temporal variations of biogenic isoprene emissions (Fu and Liao 2012). In this study, the inclusion of CO2inhibition may lead to a reduction in SOA concentrations (by ~10%)where isoprene emissions largely decrease. Future work should focus on a more systematic analysis of the variation of in ozone and SOA to CO2-isoprene integration under climate change. However, the CO2-isoprene response curves are built on a limited number of measurements for several species in earlier studies, so the parameterizations of CO2-isoprene interaction still pose a challenge for accurate estimates of isoprene emissions in China at present. In addition, a few previous experimental studies pointed out that inhibition of the isoprene emissions rate occurs in the presence of an increased CO2concentration for both short-term exposure (seconds to minutes) and long-term exposure (weeks to months). The responses of isoprene emissions to changes in CO2concentration might be diferent on various time scales. For instance, the response of isoprene emissions might be driven by adjustments in existing metabolic components during a single day. Whereas, on time scales at which leaves develop and grow(weeks or months), the response of isoprene emissions is likely driven by the adjustments in gene expression and the production of new metabolic components (Wilkinson et al. 2009). Here, we only focus on the efects of CO2inhibition on monthly and seasonal isoprene emissions, rather than diurnal isoprene emissions, mostly because the changes in sub-ambient CO2concentration (intercellular CO2) over shorter time scales are scarce. The short-term efect of CO2inhibition on daily isoprene emissions is still a challenge and full of large uncertainty, especially in China. Wilkinson et al. (2009) reported that the sensitivity of the isoprene emissions rate to intercellular CO2could decrease with long-term exposure to increased atmospheric CO2if the intercellular CO2concentration changes between 200 and 400 ppmv. Since the diurnal variation of isoprene emissions is strong, the diurnal efect of CO2concentration on isoprene emissions defnitely warrants further investigation. More specifc information on, and measurements of, extensive and representative plant species from major isoprenerelease regions are required to improve CO2-isoprene parameterization in future studies in China.
Acknowledgements
The MERRA data used in this study were provided by the Global Modeling and Assimilation Ofce (GMAO) at the NASA Goddard Space Flight Center through the NASA GES DISC online archive.
Funding
This work was supported by the National Natural Science Foundation of China [grant number 41405138]; the National High Technology Research and Development Program of China[grant number 2013AA122002].
References
Arneth, A., R. K. Monson, G. Schurgers, U. Niinemets, and P. I. Palmer. 2008. “Why Are Estimates of Global Terrestrial Isoprene Emissions So Similar (and Why is This Not So for Monoterpenes)?” Atmospheric Chemistry and Physics 8: 4605-4620. doi:http://dx.doi.org/10.5194/acp-8-4605-2008.
Arneth, A., Ü. Niinemets, S. Pressley, J. Bäck, P. Hari, T. Karl, S. Noe,et al. 2007. “Process-Based Estimates of Terrestrial Ecosystem Isoprene Emissions: Incorporating the Efects of a Direct CO2-Isoprene Interaction.” Atmospheric Chemistry and Physics 7: 31-53. doi:http://dx.doi.org/10.5194/acp-7-31-2007.
Fiore, A. M., V. Naik, D. V. Spracklen, A. Steiner, N. Unger,M. Prather, D. Bergmann, et al. 2012. “Global Air Quality and Climate.” Chemical Society Reviews 41: 6663-6683. doi:http:// dx.doi.org/10.1039/C2CS35095E.
Fu, Y., and H. Liao. 2012. “Simulation of the Interannual Variations of Biogenic Emissions of Volatile Organic Compounds in China: Impacts on Tropospheric Ozone and Secondary Organic Aerosol.” Atmospheric Environment 59: 170-185. doi:http://dx.doi.org/10.1016/j.atmosenv.2012.05.053.
Fu, Y., and H. Liao. 2014. “Impacts of Land Use and Land Cover Changes on Biogenic Emissions of Volatile Organic Compounds in China from the Late 1980s to the mid-2000s: Implications for Tropospheric Ozone and Secondary Organic Aerosol.” Tellus B 66: 24987. doi:http://dx.doi.org/10.3402/ tellusb.v66.24987.
Fu, Y., and A. P. K. Tai. 2015. “Impact of Climate and Land Cover Changes on Tropospheric Ozone Air Quality and Public Health in East Asia between 1980 and 2010.” Atmospheric Chemistry and Physics 15: 10093-10106. doi:http://dx.doi. org/10.5194/acp-15-10093-2015.
Guenther, A. B., X. Jiang, C. L. Heald, T. Sakulyanontvittaya, T. Duhl,L. K. Emmons, and X. Wang. 2012. “The Model of Emissions of Gases and Aerosols from Nature Version 2.1 (MEGAN2.1): An Extended and Updated Framework for Modeling Biogenic Emissions.” Geoscientific Model Development 5: 1471-1492. doi:http://dx.doi.org/10.5194/gmd-5-1471-2012.
Guenther, A., T. Karl, P. Harley, C. Wiedinmyer, P. I. Palmer, and C. Geron. 2006. “Estimates of Global Terrestrial Isoprene Emissions Using MEGAN (Model of Emissions of Gases and Aerosols from Nature).” Atmospheric Chemistry and Physics 6: 3181-3210. doi:http://dx.doi.org/10.5194/acp-6-3181-2006.
Heald, C. L., M. J. Wilkinson, R. K. Monson, C. A. Alo, G. Wang,and A. Guenther. 2009. “Response of Isoprene Emission to Ambient CO2Changes and Implications for Global Budgets.”Global Change Biology 15: 1127-1140. doi:http://dx.doi. org/10.1111/j.1365-2486.2008.01802.x.
Lathière, J., C. N. Hewitt, and D. J. Beerling. 2010. “Sensitivity of Isoprene Emissions from the Terrestrial Biosphere to 20th Century Changes in Atmospheric CO2Concentration,Climate, and Land Use.” Global Biogeochemical Cycles 24: GB1004. doi:http://dx.doi.org/10.1029/2009gb003548.
Li, L. Y., Y. Chen, and S. D. Xie. 2013. “Spatio-Temporal Variation of Biogenic Volatile Organic Compounds Emissions in China.”Environmental Pollution 182: 157-168. doi:http://dx.doi. org/10.1016/j.envpol.2013.06.042.
Li, M., X. Huang, J. Li, and Y. Song. 2012. “Estimation of Biogenic Volatile Organic Compound (BVOC) Emissions from the Terrestrial Ecosystem in China Using Real-Time Remote Sensing Data.” Atmospheric Chemistry and Physics Discussion 12: 6551-6592. doi:http://dx.doi.org/10.5194/acpd-12-6551-2012.
Li, L. Y., and S. D. Xie. 2014. “Historical Variations of Biogenic Volatile Organic Compound Emission Inventories in China,1981-2003.” Atmospheric Environment 95: 185-196. doi:http:// dx.doi.org/10.1016/j.atmosenv.2014.06.033.
Peñuelas, J., and M. Staudt. 2010. “BVOCs and Global Change.”Trends in Plant Science 15: 133-144. doi:http://dx.doi. org/10.1016/j.tplants.2009.12.005.
Piao, S., P. Ciais, M. Lomas, C. Beer, H. Liu, J. Fang, P. Friedlingstein,et al. 2011. “Contribution of Climate Change and Rising CO2to Terrestrial Carbon Balance in East Asia: A Multi-Model Analysis.” Global and Planetary Change 75: 133-142. doi:http://dx.doi.org/10.1016/j.gloplacha.2010.10.014.
Possell, M., and C. N. Hewitt. 2010. “Isoprene Emissions from Plants Are Mediated by Atmospheric CO2Concentrations.”Global Change Biology 17: 1595-1610. doi:http://dx.doi. org/10.1111/j.1365-2486.2010.02306.x.
Possell, M., C. N. Hewitt, and D. J. Beerling. 2005. “The Efects of Glacial Atmospheric CO2Concentrations and Climate on Isoprene Emissions by Vascular Plants.” Global Change Biology 11: 60-69. doi:http://dx.doi.org/10.1111/j.1365-2486.2004.00889.x.
Rosenstiel, T. N., M. J. Potosnak, K. L. Grifn, R. Fall, and R. K. Monson. 2003. “Increased CO2Uncouples Growth from Isoprene Emission in an Agriforest Ecosystem.” Nature 421: 256-259. doi:http://dx.doi.org/10.1038/nature01312.
Streets, D. G., T. C. Bond, G. R. Carmichael, S. D. Fernandes, Q. Fu,D. He, Z. Klimont, et al. 2003. “An Inventory of Gaseous and Primary Aerosol Emissions in Asia in the Year 2000.” Journal of Geophysical Research: Atmospheres 108 (D21): 8809. doi: http://dx.doi.org/10.1029/2002jd003093.
Tai, A. P. K., L. J. Mickley, C. L. Heald, and S. L. Wu. 2013. “Efect of CO2Inhibition on Biogenic Isoprene Emission: Implications for Air Quality under 2000 to 2050 Changes in Climate,Vegetation, and Land Use.” Geophysical Research Letters 40: 3479-3483. doi:http://dx.doi.org/10.1002/Grl.50650.
Wilkinson, M. J., R. K. Monson, N. Trahan, S. Lee, E. Brown,R. B. Jackson, H. W. Polley, P. A. Fay, and R. A. Y. Fall. 2009.“Leaf Isoprene Emission Rate as a Function of Atmospheric CO2Concentration.” Global Change Biology 15: 1189-1200. doi:http://dx.doi.org/10.1111/j.1365-2486.2008.01803.x.
Young, P. J., A. Arneth, G. Schurgers, G. Zeng, and J. A. Pyle. 2009. “The CO2Inhibition of Terrestrial Isoprene Emission Signifcantly Afects Future Ozone Projections.” Atmospheric Chemistry and Physics 9: 2793-2803. doi:http://dx.doi. org/10.5194/acp-9-2793-2009.
Zhang, Q., D. G. Streets, G. R. Carmichael, K. B. He, H. Huo,A. Kannari, Z. Klimont, et al. 2009. “Asian Emissions in 2006 for the NASA INTEX-B Mission.” Atmospheric Chemistry and Physics 9: 5131-5153. doi:http://dx.doi.org/10.5194/acp-9-5131-2009.
异戊二烯排放; 二氧化碳;抑制作用; 模式模拟
19 November 2015
CONTACT LIAO Hong hongliao@nuist.edu.cn
© 2016 The Author(s). Published by Informa UK Limited, trading as Taylor & Francis Group.
This is an Open Access article distributed under the terms of the Creative Commons Attribution License (http://creativecommons.org/licenses/by/4.0/), which permits unrestricted use, distribution, and reproduction in any medium, provided the original work is properly cited.
猜你喜欢
上海化工(2022年3期)2022-06-30
天津医科大学学报(2021年1期)2021-12-05
天津医科大学学报(2019年3期)2019-08-13
辐射防护通讯(2019年3期)2019-04-26
四川环境(2019年6期)2019-03-04
高原山地气象研究(2016年2期)2016-11-10
现代检验医学杂志(2016年5期)2016-08-20
微生物学杂志(2016年6期)2016-03-07
橡塑技术与装备(2016年21期)2016-02-25
橡胶工业(2016年5期)2016-02-24
 Atmospheric and Oceanic Science Letters2016年4期
- Atmospheric and Oceanic Science Letters的其它文章
- A decadal abruption of midwinter storm tracks over North Pacific from 1951 to 2010
- Comparison of convective parameterizations in RegCM4 experiments over China with CLM as the land surface model
- Chemical characterization of submicron particles during typical air pollution episodes in spring over Beijing
- Two different periods of high dust weather frequency in northern China
- Pressure gradient errors in a covariant method of implementing the σ-coordinate: idealized experiments and geometric analysis
- The link between the Victoria mode in the preceding boreal winter and spring precipitation over the southeastern USA and Gulf of Mexico