
Measurements of the 107Ag neutron capture cross sections with pulse height weighting technique at the CSNS Back-n facility
2022-03-12 07:44XinXiangLi李鑫祥LongXiangLiu刘龙祥WeiJiang蒋伟JieRen任杰HongWeiWang王宏伟
Chinese Physics B 2022年3期
Xin-Xiang Li(李鑫祥) Long-Xiang Liu(刘龙祥) Wei Jiang(蒋伟) Jie Ren(任杰) Hong-Wei Wang(王宏伟)
Gong-Tao Fan(范功涛)1,2,3,‡, Jian-Jun He(何建军)7,8, Xi-Guang Cao(曹喜光)1,2,3, Long-Long Song(宋龙龙)3,
Yue Zhang(张岳)4,5, Xin-Rong Hu(胡新荣)1,2, Zi-Rui Hao(郝子锐)1,2, Pan Kuang(匡攀)1,2, Bing Jiang(姜炳)1,2,Xiao-He Wang(王小鹤)1, Ji-Feng Hu(胡继峰)1, Jin-Cheng Wang(王金成)9, De-Xin Wang(王德鑫)9,Su-Yalatu Zhang(张苏雅拉吐)9, Ying-Du Liu(刘应都)10, Xu Ma(麻旭)10, Chun-Wang Ma(马春旺)11,Yu-Ting Wang(王玉廷)11, Zhen-Dong An(安振东)1,12, Jun Su(苏俊)7,8, Li-Yong Zhang(张立勇)7,8,Yu-Xuan Yang(杨宇萱)1, Wen-Bo Liu(刘文博)1,11, Wan-Qing Su(苏琬晴)1,11,
Sheng Jin(金晟)1,2, and Kai-Jie Chen(陈开杰)1,13
1Shanghai Institute of Applied Physics,Chinese Academy of Sciences,Shanghai 201800,China
2University of Chinese Academy of Sciences,Beijing 100049,China
3Shanghai Advanced Research Institute,Chinese Academy of Sciences,Shanghai 201210,China
4Institute of High Energy Physics,Chinese Academy of Sciences,Beijing 100049,China
5China Spallation Neutron Source,Dongguan 523803,China
6China Institute of Atomic Energy,Beijing 102413,China
7Key Laboratory of Beam Technology and Material Modification of Ministry of Education,College of Nuclear Science and Technology,Beijing Normal University,Beijing 100875,China
8Beijing Radiation Center,Beijing 100875,China
9College of Mathematics and Physics,Inner Mongolia Minzu University,Tongliao 028000,China
10Xiangtan University,Xiangtan 411105,China
12Henan Normal University,Xinxiang 453007,China
12Sun Yat-sen University,Zhuhai 510275,China
13ShanghaiTech University,Shanghai 200120,China
Keywords: neutron capture cross section, pulse height weighting technique(PHWT), 107Ag(n,γ)108Ag, the China spallation neutron source(CSNS)Back-n facility
1. Introduction
Silver indium cadmium (Ag-In-Cd) control rods are widely used in pressurized water reactor nuclear power plants.Its main function is to compensate for the remaining reactivity of the initial charge, adjust and maintain the reactor to operate at a specific power and to ensure that the stack can be shut down safely in normal or emergency situations.[1]The control rod absorber is continuously consumed in a high neutron flux environment, which causes the value of the control rod to change with the fuel consumption. In the early days, the safety margin of the reactor was relatively large,the fuel consumption in the reactor was relatively shallow, and the role of the control rod in the operation strategy was not obvious.With the increasingly prominent problem of energy shortages,in order to improve fuel utilization and reduce fuel cycle costs,reactor design has continued to developed in the direction of deep burnup. Therefore,the role of the control rod in the operation strategy is becoming more and more important.[2]Accurately calculating the value of the control rod requires a reliable neutron reaction cross section of the control rod. The initial mass composition of the core of the Ag-In-Cd control rod is 80%Ag, 15%In and 5%Cd. Among them,107Ag accounts for 41.44%,and109Ag accounts for 38.56%.[3]Meanwhile,the heavy elements beyond the iron-peak are generally created by various neutron capture processes taking place as either the result of mixing in very evolved stars or explosions,i.e., the slow neutron capture process (sprocess)[4]and the rapid neutron capture process(rprocess).[5]Observations and theoretical predictions indicate that therprocess has two components and/or takes place in different astrophysical environments giving rise to a main and a weak formation channel.[6]Some of the proposed processes are the lighter element primary process.[7]Silver is a lighter heavy element and its neutron capture cross section can be considered when attempting to explain the abundances of the lighter heavy elements. From 1946 to 2013,more than 40 experiments published the neutron capture cross section of silver 107 isotope(107Ag,Fig.1),but none of these measurements focused on 1-60 eV.[8-21]Meanwhile, there has not been a public experiment that has fully measured the resonant peak of107Ag. The most recent measurement of silver’s neutron capture cross section was performed by ˇSalamonet al. at the time-of-flight (TOF) facility GELINA of the EC-JRC-Geel in 2019.[22]They measured107Ag and109Ag resonance parameters for neutron induced reactions below 1 keV.They used the natural targets in the experiments,and thus their data should be verified further by an isotope target.
This work measured the107Ag (n,γ) cross section between 1 eV and 60 eV with an enrich isotope107Ag target.The experimental methods and data analysis and uncertainty are described in detail below. The neutron capture resonance parameters of107Ag in this energy region are also provided.the experimental study of neutron scattering.[23-29]The backstreaming white neutron beam line (Back-n) was built in the beginning of 2018,and this is a branch line of the CSNS.[30,31]It is mainly used for neutron data measurements. The maximum neutron flight distance of Back-n is approximately 80 m,while the neutron energy range is 0.5 eV-200 MeV.At the Back-n experimental station, the neutron flux can reach 107cm-2·s-1.
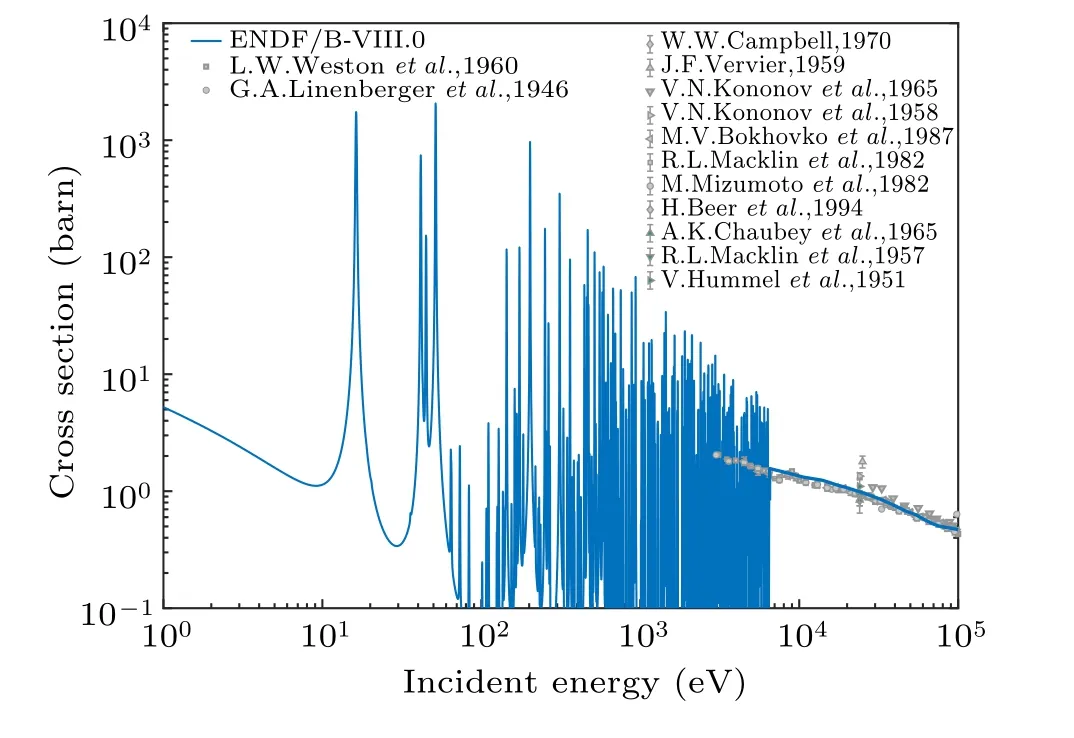
Fig. 1. Existing experimental data of 107Ag from EXFOR database.[8-21]Line is evaluated data from ENDF/B-VIII.0
2. Experimental method
The China spallation neutron source (CSNS) is the first spallation neutron source in China, and is mainly used for
A detection system consisting of four C6D6scintillation detectors was installed at the center of ES#2, approximately 76 m away from the spallation target. Each C6D6liquid scintillator has 127 mm in diameter and 76.2 mm in length, and the scintillator was contained in a 1.5-mm thick aluminum capsule and coupled with a photomultiplier tube(ETEL 9390 KEB PMT).[32,33]The present layout of the detector is consistent with the previous one.[34]The neutron flux was measured by a Li-Si detector, which is based on the6Li(n,α)3H reaction.[35,36]Back-n data acquisition system (DAQ) adopts a full waveform data acquisition solution.
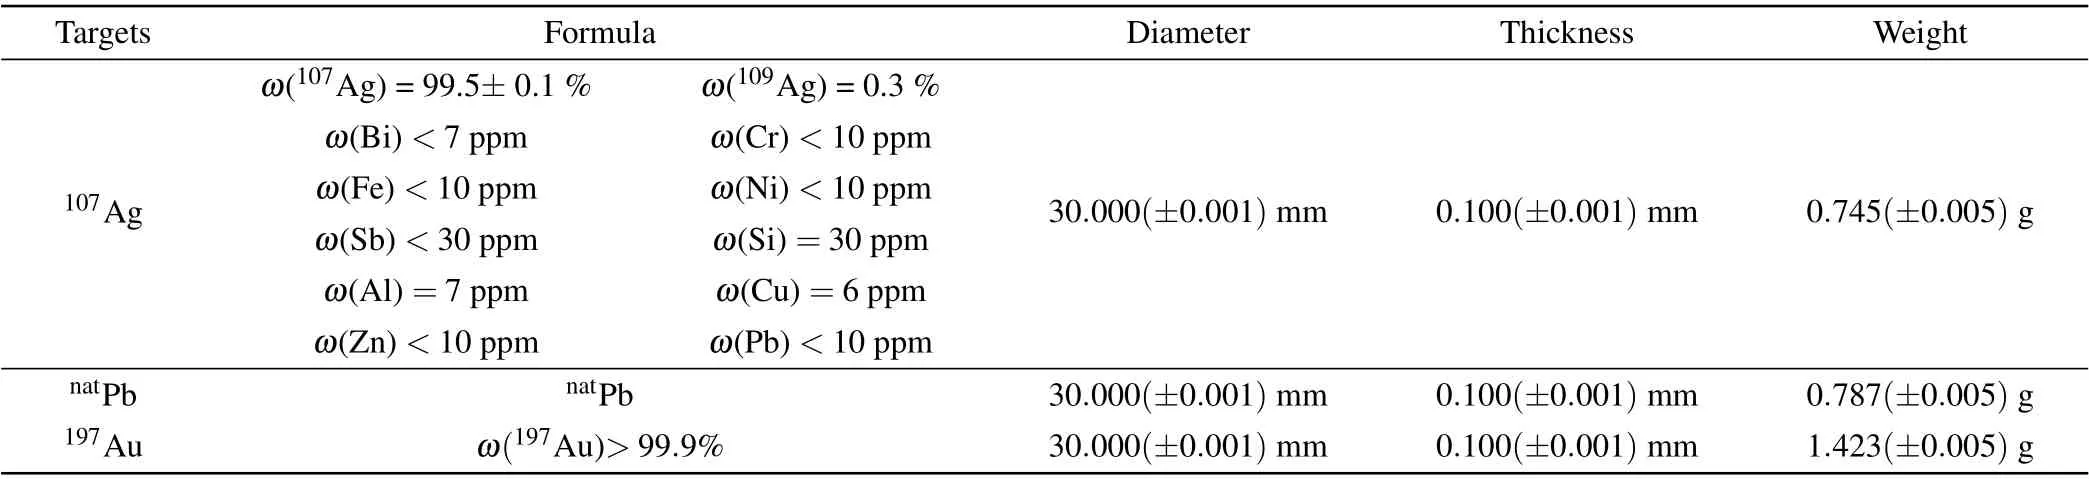
Table 1. Information of targets used in this experiment
The experiment took about 57.5 h, for197Au,natPb and107Ag targets,with detail information shown in Table 1.Backn provides two measurement modes after 2019. (1) One is the normal beam shooting mode. From the generation of the neutron beam to the target,there is no manual intervention to reduce the in-beamγbackground. The main measurement of this experiment was carried out in this mode. (2)The other is to add a lead absorber at the neutron beam window. The role of the lead absorber is mainly to shield the in-beamγbackground, and it will also have a certain impact on the flux and energy of the neutron beam.Since the response function of the beam line under mode(2)has not been measured completely,all the measurements in this experiment are under mode (1).Our previous work[37]has measured the neutron capture cross section of197Au and verified that the experiments and data processing are valid. In order to ensure the correctness of the experimental settings and data processing this time, we measured the gold target for 5 h and obtained results consistent with the previous measurements,[38]proved the reliability of the experimental setting and data processing. Subsequently,107Ag target was measured for 18.5 h, which statistic is considered sufficient(statistic error<1%).In order to scale the in beamγbackground,next we measured 4 h the sample(107Ag)with a filter which is composed of 40 mm thick aluminum located at the end station 1. Taking into account the fact that the environment has been activated by the neutrons, we replaced the empty target immediately after the measurement of the107Ag target in order to restore the background of the107Ag target measurement. The empty target was measured for 10 h.After that, the natural lead target was measured for 10 h. Finally, in order to evaluate the environmental background after activation and delayed gamma in the beam line, an empty target with no beam run was measured for 10 h. During the experiment,the average beam power was about 100 kW,with uncertainty less than 1%.
According to the previous work,[34]background analysis is very important and directly determines the reliability of the experimental data. Therefore,a detailed analysis of the experimental background is discussed below.
3. Background analysis
For neutron capture cross section measurements with C6D6detectors at Back-n, there are mainly two background types:[39]1) Sample-independent background, which is not correlated with the sample, like environmental radioactivity,and so on. 2) Sample-dependent background, which is correlated with the sample because of the scattering of in beam particles.

The experiment measured the empty target with no beam to determineB0;data of empty target with beam to determineBempty(t). Background in the keV energy region is essentially determined by elastic neutron scattering [Bsn(t)] and by the contributions due to in-beamγrays [Bsγ(t)]. These components were determined experimentally in dedicated runs with a lead target, which is an ideal target to measure in-beamγbackground because the neutron capture cross section of Pb is extremely low compared to that of Ag and is almost free of resonances in the energy range of interest. Additional measurements with neutron filters have been made for normalization of these background runs. The normalized counts spectrum is shown in Fig.2.
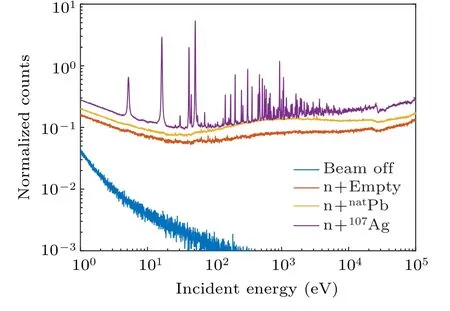
Fig.2. Normalized spectra.
The contributions of the neutron-induced background and the sample-independent background measured without sample exhibit a smooth decrease close to a 1/vlaw. The background reduces to this component below 20 eV. As shown in Fig. 3,the in-beamγrays, which are scattered in the sample, have a contribution between 20 eV and 100 keV,and the maximum value appears at the neutron energy near 1 keV.The total background is fitted according to the following function:
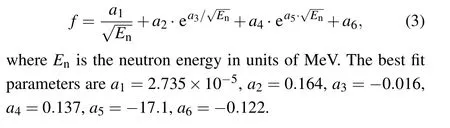

Fig.3.Decomposition of the spectrum measured with the neutron scattering background(red line obeys the 1/v law)and the contribution from in-beam γ rays(the green line is get from the purple one minus the red one).
To normalize these background components, a spectrum of the Ag target was taken with filters. The 40-mm thick Al filter was chosen so that neutrons were completely removed at the position of resonances at 34.7 keV and 86 keV.The Ag spectrum taken with filters was first corrected for the overall flux attenuation in the filters,as shown in Fig.4.

Fig.4. The 107Ag spectrum with filters in the neutron beam. The two background components caused by neutrons and γ rays have been fitted to match the minimum of the filter valleys.
The in-beamγbackground has different effects on the experimental results in different energy regions, at the same time,the uncertainty caused by the in-beamγbackground also depends on the target. For107Ag,in-beamγbackground will bring uncertainties less than 13.1%at 10-100 eV,and less than 22.0%at 100 eV-10 keV,and uncertainties less than 11.6%at 10-100 keV.For other nuclei,the lower capture cross section will bring even larger uncertainty.
4. Data analysis
The key to data analysis is to get the number of neutron capture reaction in the target. It depends on the detection efficiency and accuracy of the detector’s response to (n,γ) reaction. The efficiency of C6D6scintillators for detecting the promptγ-ray cascade emitted in neutron capture reactions depends on the complex de-excitation path of the compound nucleus. Consequently, the measured signals are required to be subjected to the pulse height weighting technique(PHWT),[40]which can be used to make the detection efficiency independent of the energies of the cascadeγrays.[41,42]
The core of PHWT is to get accurate weighting functions(WFs), which reliy on simulation. The simulation must consider the effects of the target, the detector, and the environment in detail. Thanks to GEANT4’s[44]powerful geometric construction capabilities,the structure and materials of the detector can be described as detailed as possible in the simulation process,so as to obtain more realistic WFs.
Experimental capture yields were obtained by means of weighting functions(WFs),which are parameterized as polynomial functions of theγray energy. Each event is weighed by the proper WF to ensure that the cascade efficiency of the detectors is proportional to their excitation energy. This manipulation of the raw data is valid when the efficiency of the detector is sufficiently low as to detect only oneγray per capture event. This is the case for the C6D6setup.[43]
The energy deposition of mono energeticγrays with different energies in the C6D6detector was simulated using the GEANT4 code.[44]The efficiency curve was calculated as shown in Fig. 5(a). By weighting the weight function to the efficiency curve,the relationship between detection efficiency and energy is almost linear (Fig. 5(b)), i.e., the ratio of efficiency to energy is approximately equal to 1(Fig.5(c)).

Fig.5. (a)C6D6 efficiency,(b)weighted detection efficiency,(c)weighted efficiency to energy ratio. For most energy,the ratio is approximately equal to 1, for energy <1.5 MeV, the weighted efficiency is not proportional to the energy. We choose to eliminate the influence of the weight function of failure by setting a threshold when analyzing the PH spectrum.
After applying WFs,the capture yield can be determined using the following formula:
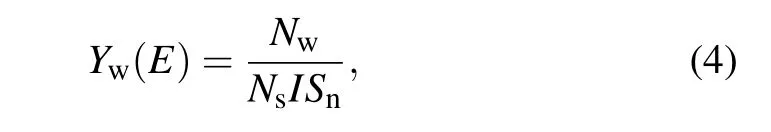
whereYwis neutron capture yield,Nwis weighted pulse height spectrum count,Nsis the area density of the sample,Snis the neutron binding energy of the sample, andIis the neutron flux. In 2019,Back-n collaboration measured the neutron energy spectrum based on the235U(n,f)reaction.[46]The relationship between the neutron capture cross section and the reaction yield is as follows:

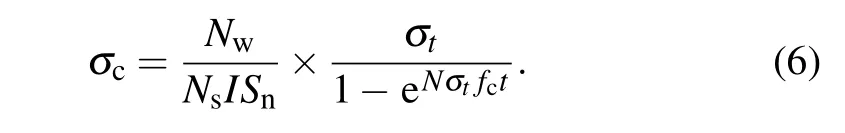
whereσcis the neutron capture cross section,σtis the neutron total cross section,Nis the atom density,andtis the thickness.Owing to the multiple scattering effect in target, a correction factorfcis introduced.GEANT’4[44]simulations were used to determine the value offc(as seen in Fig.6). Overall,the variation of thefcvalue with neutron energy tends to be stable although there are shape decreases in the region of 1-100 eV because of a significant increase in the neutron absorption cross section of107Ag in this energy region. Indeed,in the 100 eV-10 keV energy region,the resonance structures are observed in the neutron absorption and scattering cross section of107Ag,which results in the roughfccurve. The neutron capture cross section of the sample can then be expressed using the following formula:
The experimental error includes statistical and system errors, which are mainly from the following contributions, i.e.,experimental conditions uncertainty,data analysis method uncertainty,and experimental statistical error.[34]
Uncertainty from experimental conditions includes uncertainty of energy spectrum and the proton beam power. According to the Back-n collaboration,[46]the uncertainty of the energy spectrum in Back-n ES#2 at the mode of without lead absorber is between 2.3%and 4.5%above 0.15 MeV and less than 8.0% below 0.15 MeV. Uncertainty in the proton beam power was recorded during the measurement, resulting in an uncertainty of less than 1.0%.
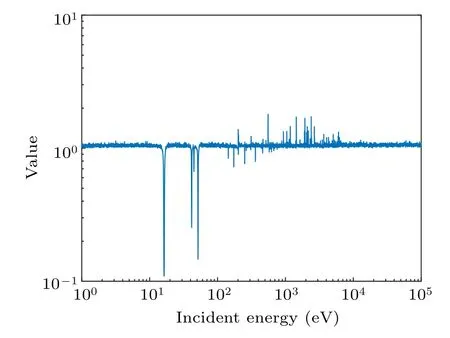
Fig.6. The fc value changed with incident neutron energy.
Uncertainties in data analysis are mainly caused by the PHWT method, background subtraction and normalization process. Since the measurement of neutron capture cross section using pulse height weight technique is based on simulations, the details of the experimental environment and the PWHT method[37]will affect the uncertainty estimation.However, the upper cascadeγcannot be ignored, it has approximately 1.0%uncertainty. At the same time,the emission of internal conversion electrons(EC)may lead to a reduction in the cascadeγcount,a cascadeγemission program including a simplified model of internal conversion process is used in the simulation (<0.5%). Previously, Tainet al. compared the neutron width PHWT treatment results of a 1.15 keV formant in56Fe with experimental results, finding that the systematic error of PHWT was 2.0%-3.0%.[45]After calculating the neutron capture cross section according to formula(6),the first resonant peak(16.3 eV)is used to normalize the low energy results because the proton beam power fluctuation is not considered in the neutron energy spectrum. Two methods are considered in the normalization process: one is Gaussian fitting of the experimental first resonance peak of 16-16.5 eV,in which the normalized coefficient is calculated by comparing the fitted curve with the evaluation data,and the other involves comparison with evaluation data according to the experimental energy bin, selecting the energy bin in 16-16.5 eV, then calculating the normalized coefficient. The calculation of the normalization coefficient contributed an error less than 2.4%.Uncertainty in data analysis also includes the systematic uncertainty caused by target parameters, as shown in Table 2,and it was less than 1.0%. Finally,the statistical uncertainty of the experiment was 0.4%.

Table 2. The estimated statistical and systematic errors.
In summary, the total error caused by experimental conditions is 8.1%. The error caused by data analysis is less than 4.0%and the statistical error is 0.40%. Thus,the total uncertainty of this experimental result is less than 9.0%.
5. Result and discussion
This work has measured the neutron capture cross section of107Ag in the energy range between 1 eV and 60 eV according to formula(6). As shown in Figs.7 and 1,the same trend and error range of different experimental groups in 3-100 keV confirm the correctness of the experimental process and data analysis. It is worth noting that in 100 eV-3 keV, the experimental results do not seem to match the evaluation data very well. Although we cannot rule out problems that may come from the evaluation database, since we have not been able to fully determine the influencing factors of the experiment, we cautiously suggest that this may require further experiments to test and measure. These factors include background, energy resolution of the detector, and the response function of beamline. We previously reported the results of gold targets with two diameters of 30 mm and 50 mm,and found that the results are different for different sizes.[37]We guess this may be caused by the mismatch between the target size and the neutron beam spot size. The excess neutrons will create more background in the environment. The Back-n experiment runs in the double-bundle mode, which can save beam time, but it also leads to poor energy resolution. Fortunately, this can be corrected by adding the Back-n energy resolution function to theR-matrix code.[47]Therefore,double-bundle mode will not affect the resonance parameters extracted by theR-matrix.
In Section 3,we already did background analysis. However, from the results of the experiment, it seems that there is a background baseline that leads to the lower limit of the neutron capture cross section that we can detect in different energy regions. In fact,the background baseline is not necessarily the real background. It may be more determined by the response function of beamline and not easily determined by general background measurement methods. This requires additional experiments to determine directly or indirectly.Therefore,the experimental data near 100 eV will be submerged in the background baseline and cannot be accurately extracted,we have only published the resonance data belowE=60 eV.
The present107Ag sample contains 0.3%109Ag impurity,which is also reflected in the neutron capture cross section in Fig. 7. We calculated the109Ag content by normalizing the cross section,and got the content of109Ag(0.28%±0.03%),which is consistent with the nominal value listed in Table 1.The red line in Fig.7 indicates the cross section of109Ag from ENDF/B-VIII.0 database,which is weighted by the above parameters. In the same way, the yellow line represents the weighted evaluation data of the107Ag(n,γ)cross section. The blue line is the result of the red line plus the yellow line.
As shown in Fig.7,the background baseline is controlled at about 4 barns in this energy region, which means that the neutron capture resonance peak of107Ag below 4 barns will be difficult to distinguish from the background in this work,such as those above 60 eV. The resonance structure of109Ag at 5.19 eV, 30.57 eV and 55.92 eV was detected. The experimental results match the evaluation database at 44.92 eV and 51.57 eV but are different in some resonance peaks. Although it still includes issues such as the response function of beamline and background baseline have not been fully determined, experimental data is relatively reliable in the energy region of 1-100 eV.[34]At 30.5 eV and 55.92 eV, the experimental values are significantly higher than the evaluation values. Since they are very close to the background baseline,we suggest this may be caused by the superposition of the true value and the background baseline. This requires further experiments to confirm. Meanwhile, at 55.92 eV,this deviation is relatively reduced, which means that the background baseline of Back-n varies with the neutron energy. It is worth noting that at 41.6 eV,the experimental value is also significantly lower than the evaluation database. We think the reason for the background baseline is smaller. At 16.34 eV,the peak position of experiment slightly different from it of the evaluation database. We recommend other independent experiments to test them. Of course, we still cannot completely rule out that the above situations are caused by the erroneous evaluation data.
The neutron capture cross sections between 1 eV and 60 eV were analyzed using theR-matrix SAMMY code[48]which takes into account all experimental effects,such as multiple interaction events (multiple scattering), self shielding,the broadening of resonances due to thermal motion(doppler broadening) and the resolution of the experimental setup. In addition, the full sample composition, including impurities,was taken into account[49]in simulation. There are some individual resonance parameters, such as resonance spinJ, neutron and radiative partial decay widthsΓnandΓγ,which can be determined in fitting data. In general,only energy and capture kernelk,defined as

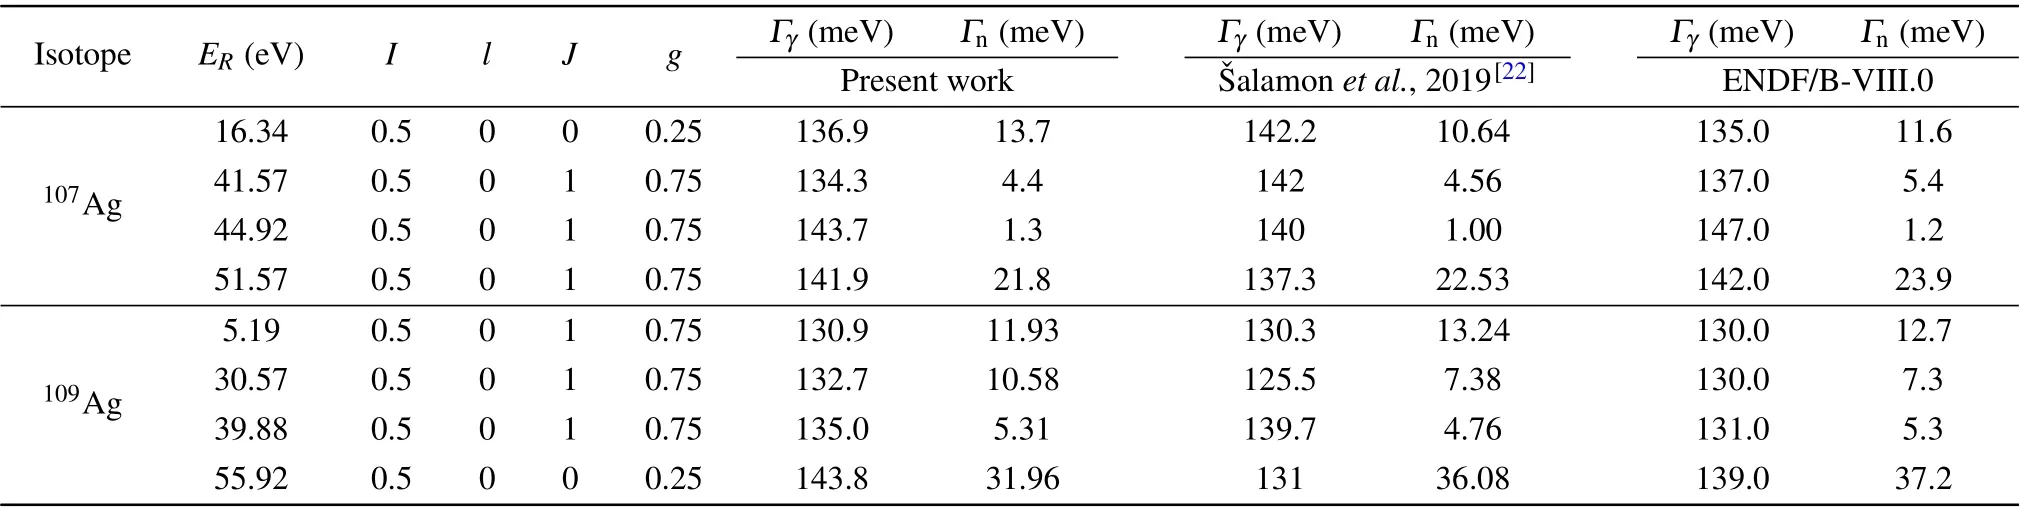
Table 3. Resonance parameters extracted from the R-matrix analysis of experimental data.
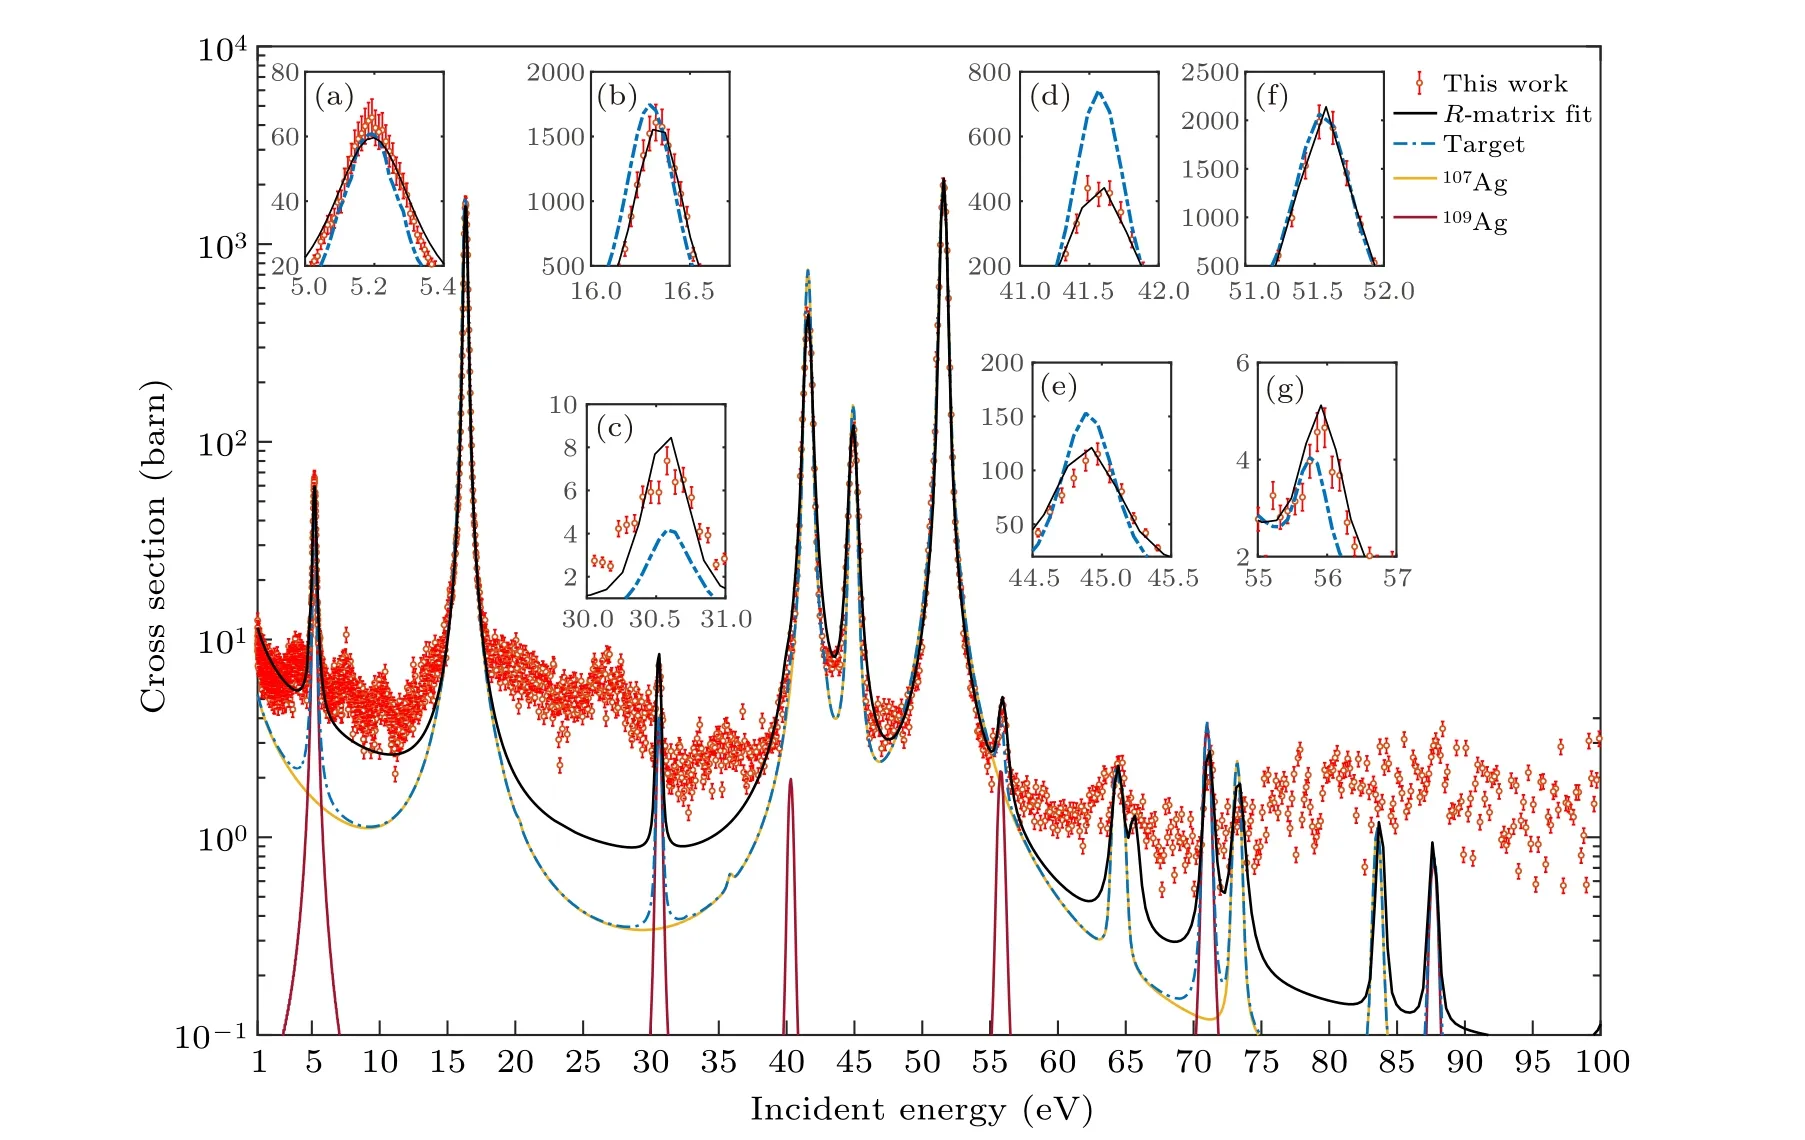
Fig.8. The resonance parameters of 107Ag in the energy range of 1-60 eV.
The detailed data of the cross sections and resonance parameters can be found in the supplementary materials. It contains 3 excel files, which are described below: cross section.xlsx presents the experimental data of neutron capture cross section of107Ag between 1 eV and 60 eV; Resonance Parameters(Ag-109).xlsx gives the resonance parameters of109Ag extracted byR-matrix from the experimental data; and Resonance Parameters(Ag-107).xlsx provides the resonance parameters of107Ag extracted byR-matrix from the experimental data. These datasets are openly available at http://www.doi.org/10.11922/sciencedb.j00113.00010.
6. Summary and conclusions
We have measured107Ag(n,γ)cross section by an enrich isotope107Ag target at the Back-n beam line at CSNS.Information about the109Ag impurities remaining in the target was also extracted. We noticed that at 41.6 eV, the experimental data were significantly lower than the evaluation values from ENDF/B-VIII.0, and we have ruled out the background reason. At 16.34 eV, there were some differences between the experimental values and the evaluation value in the peak position. At 44.92 eV and 51.57 eV,the results were consistent with the evaluation database of ENDF/B-VIII.0.
Resonance capture parameters between 1 eV and 60 eV were extracted by theR-matrix code SAMMY. The results were compared with the data extracted by ˇSalamonet al.from natural target and results from the evaluation database of ENDF/B-VIII.0. The total error is less than 9.0% in this work, and results can be used to calculate reactor burn up to see the influence of silver nuclear data.
Acknowledgments
We appreciate useful communications from Prof. Gui-Lin Zhang at Shanghai Institute of Applied Physics, Chinese Academy of Sciences(SINAP),and effective technical support from Dr. Yi-Jie Wang at Tsinghua University, Ms. Wen-Yi Huang at HUST and Mr. Jun-Wen Wang at development and reform bureau of Shuangliu district,Chengdu. We also greatly appreciate the efforts of the staff of the CSNS and Backn collaboration. This work was supported by the National Natural Science Foundation of China (Grant Nos. 11875311,11905274, 1705156, U2032146, 11865010, 11765015, and 1160509), the Natural Science Foundation of Inner Mongolia,China(Grant Nos.2019JQ01 and 2018MS01009),and the Strategic Priority Research Program of the Chinese Academy of Sciences(Grant No.XDB34030000).
- Chinese Physics B的其它文章
- Measuring Loschmidt echo via Floquet engineering in superconducting circuits
- Electronic structure and spin-orbit coupling in ternary transition metal chalcogenides Cu2TlX2(X =Se,Te)
- Characterization of the N-polar GaN film grown on C-plane sapphire and misoriented C-plane sapphire substrates by MOCVD
- Review on typical applications and computational optimizations based on semiclassical methods in strong-field physics
- Quantum partial least squares regression algorithm for multiple correlation problem
- Optical scheme to demonstrate state-independent quantum contextuality