
Development of Features for Early Detection of Defects and Assessment of Bridge Decks
2023-08-14 06:52AhmedSilikXiaodongWangChenyueMeiXiaoleiJinXudongZhouWeiZhouCongningChenWeixingHongJiaweiLiMingjieMaoYuhanLiuMohammadNooriandWaelAltabey
Ahmed Silik,Xiaodong Wang,Chenyue Mei,Xiaolei Jin, Xudong Zhou,Wei Zhou,Congning Chen,Weixing Hong,Jiawei Li,Mingjie Mao,Yuhan Liu,Mohammad Nooriand Wael A.Altabey
1Nanjing Zhixing Information Technology Co., Ltd., Nanjing, China
2Jiangsu Advance Transportation Institute,Nanjing, China
3Suzhou Highway Development Center, Suzhou, China
4Guangdong Communications Group Co.,Ltd., Guangzhou, China
5Department of Mechanical Engineering, California Polytechnic State University, San Luis Obispo, CA,93405, USA
6School of Civil Engineering, University of Leeds,Leeds, LS2 9JT, UK
7Department of Civil Engineering, Faculty of Engineering Sciences, Nyala University, Nyala, 092,Sudan
8Department of Mechanical Engineering, Faculty of Engineering, Alexandria University, Alexandria, 21544, Egypt
ABSTRACT Damage detection is an important area with growing interest in mechanical and structural engineering.One of the critical issues in damage detection is how to determine indices sensitive to the structural damage and insensitive to the surrounding environmental variations.Current damage identification indices commonly focus on structural dynamic characteristics such as natural frequencies,mode shapes,and frequency responses.This study aimed at developing a technique based on energy Curvature Difference, power spectrum density, correlation-based index,load distribution factor,and neutral axis shift to assess the bridge deck condition.In addition to tracking energy and frequency over time using wavelet packet transform,in order to further demonstrate the feasibility and validity of the proposed technique for bridge condition assessment,experimental strain data measured from two stages of a bridge in the different intervals were used.The comparative analysis results of the bridge in first and second stage show changes in the proposed feature values.It is concluded, these changes in the values of the proposed features can be used to assess the bridge deck performance.
KEYWORDS Structural health monitoring; strain monitoring; distribution factor; wavelet packet transform
1 Introduction
Continuous awareness of the evolution process of the structural condition in civil structures over time is of great value, as it supports to make informed decisions about infrastructure assets, maintenance and management [1].Consequently, early and accurate damage detection, location, and assessment of concrete bridge decks may be advantageous in the maintenance activities and scheduling[2].For evaluation the bridge live load capacity, the bridge deck is one of the most critical parts of a bridge system, where owners require the most expensive repairs since it directly carries the traffic load [3].Monitoring the state of the bridge deck’s status is an ongoing need for researchers to evaluate deterioration.Bridge deck deterioration is a threat to bridge structures during their working life.It can cause travel delays, public inconvenience, economic impact, and even loss of lives, leading to the most severe problems for the transportation industry.The changes in the structural signal amplitudes can indicate deterioration.For example, delamination is caused by reinforcement corrosion due to long-term exposure to chloride ions or moisture.Corrosion usually occurs in the top layer of deck reinforcement, separating the concrete layer from the rebar and reducing the structural strength [4].Therefore, bridge assessment is a significant challenge.In addition, continuous awareness of the structural condition and evolution of in-service infrastructure systems is of great value for its owner as it allows for making informed decisions regarding the maintenance and management of infrastructure assets[5].
Structural condition assessment by monitoring has gained popularity in recent years because it can provide engineers with abundant information about a structure’s health through various sensors [5,6].It is expected that integrating data from the online structural health monitoring (SHM) system with structural condition assessment will allow dynamically tracing the condition of existing structures [7,8].The damage assessment strategy for early detection of defects in mechanical and civil structures, especially bridges, is critical in assisting structural maintenance and management plans.Recent catastrophic events on bridges once again have highlighted the importance of integrating (SHM) technologies into the current bridge management schemes to prevent similar tragedies in the future.
The use of monitoring-based indicators to assess the bridge deck condition,their sensitivity to damage and resistance to random traffic patterns are the main factors [9,10].In addition, the bridge structure’s dynamic characteristics, such as the natural frequencies, mode shapes, damping, and frequency responses,change due to damage [9,11–14].Based on the dynamic features, including information from the dynamic/vibration response measurements to assess (detect,locate and quantify)damage.
Thus, dynamic damage identification methods are based on changes in dynamic parameters, typically decreasing stiffness and increasing damping [11].As the damage phenomenon may not significantly influence the lower frequencies or the global response, it is essential to estimate higher modes and have accurate information about modal displacements.For these reasons, the methods based on changes in the mode shapes or modal curvatures (or the combination of all responses, e.g., frequencies, modes shapes,and modal curvatures) are usually more successful [15].The identification of modal parameters in vibrating structures was initially developed in civil engineering using experimental modal analysis methods, involving a simultaneous measurement of a controlled excitation and the corresponding structural response [11].Scholars believed such tests would characterize the structural behavior’s baseline condition and enable the detection of subsequent structural changes, making ambient vibration tests increasingly common before and after rehabilitation work[16].
According to 1977 FHWA report,bridge decks are deteriorating at an ever-increasing number and pace.Therefore, extensive studies have been developed to detect early damage based on variations of modal parameter estimates, despite the unsettling effect of environmental and operational factors [11,17–19].Although Modal analysis methods are well established and suitable in provides an accurate interpret the data, however, recent studies have pointed toward their limitations in damage detection, especially when the monitoring structure is under complex operating or environmental interference in which the physicsbased could be unable to recognize and detect the abnormality [20,21].The intrinsic drawback of using modal frequencies is their limited sensitivity to local damage of moderate severity, which might lead to significant errors in the identified damage parameters[20,21].
Some of the modal parameter limitations can be overcome by using the changes of modal displacements[22]and curvatures[23–25]which are claimed to be more sensitive to local damage.Modal curvatures have several advantages compared to other localization techniques [22].In fact, for minor damage, such as a notch, the variation of modal curvatures localizes in the damaged neighborhood[26].
Moreover,curvatures are less sensitive to environmental factors than natural frequencies[27].However,the issue is measuring the modal curvatures(modal strains)in civil engineering structures or derivating the modal curvatures from the modal displacements[15].In any case,to estimate damage,a sufficient number of measuring points is necessary to have enough spatial resolution of the mode shapes.Also,other researchers investigate the dependency of the modal parameters on temperature and wind velocity.For example,Li et al.[28,29–31] used the nonlinear principal component analysis (NLPCA) and principal component analysis(PCA) as a preprocessing tool to differentiate wind and temperature effects on structural modal parameters from other environmental parameters.
In the frequency domain,the power spectral densities have been widely used for damage identification[32–35].Also,Masciotta et al.[32]provided a formulation for non-destructive damage identification based on spectral analysis techniques.In this regard, an in-depth analysis of evolutionary spectral quantities extracted from the system’s output power spectrum matrix over different damage scenarios was performed.The contribution of this approach is the possibility to accurately identify the damage affecting a structure only from the knowledge of the second-order properties of measured output vibration signals.Other techniques exist based on the peaks in frequency response functions (FRF).Arnaud and Andre proposed a feature for damage detection based on the frequency content of the modal filter output [36].Further research shows that if local damage is present, spurious peaks appear in the FRF of the modal filter.In contrast, if temperature changes are considered, the FRF of the modal filter is shifted, but its shape remains unchanged.
Erazo et al.[37] proposed a feature for damage evaluation based on a peak indicator that tests for the peak’s presence in the given frequency bandwidth.The technique interprets the power spectral density as a scaled version of a probability density function.Although these techniques are widely used, most are based on the Fourier transform, which misses time information.Thus, more recently, researchers focused on features derived from time domain data.Working with time domain data enables the detection of nonlinearity’s that appear for specific damage types, such as crack propagation or unusual events [38].This information is lost when the time domain data is projected into the frequency domain.These procedures utilize signal processing methods like the wavelet transform.As a result, various approaches have recently been developed for the damage identification-based time-frequency domain.Among these are approaches based on wavelet transform [39–41].The wavelet transform extends the traditional Fourier transform and can perform local and self-adaptive time-frequency analyses [42].It plays an essential role in signal processing and data analysis due to its localization in the time or frequency domain.Hence, the wavelet transform reveals hidden signal aspects that other signal processing techniques fail to reveal[43].
Although wavelet transform is widely used,the frequency resolution in the higher frequency domain is not high in the wavelet transform.Thus, it may be challenging to differentiate a signal containing highfrequency components that are very close to each other.Therefore, the wavelet packet transform (WPT)technique has been developed to address this issue [44].The WPT is an extension of the traditional wavelet transform and can execute a complete level-by-level decomposition on the analyzed signal[44,45].Over the past two decades, WPT has been widely used for structural damage identification in mechanical and civil engineering applications [46–48].The wavelet packet energy was used to identify damage in structures such as wooden structures[49],beams [50], and cable-stayed bridges[51].
This study aims at developing a systematic approach to extract damage indicators for deck bridge assessment of in-service bridge structures using strain measurement acquired by an SHM system.The method is based on damage features from the time,frequency,and time-frequency domains by monitoring the structural vibration.The remainder of this paper is organized as follows.In Section 2,the importance of SHM for bridges is discussed.In Section 3, the damage detection procedure is presented.In Section 4,verification using experimental field monitoring data is discussed, and in Section 5, the conclusions of this study are summarized.
2 Bridge Monitoring
An intelligent structural health monitoring(SHM)mainly aims to provide an early warning for damage and reduce the possibility of a potential major collapse, leading to a loss in life and economy [52,53].In addition to helping the engineers to better understand the structural behavior during extreme events and provide sufficient information appropriate for the decision making, including those intended to do corrective action or preventive maintenance, it reduces the likelihood of accidents and maintenance costs[54,55], and finally the serviceability, safety, and sustainability of bridges [56].A long-term SHM system must have at least six modules [57,58], namely: (1) the sensory system,, which is used to monitor environmental temperature and humidity, bridge load vehicles, vibration, structural temperature, strain,main beam linear, support displacement, and cable tension, among other factors that affect the safety of the bridge; (2) the data acquisition and transmission system is used to sample and transmit the information sensed by the sensory subsystem; (3) the data processing and analysis system is used to process and analyze the obtained data so that the data can be conveniently used for further analysis; (4)the data management system is used to receive and store the recorded data; (5) the structural health evaluation system is used to evaluate and assess the bridge’s condition; (6) the decision-making and management system reflects the condition of the monitored objective, which the bridge manager easily utilize to decide on the objective, such as maintenance, repair, reinforcement and re-built of the objective.In general, a well-designed SHM system has the potential to [59]; (1) obtain several situ data that can be used for leading-edge research; (2) provide real-time information for safety assessment; (3) provide information for prioritizing bridge maintenance and repair; (4) detect loading, response, deterioration, and damage normalizes to ensure structural operation safety; (5) validate design assumptions and parameters that are beneficial for improving design specifications and guidelines; (6) extend the remaining life of the bridge by reducing failures due to early detection; (7) optimize inspection budgets with real-time condition data; (8) reduce unnecessary maintenance and life-cycle costs.Fig.1 shows the main reasons for using SHM.
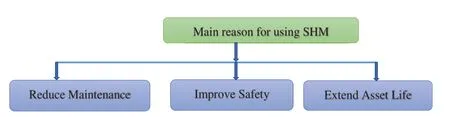
Figure 1: Main purposes of using SHM in civil structures
3 Damage Detection Procedure
To draw out a clear procedure for the proposed methodology for bridge deck condition assessment,this section explains the detailed procedure.First,strain measurements at different web and flange sections are collected and then preprocessed.Second, load distribution factors and the location of the neural axis are determined to provide information on bridge performance and potential damage to the bridge deck.Third,the correlation coefficients between various measurements are introduced and transformed.Fourth,wavelet packet transform is conducted on the signal of two various conditions.Finally, the sensitive damage features are extracted using a wavelet packet transform based on energy curvature difference and frequency fluctuations over time.Fig.2 shows the flowchart to understand these steps’ sequential order better.
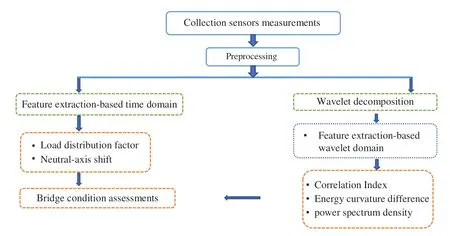
Figure 2: Flowchart of proposed features extraction for bridge condition assessments
3.1 Load Distribution Factor
A bridge’s live load girder distribution factor(GDF)is a ratio of the live load applied to each beam girder when a vehicle crosses the bridge [60].Properly conservative distribution factors are computed when designing a bridge to decide the design load percentage each girder beam must carry according to the maximum live loads of enveloped [61].Based on this concept, the GDF can also be calculated using strain measurement data.Ghosn et al.[62] suggested that the distribution factors-based strain for identical girder beams is the recorded strain of an individual beam divided by the sum of the strains of all beams at the transverse location.
As Eq.(1) denotes the live load percentage carried by each girder.The sum of the GDFs for a bridge must be equal to 1.When all beams have the same stiffness, Eq.(1) represents the live load percentage taken by each beam.When the beams have different stiffnesses, Eq.(1) does not reflect the true live load distribution but can be considered a comparison of the beam’s peak strains concerning other beams [60].In this form, the GDF is an effective measure of the bridge performance and can be used to evaluate changes in load distribution across beams.
3.2 Neutral-Axis Shift-Based Damage Index
The neutral axis is an axis in the beam’s cross-section with no longitudinal stresses or strains (axis of zero stress).It is a key parameter in most structural design theories.Also, it serves as a potential indicator of the safety status of the structure [63].Thus, it has been proposed as a damage indicator for bridge deck assessment because it reflects the local cross-section property and shifts when damage on the deck crosssection occurs [63].Daubechies et al.[42] measured the neutral axes position of two reinforced bridges,where the retrofit effect was confirmed because the neutral axis shifted as expected after strengthening.Although the strain responses at different points of a deck cross-section under varying traffic loading evolve with time, their ratio would keep constant in the damage absence.It can be used to derive the neutral-axis position.It has been revealed that the strain-derived neutral-axis position is sensitive to local damage on the deck [10].However, the accuracy of neutral-axis position estimation by directly using strain data may be distorted by the noise presence and varying traffic load patterns.For illustration, Fig.3 shows a typical beam model.It is assumed that strain εmis recorded via the strain gauge covering the zone from the ithto the jthnode, the gauge length Lm.The εmcan be defined as[41]:
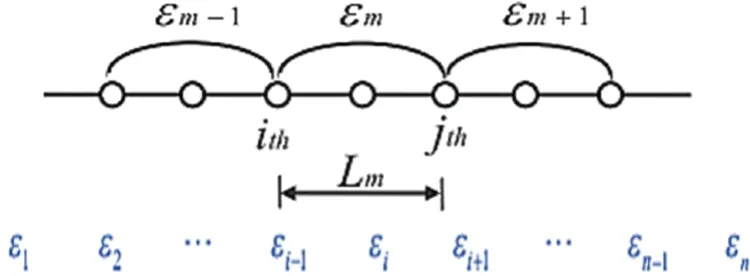
Figure 3: Strain measurements for beam structure
As illustrated in Fig.4,each beam-like structure uses the assumption of a plane section and behaves like a flexural beam when traffic loads cause it to bend.This means linear relationships between deformations and the section depth, defined by the structural property.The strains at the bottom and top of the section are denoted by εband εtrespectively,as shown in Fig.4.According to the above assumption,the neutral axis location factor (ψ) is used to define the linear relationship [63].By a geometric relation, a ratio of εbto εtcan be expressed as:
where εband εtare the strains at different depths in the same section;besides,the plane section can also be used to analyze some small part of the bending structure.In other words,the strain is distributed linearly with an averaged neutral axis for all parts.So,herein the macro-strains are the strains ε(t )and ε′(t).Fig.4 shows strain distribution along the cross-section with sensors installed at(a)different sides of the neutral axis;and(b)the same side of the neutral axis [64].
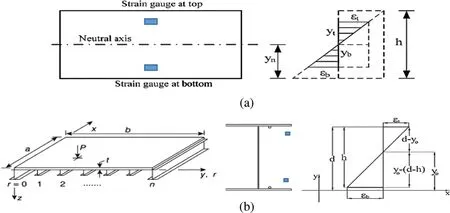
Figure 4: Distributed strain measurement with sensors.(a) Rectangular section(b)I-section
Where ybis the distance between the bottom and the neutral axis,and ytis the distance between the top and the neutral axis.From Eq.(3), we can obtain:
where yndenotes the neutral-axis location of the cross-section,and h is the depth of the cross-section.Eq.(4)relates the neutral-axis position in the ratio(yn/h)with the strains at the bottom and top of a cross-section.Under traffic loads, bending behavior dominates the response of beam-like bridge decks.When the strain responses at the top and bottom points are measured,the neutral-axis position can be estimated by:
From Fig.4b, for I-section, the neutral-axis location of the cross-section y0is defined as:
In this study, the neutral-axis position ratio (r =yn/h) is taken as the state variable to be estimated.Because of the time-varying nature and traffic flow randomness, ε (t) was represented with a time-varying characteristic with randomness during daily operation.Most of the measurement noise is also filtered using discrete wavelet transform.
3.3 Correlation Index
The correlation index has been widely used as a damage-sensitive feature for detecting damage[13,65].In this study,we have tried to estimate the correlation between various sensor measurements.As is shown in Fig.1,εmis the girder bottom midpoint longitudinal strain of the ithgirder,where mi=1,2,L,and n is the number of girders.A strain data sequence based on time was obtained through continuous observation of strain as follows:
where εiLrepresents ithgirder strain of lthobservation, L = 1, 2, L, and L represents the total number of observations.The mid-span section longitudinal strain correlation coefficient of the 1stand jthgirder becomes[65]:
where E (Si), E ( Sj)mean expected values of variables Si, Sj, cov(Si, Sj) means the covariance of variableTs Siand Sj, and DS·DSjmeans the product of the standard deviations of variables Siand Sj, and Sjmeans the transpose of Sj.Herein, the correlation coefficient ρijrepresents the correlation between the mid-span section longitudinal strain of ithand jthgirders.
3.4 Energy Curvature Difference
Curvature difference can reflect the changes in the analyzed signal,so it is a viable measure for damage identification[44].The curvature is more sensitive to minor variable changes than the analyzed signal,which is the curvature concept advantage[50].Practically,the function curvature is usually obtained by using the second-order difference as[66]:
where xi-1,xi,and xi+1represent three different points of variable x.If the distance between xi-1and xiequals the distance between xiand xi+1,i.e.,
Then this can be simpli f i ed as:
3.5 Features-Based Wavelet Packet Transform(WPT)
The WPT can be accomplished through the level-by-level decomposition of the signals.Wavelet packets can be de f i ned as follows[44,45]:
where i indicates the modulation parameter,j indicates the scale parameter,and k indicates the translation parameter.Where the wavelets ψiare obtained from the follow ing recursive relationships, respectively[44,45]:
where h(k)and g(k)are the quadrature mirror f i lters,h(k)is related to the scaling function and g(k)is related to the mother wavelet function ψi.The signal wavelet packet energy can be expressed as:
where i represents the order of the component signal at each level and j represents the decomposition level.We introduce the curvature concept into the wavelet packet energy for achieving damage identification.The component energy curvature[44] is de f i ned as:
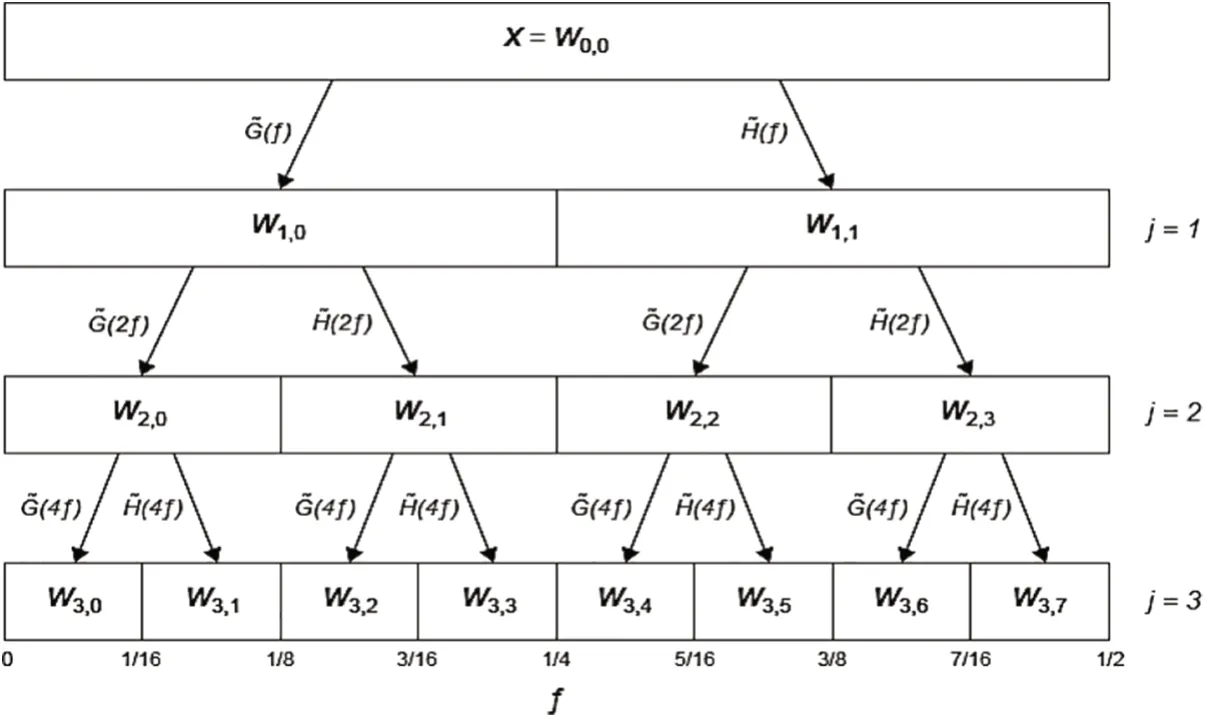
Figure 5: Decomposition of the wavelet packet transform
4 A Case Study of the Bridge
4.1 Bridge Description
The data was collected from a multi-span concrete box Girder Bridge,located across the Lieshi River,Rugao city,Jiangsu Province.The bridge has 27 piers,26 spans,and five prestressed concrete box girders in each highway direction as shown in Fig.6.The bridge’s height is 1.4 m and its total length is 636.503 m.The average daily traffic is about 19066 vehicles northbound and 231748 southbound.The damage in the bridge was the first detected on a 2015 inspection,which is why the monitoring system was installed.The cracks have been found at the mid-span of girder#2 under the heavy truck lane.Crossing cracks occurred on the bottom flange of the box girder near the midspan, while vertical cracks on the web of the box girder near the mid-span shown in Fig.7.Various sensors were installed on three spans of bridge as shown in the Fig.8, which shows the graphical representation of the bridge, including its main dimensions, sensors layout,and measurement points.

Figure 6: General view of lieshi bridge

Figure 7: (a)Vertical cracks on web of box girder near mid-span,(b)Vertical cracks on web of the girder#2

Figure 8: The sensor location and cross-section
4.2 Experimental Field Monitoring Data
Common measurements in structural monitoring are acceleration and strain responses[68].Practically,tracking the deformation response during the operation plays a vital role in evaluating the condition of a bridge through monitoring.Since strain measurement can, on the one hand, be directly used to determine the fatigue or yield material and, on the other hand, provide derived information about the stresses experienced by the structure during operation.The monitoring system was set up to follow up on time of the vehicle when it crossed the bridge, and also recorded the traffic event.The six strain gauges of interest were located on the bottom of the beam.The first data was collected on 07-21-2018, when small vertical cracks appeared on the web of the girder and was denoted as state #1.The second data was collected on 2020-12-26, and denoted as state #2.The total time window for the signal acquisition is one hour with a sampling frequency of 50 Hz.
Since strain gauge readings are deviated due to the surrounding condition variations, each event was reset by subtracting the average ambient strain before the traffic event from each reading recorded at the time of the event to guarantee that only strain readings due to living load were captured.Figs.9 and 10 illustrate the traffic-induced denoised strain responses experienced by girders on the deck section under environmental conditions extracted from raw measurement data after denoised from background ambient noise using discrete wavelet transform.It is observed that the strain responses are sensitive to traffic load patterns.
5 Discussion and Results Analysis
Based on the analysis of a bridge’s strain responses(outputs only)under vehicle load,various damage indicators were calculated using strains collected by various strain gauges during traffic accidents.Data measured under states #1 and #2 at various interval are considered to assess the reliability and performance of the proposed features for bridge condition assessment over time.
5.1 Analysis Based on Load Distribution Factors and Neutral-Axis Shift
Fig.11 shows the Girder load distribution factors of five girders based on the strain data collected under operational strain monitoring at different locations during the vehicle’s crossings of the bridges at both states of bridge condition.It is observed that there are variations from girder to girder and from state to state,which indicate that when compared state#2 with state#1,the damage can be detected.The results show that girder distribution factors are a robust indicator of bridge performance and potential damage but do not provide information on the magnitude or location of the damage but they can be used to evaluate changes in load distribution across beams.
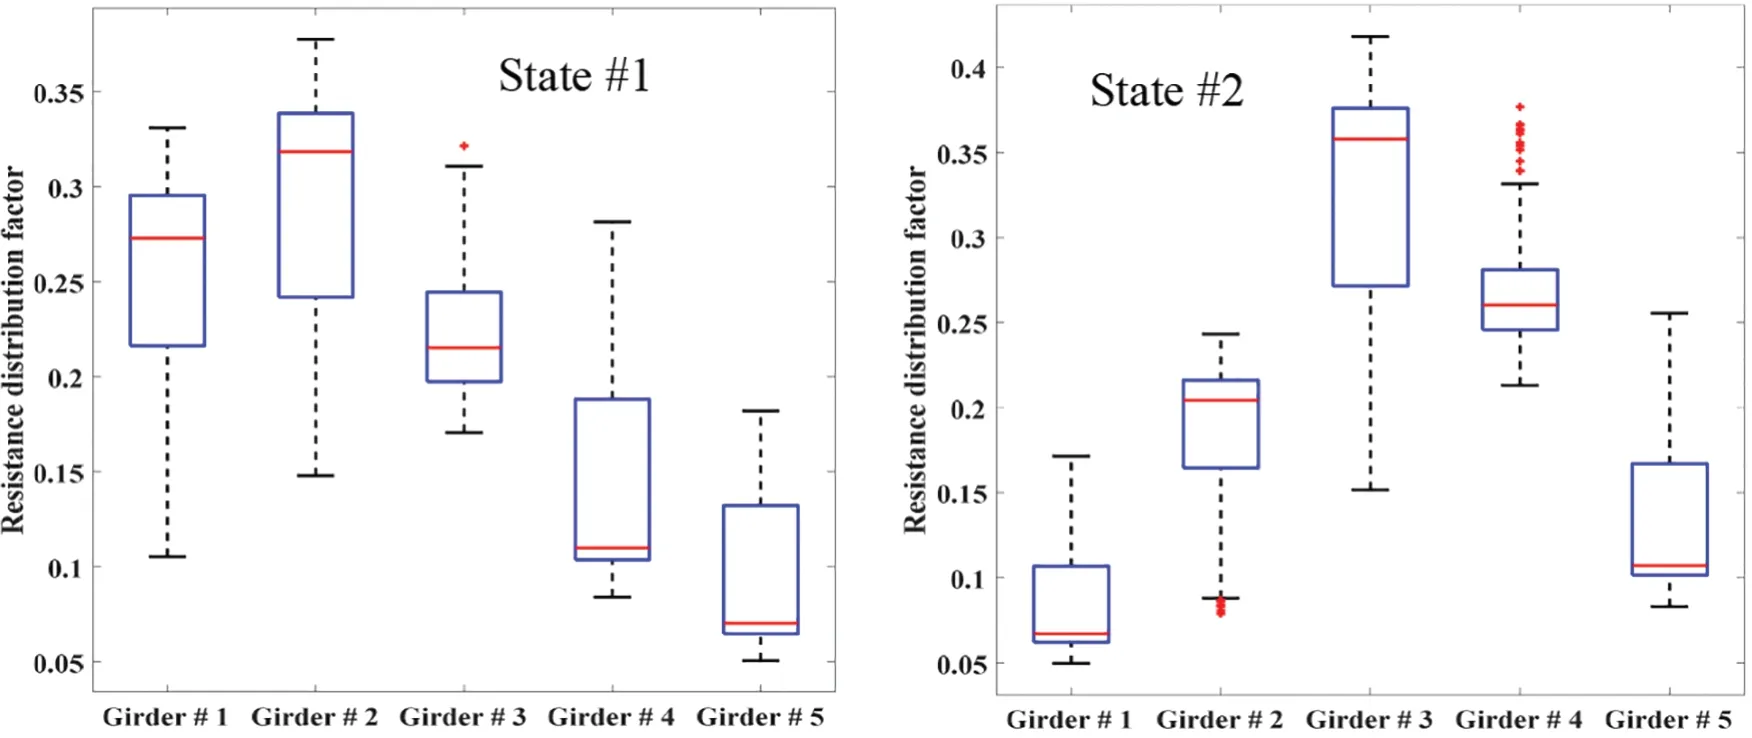
Figure 11: Boxplot diagram of load distribution of each beam based on the strain measurements collected under operational strain monitoring at different locations during the vehicle’s crossings of the bridges
According to [63], the neutral-axis shift can potentially have a high damage sensitivity because the neutral-axis position reflects the local cross-section property.Based on this, we used it to assess the behavior of the neutral axis and to investigate the neutral axis shift for SHM purposes.Fig.12 shows the calculated neutral-axis position ratio (r =yn/h) for state #1 and state #2.It is noticed that there is variation from girder #1 to girder #2 and from one point to another in one beam.The results show that neutral-axis position ratios are reliable and robust on-site, applicable to typical bridges, and can be considered a universal parameter in beam-like structures besides the deformed shape.Based on the strain responses relationship at the top and bottom of the girder cross-section, the neutral-axis position shift can be considered an indicator of defaults or abnormality to evaluate flexural curvature and neutral axis position.
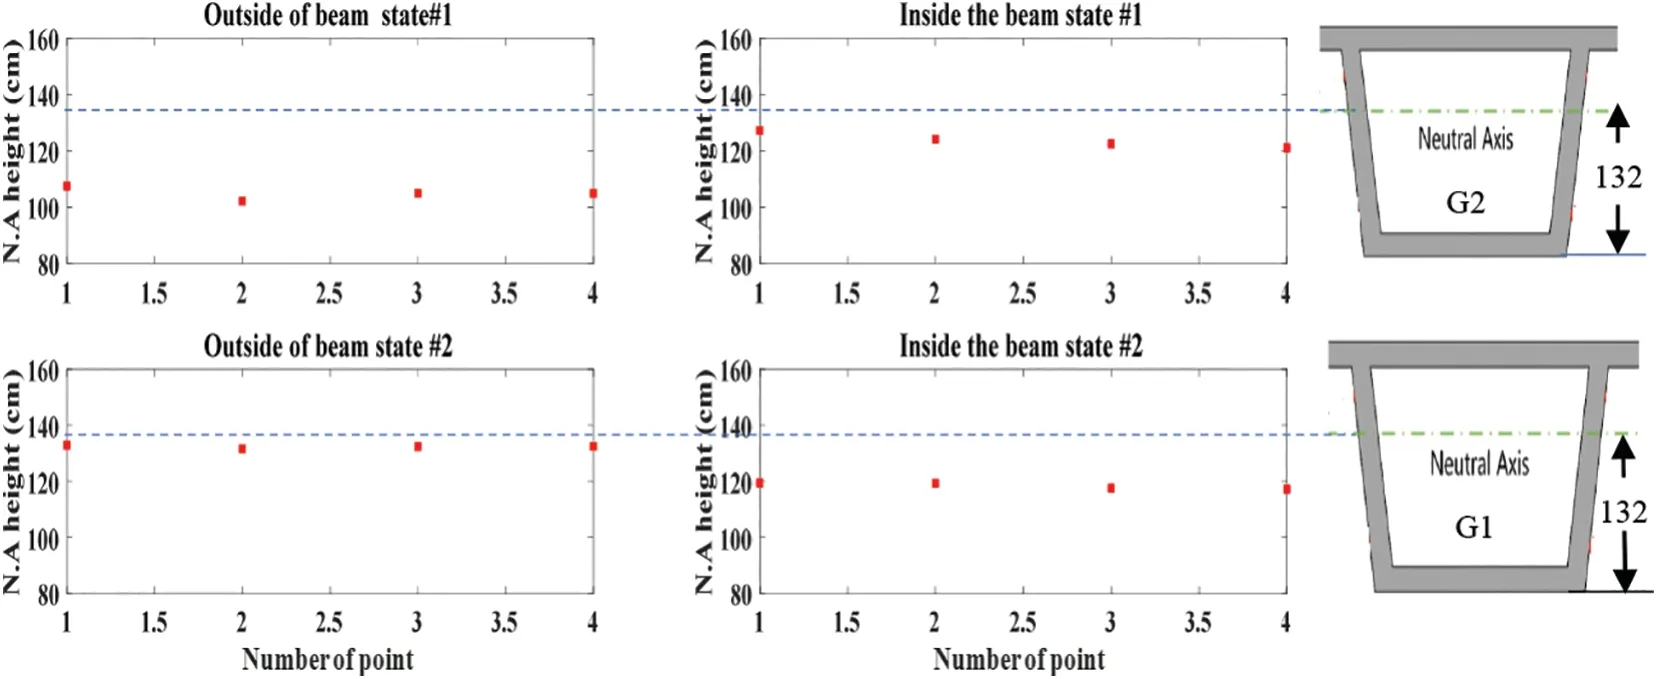
Figure 12: Estimated inside and outside neutral-axis position deviation of G#1 and G #2
5.2 Analysis Based on Correlation Index
On the other hand,the estimated correlation index values are plotted against the number of load events,as shown in Figs.13 and 14 of two different states.By comparing the two states, it is clear that there is variation in the correlation values.From the variation in correlation value, it can be concluded that the correlation values variations may indicate to defaults or abnormality in current bridge conditions and can be used to assess the bridge deck performance.
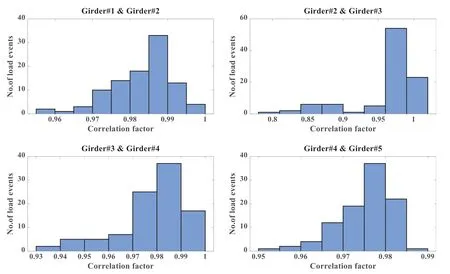
Figure 13: Correlation measures between various signals state #1
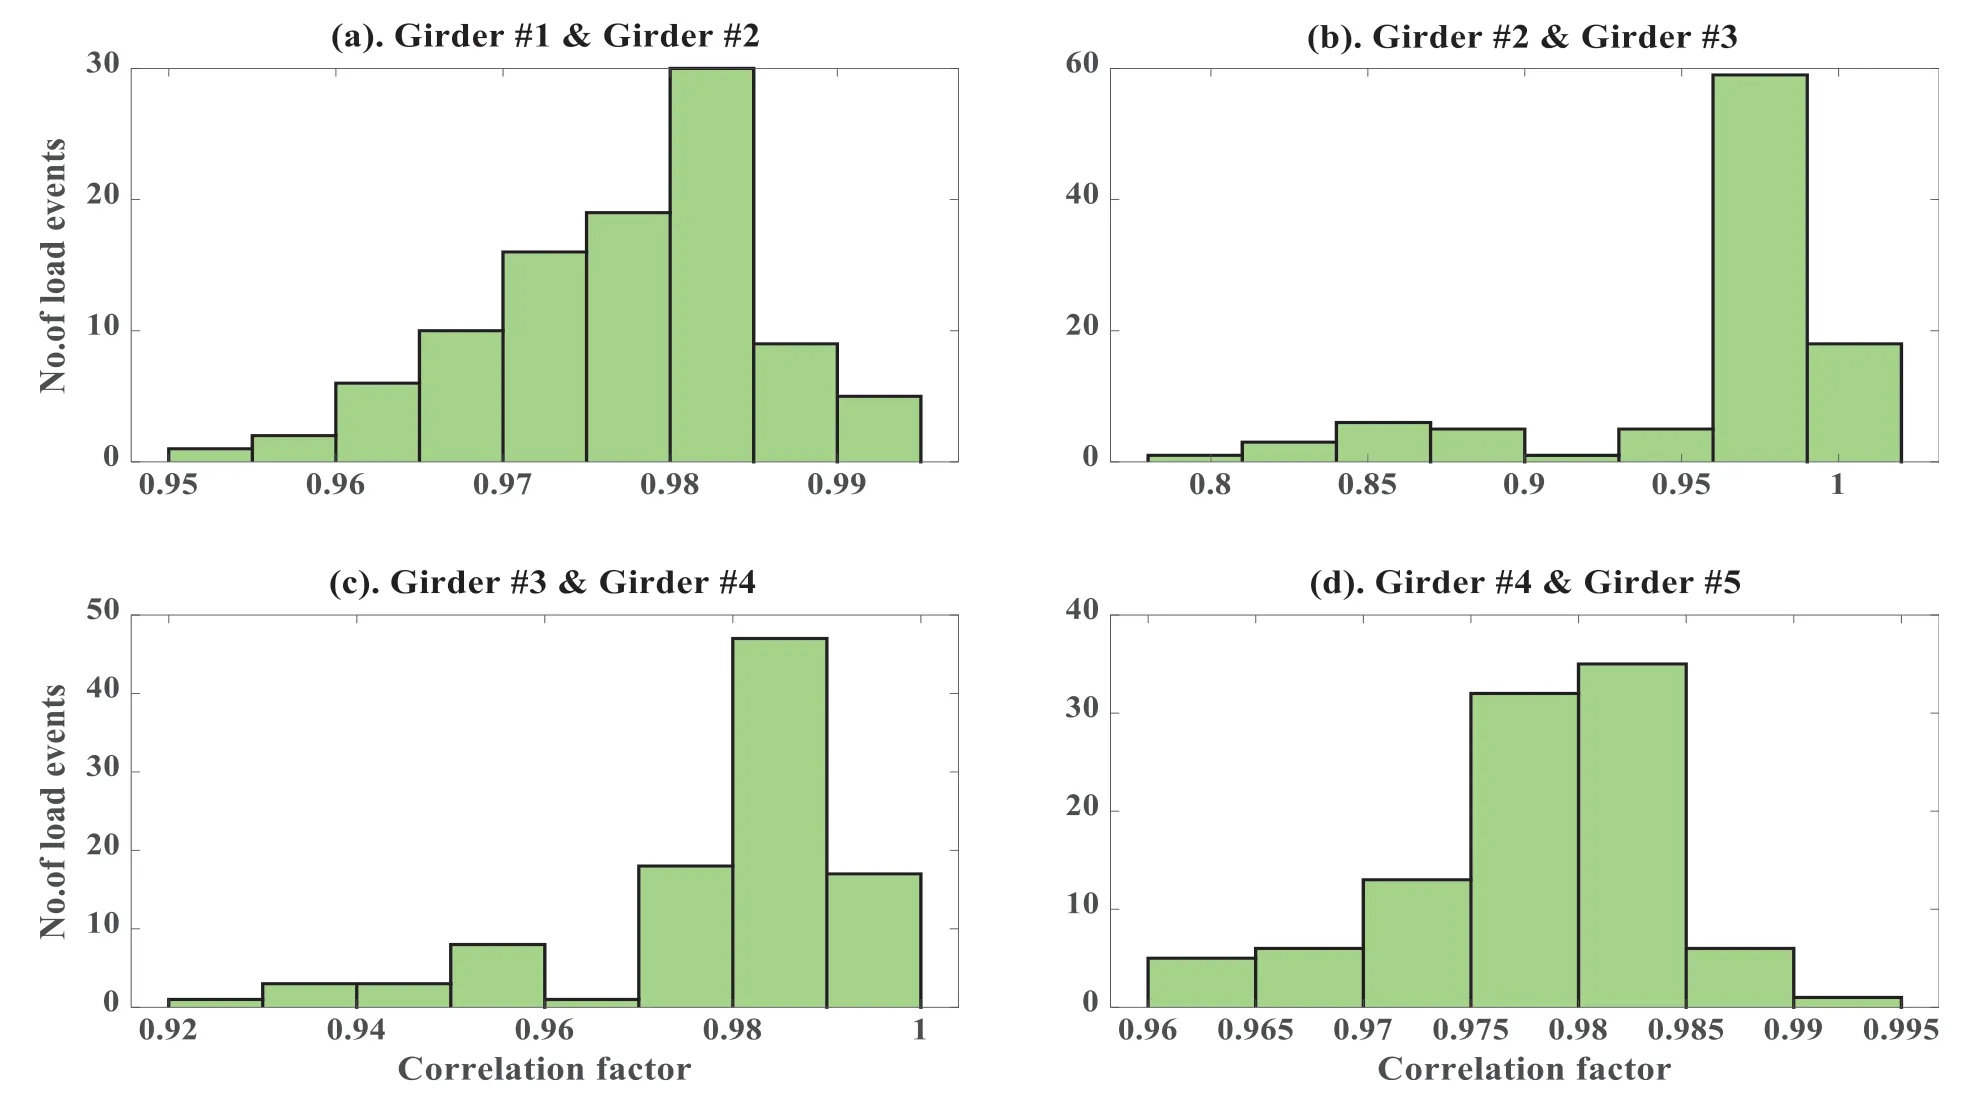
Figure 14: Correlation measures between various signals state #2
For validation,the correlation measures at two points in the flange(G1,G2)and one in the web(G1)are transformed to the time-frequency domain using wavelet transform.Figs.15 and 16 show clear variation in time-frequency-amplitude representation between response in web and flange for state#1 and state#2.The wavelet surfaces show the relative positions in the time-scale of the point of arrival of the correlated wave modes at the individual sensors and the correlation degree of the individual wave modes(as amplitude along the z-axis).This provides the exact behavior of the frequency content and its variation over time, allows a chance to study the signal energy density simultaneously in time and frequency, and is also useful in reducing noise from the signal.It was observed that the time-frequency-amplitude representations of state#1 and state #2 showed significant changes.Thus this can be used as an indicator of any default to the bridge deck.
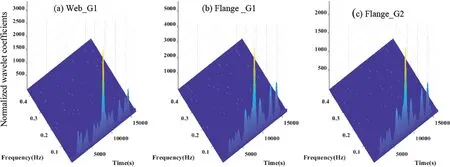
Figure 15: Time-frequency-amplitude representation of correlation coefficients of state #1
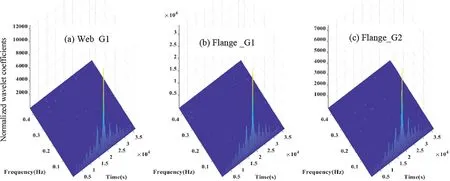
Figure 16: Time-frequency-amplitude representation of correlation coefficients of state #2
5.3 Analysis Based on Power Spectrum Estimation
Besides, Power Spectral Density(PSD)is computed using Welch’s method.Figs.17 and 18 show the power spectral density of state#1 and state#2,respectively.By investigating and comparing the PSD of two states,it is clear that there is variation in power along the frequency axis.The changes in the PSD can be used as an indicator of abnormality in bridge deck.Also,it can be used to reduce the noise effect in the signal and to trace the defaults in bridge condition during its service through the curvature of the power spectrum density.
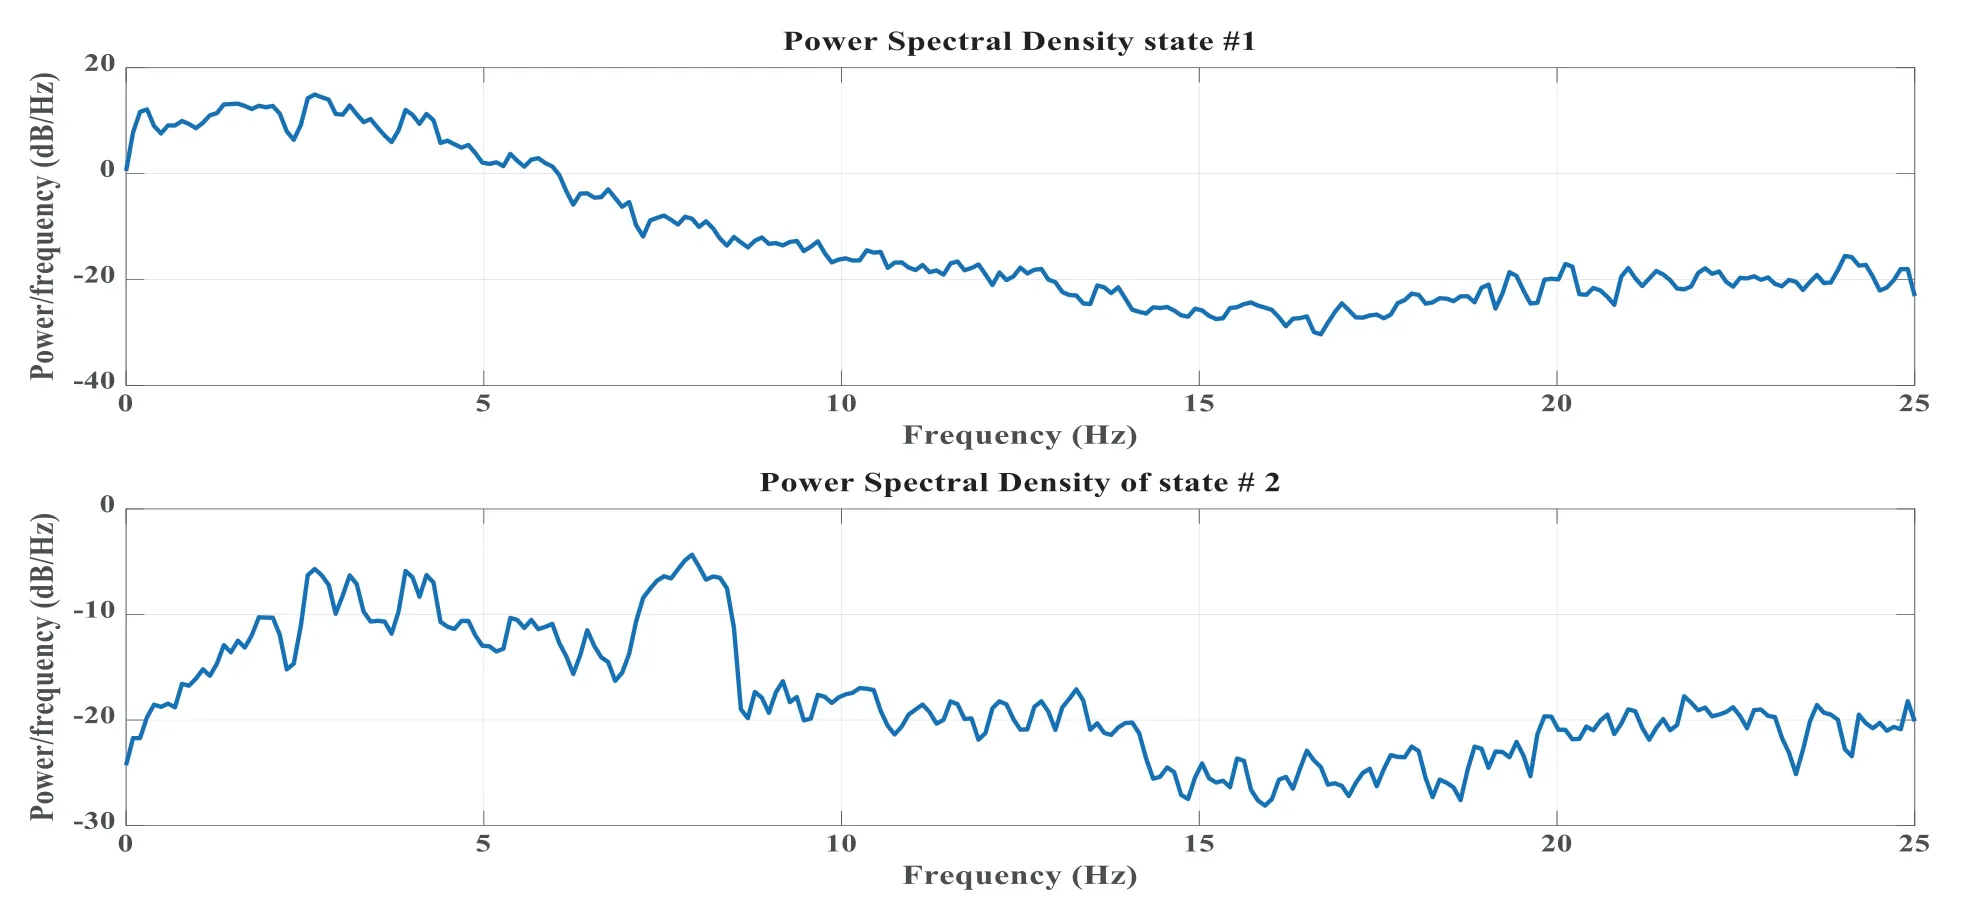
Figure 17: Power spectrum density at various point of bridge.Girder #1
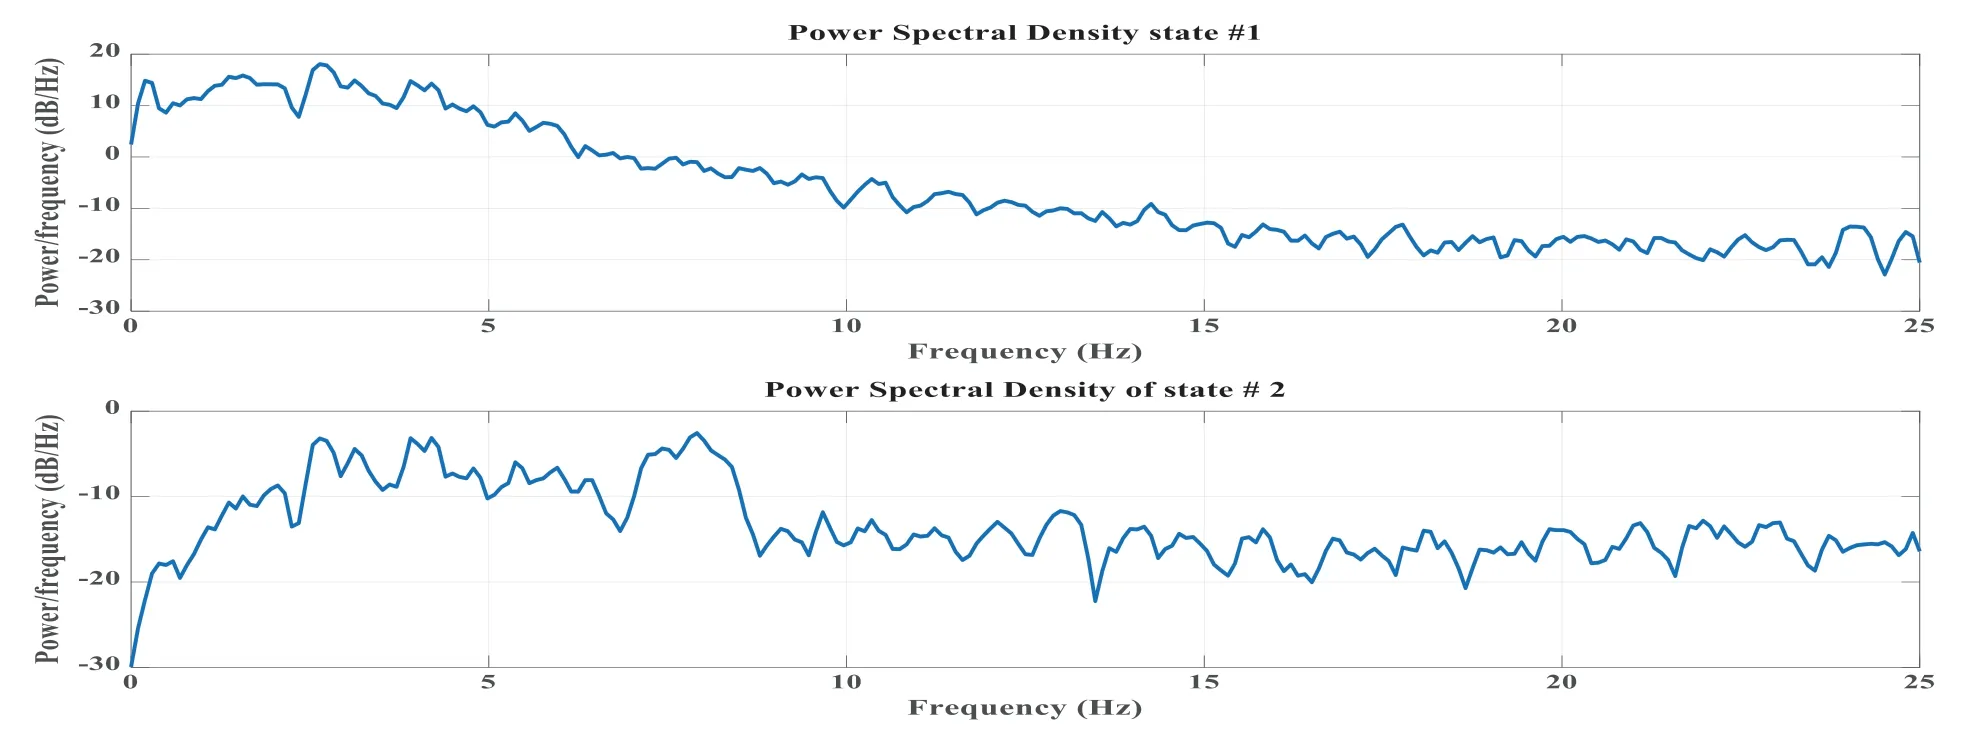
Figure 18: Logarithm of power spectrum density at various point of bridge.Girder #2
5.4 Analysis Based on Wavelet Packet Coefficients
Data from state #1 and state #2 of bridge states are decomposed by WPT wavelet packet coefficients(WPCs).The decomposition idea is to start from a scale-oriented decomposition and then analyze the obtained signals on frequency sub-bands.Thus, the signal is filtered into equal-width sub-bands at each level, and the signal energy is portioned among the sub-bands.The wavelet function db3 and decomposition level 4 are chosen from our previous studies [69,70].Fig.19 gives a four-level wavelet decomposition and shows the binary wavelet packet tree and data for node (0, 0) at the top level of the WPD tree.The top level of the WPD tree is the signal time representation.The trade-off between time and frequency resolution increases as each tree level traverses.The signal frequency representation is the bottom of the last level of a fully decomposed tree.The physical changes during the decomposition of each level can be seen in the results.
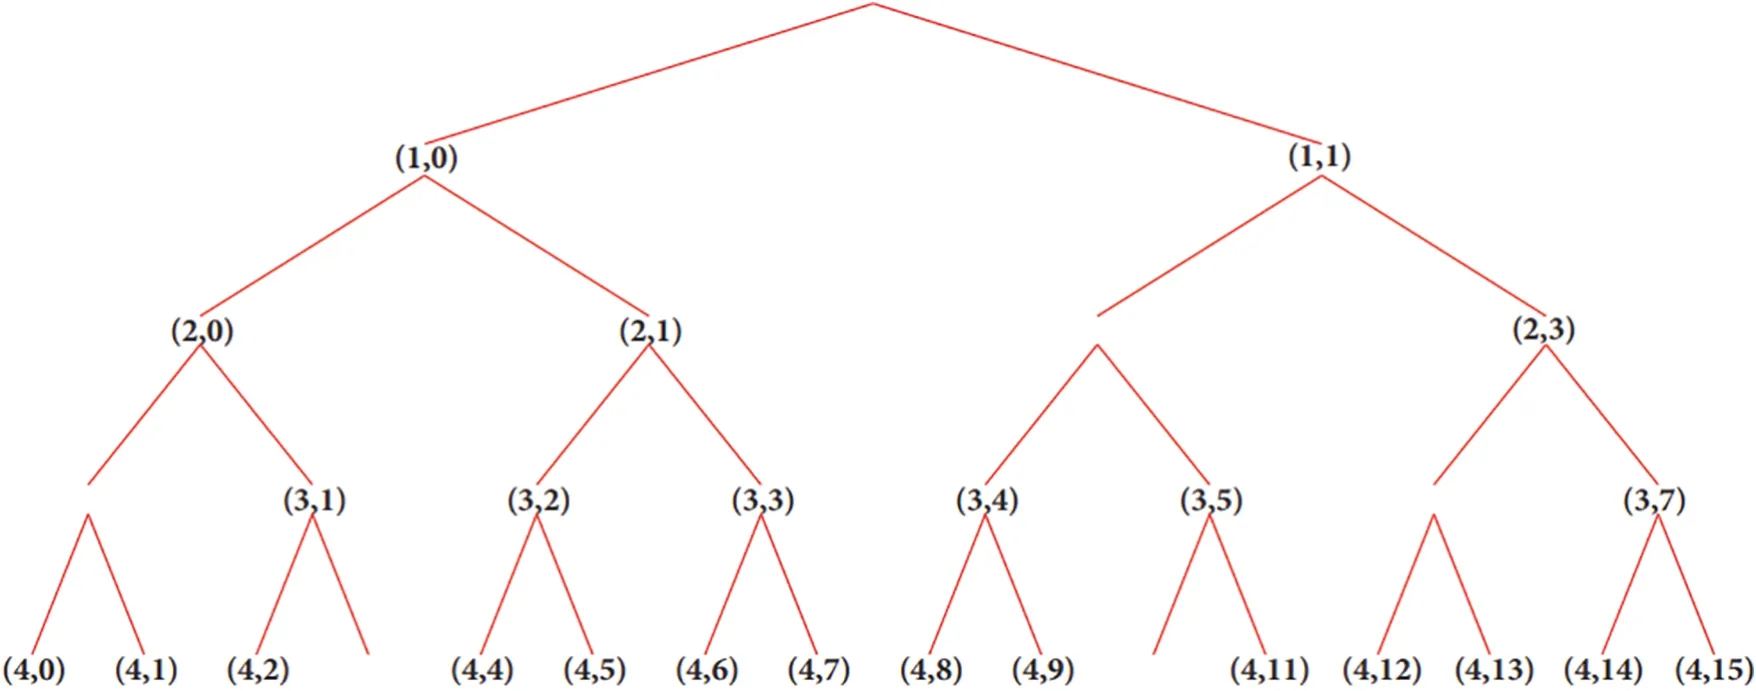
Figure 19: Four-level wavelet decomposition of wavelet packet tree
For graphical illustration, the WPCs corresponding to the 16th node of state #1 and state #2 of knots(4,0), (4,1), (3,0), (3,1) are presented in Figs.20 and 21 as signal frequency representations, respectively.Based on examining the signal frequency representations and by comparing Figs.20 and 21, it is observed that there is a distinguishable difference between the two-state signals, which can be used as an indicator for condition assessments.
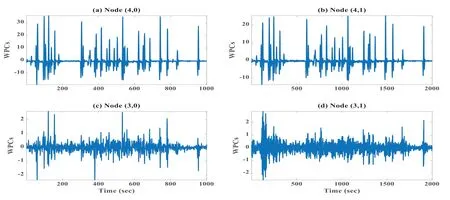
Figure 20: Normalized wavelet packet coefficients at various nodes of wavelet packet tree(State #1)
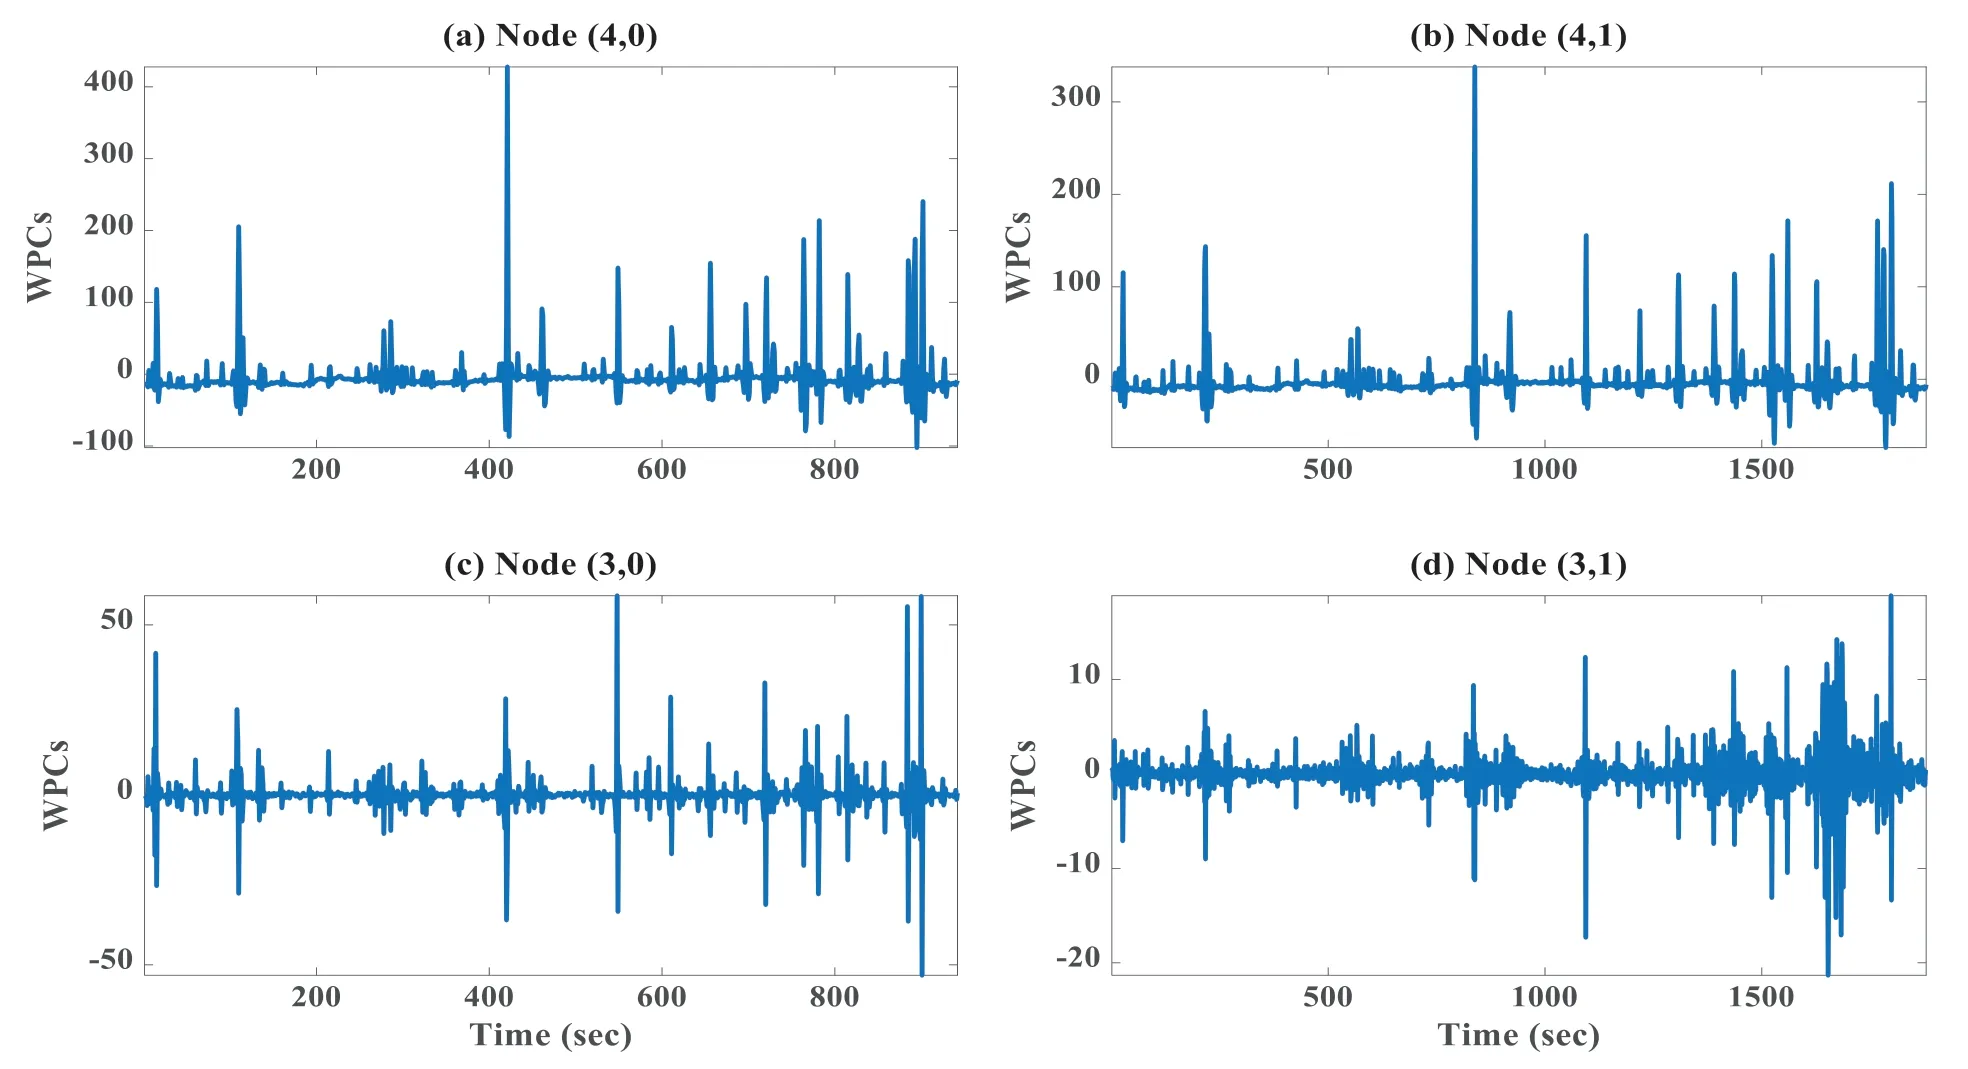
Figure 21: Normalized wavelet packet coefficients at various nodes of wavelet packet tree(State #2)
5.4.1 The Averaged Wavelet Spectrum
Since the Parseval’s theorem also applies to the wavelet packet transform,the power of a wavelet packet node m(or frequency node)was computed as the squared values divided by the number of frequency band nodes.The averaged sum of the scale-averaged wavelet spectrum over all scales is normalized.Fig.22 shows the wavelet frequency average power spectrum which describes the power of a signal distributed over different frequency bands and shows the energy variations strength or at which frequencies variations are strong and at which frequencies variations are weak.
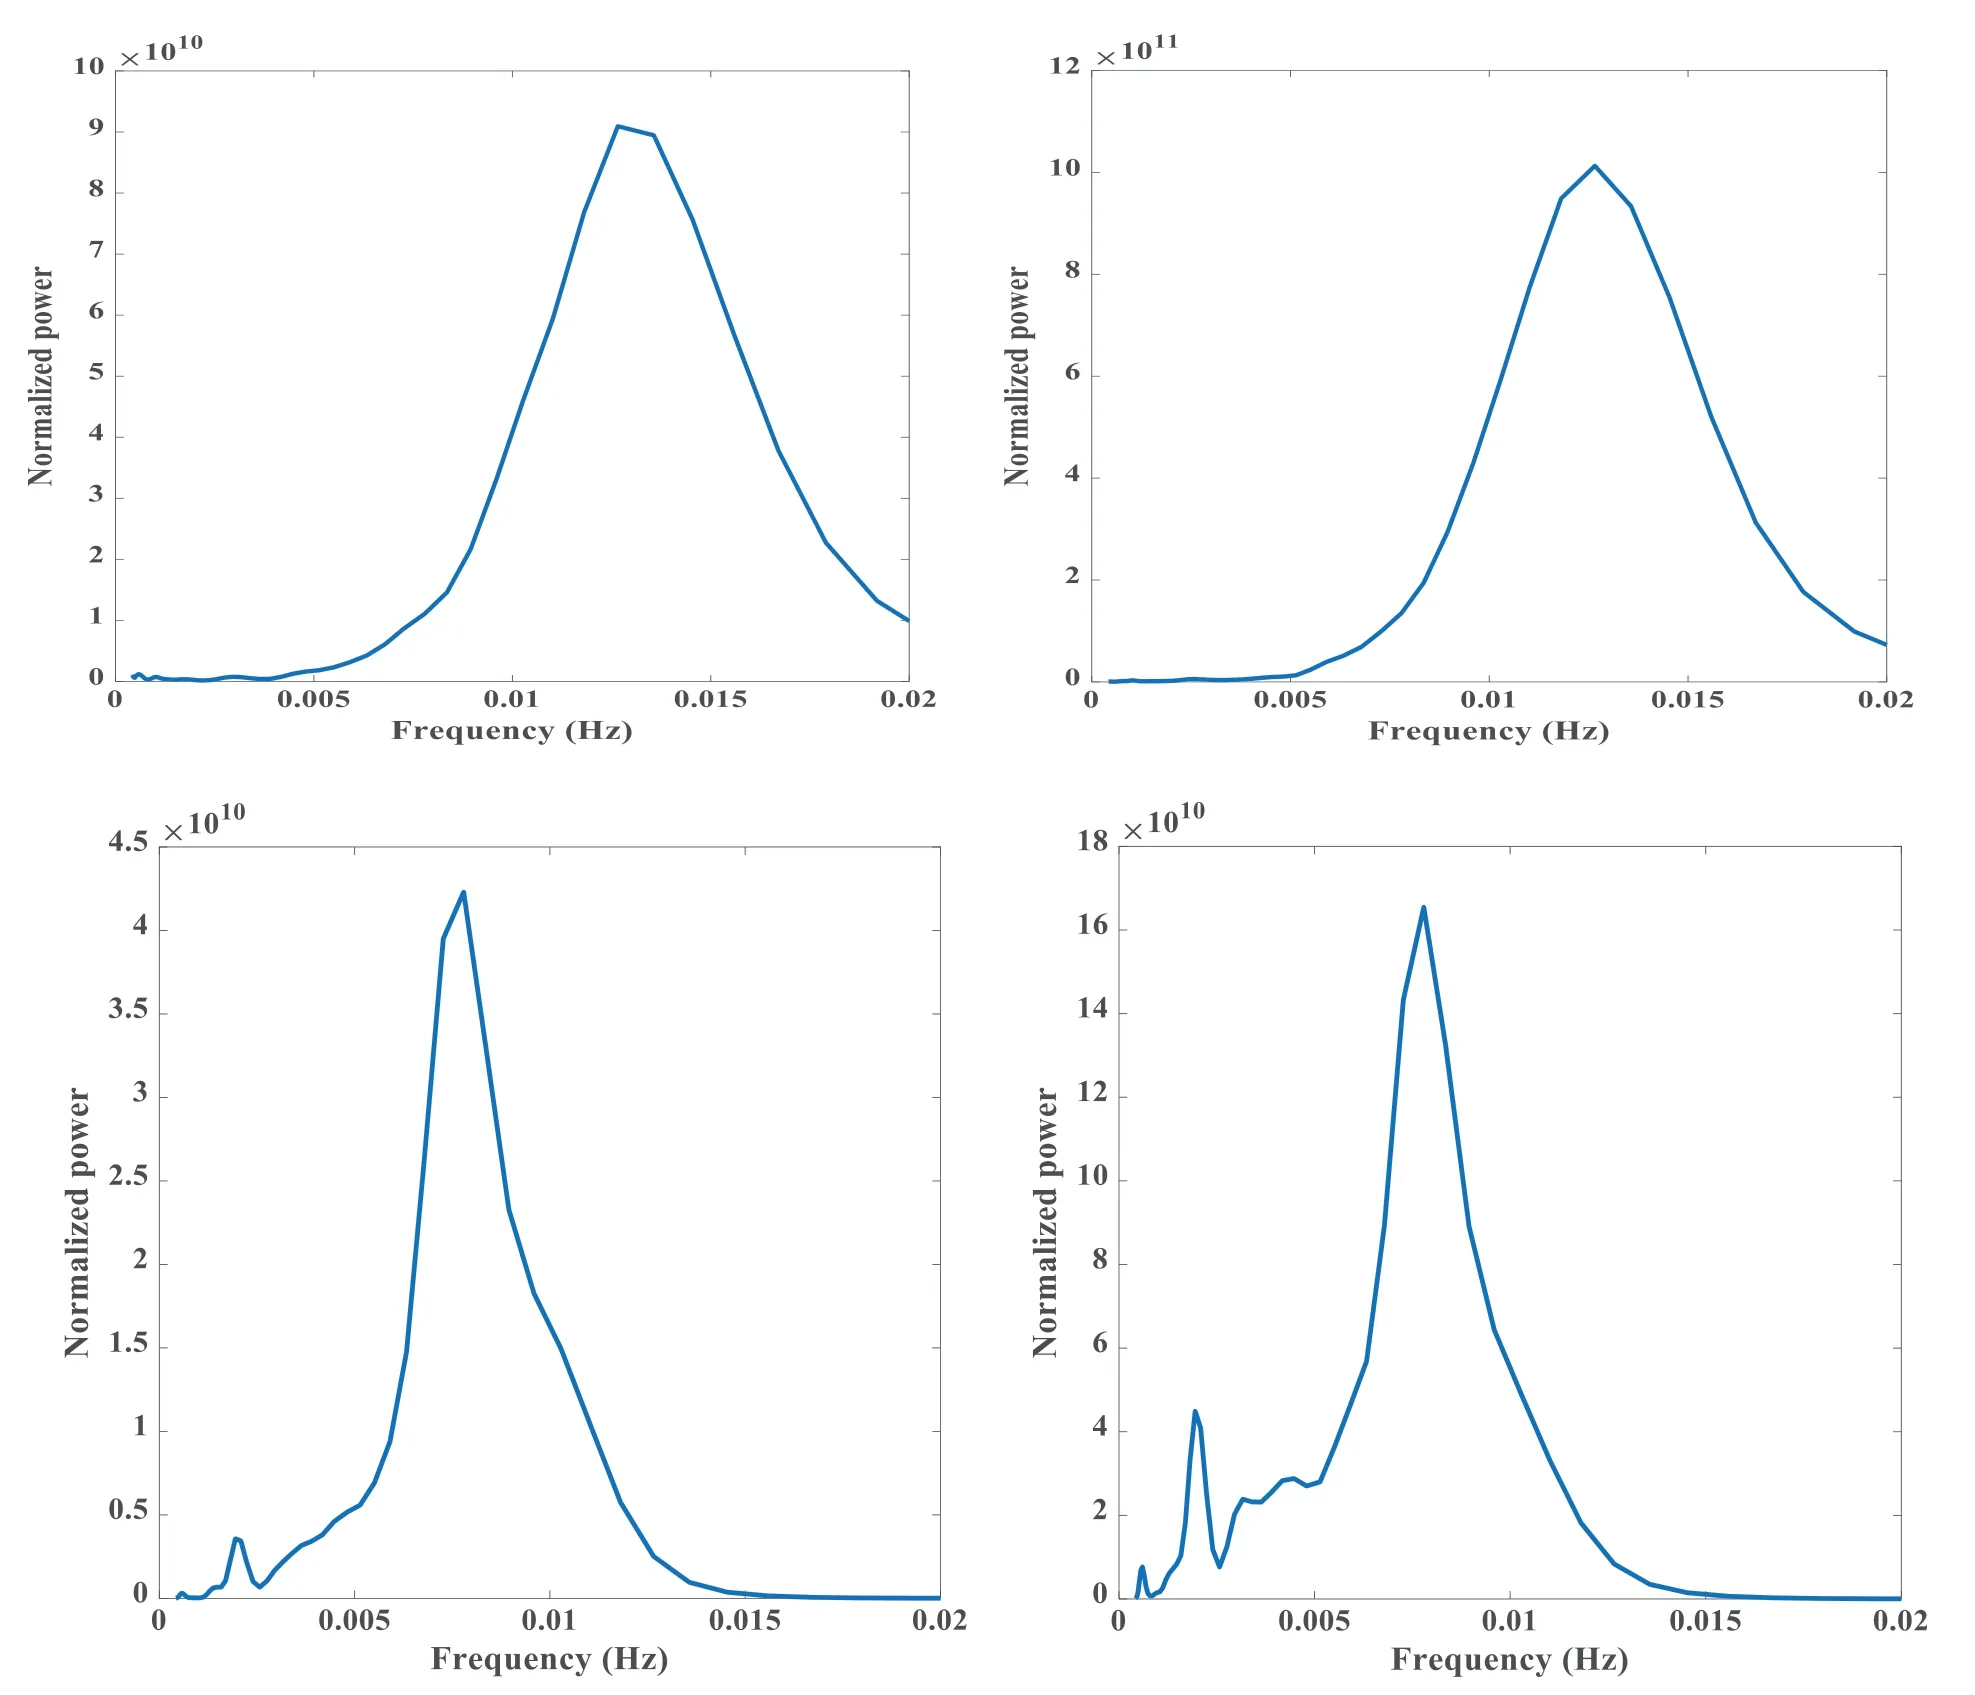
Figure 22: Wavelet frequency average power spectrum at various points of the bridge.The upper low is state #1,and the lower row is state#2
5.4.2 Contour Representation in Time Frequency
To show the energy contents resolved with both frequency and time, contour representation in time frequency is represented.Fig.23 shows contour representation in time frequency.This reflects the energy contents resolved with both frequency and time.This means lower-density areas have weaker amplitudes,and regions with higher density have higher amplitudes.The signal’s frequency content at any given time can be obtained by studying the time-frequency contour.It is observed that most of the signal energy of all signals is concentrated around 0 and 15 frequencies.The revealed time and frequency moment distributions are unique to a specific signal and represent the strain signals in the time-frequency contour.
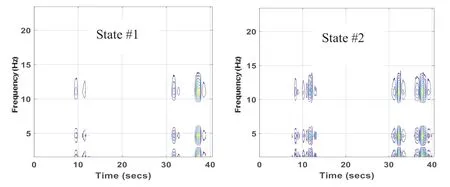
Figure 23: Contour representation in time frequency at flange of girder#1
5.4.3 Energy Curvature Difference
The ECD index is the sum of the content of energy curvature differences after a signal is split by WPT and considers the signals’spatial distribution.Fig.24 shows the energy curvature difference (ECD) index distribution from state #1 and state #2 analysis with scheme of bridge to show the energy curvature variation over nodes of sensors.The figure shows an obvious mutation on the ECD index curve at node seven where the damage is expected to be present.Consequently, the damage severity can be reflected by the amplitude of the mutation point.The amplitude of state #2 is higher than that of state #1, which reflects the damage severity.It is concluded that the proposed ECD index can assess the bridge condition accurately and detect the abnormality.

Figure 24: ECD index for damage of flange_G1
5.4.4 Wavelet Packet Spectrum(WPS)over Time
Fig.25 shows the evolution of the wavelet packet spectrum (WPS) over time at node 5 of the tree of wavelet packet components.It is calculated to detect the characteristic defect frequencies to reveal abnormal symptoms in the structures.It is also used to extract all repetitive transient features (impulses)components in the signals, which can detect characteristic frequencies of the structures’ defects.As it is known, the change in stiffness and frequency indicate the damage occurrence and its severity.The damage decreases stiffness, and consequently, the vibration frequency is affected.It is observed that the wavelet power energy varies with time and fluctuates with an increasing trend.There is a distinguishable difference between the two signals, which can be used as an indicator for damage detection and condition assessments.Also, their variation in amplitude values can be expressed as severity.It is concluded that WPS is sensitive to damage.
5.4.5 Wavelet Energy Evolution over Time
Besides,the change of energy components over time for states#1 and#2 is investigated.Fig.26 shows tracking the signal energy evolution over time to reveal abnormal symptoms in the structures of threechannel for each state.From the comparison of the two states, it is clear that there are variations in the shape and amplitude and definite differences in the intensity distributions.This figure shows the energy variations’ strength or at which frequencies variations are strong and at which ones are weak.There is a distinguishable difference between the two signals, which can be used as an indicator for condition assessments.It is concluded that energy evolution over time.
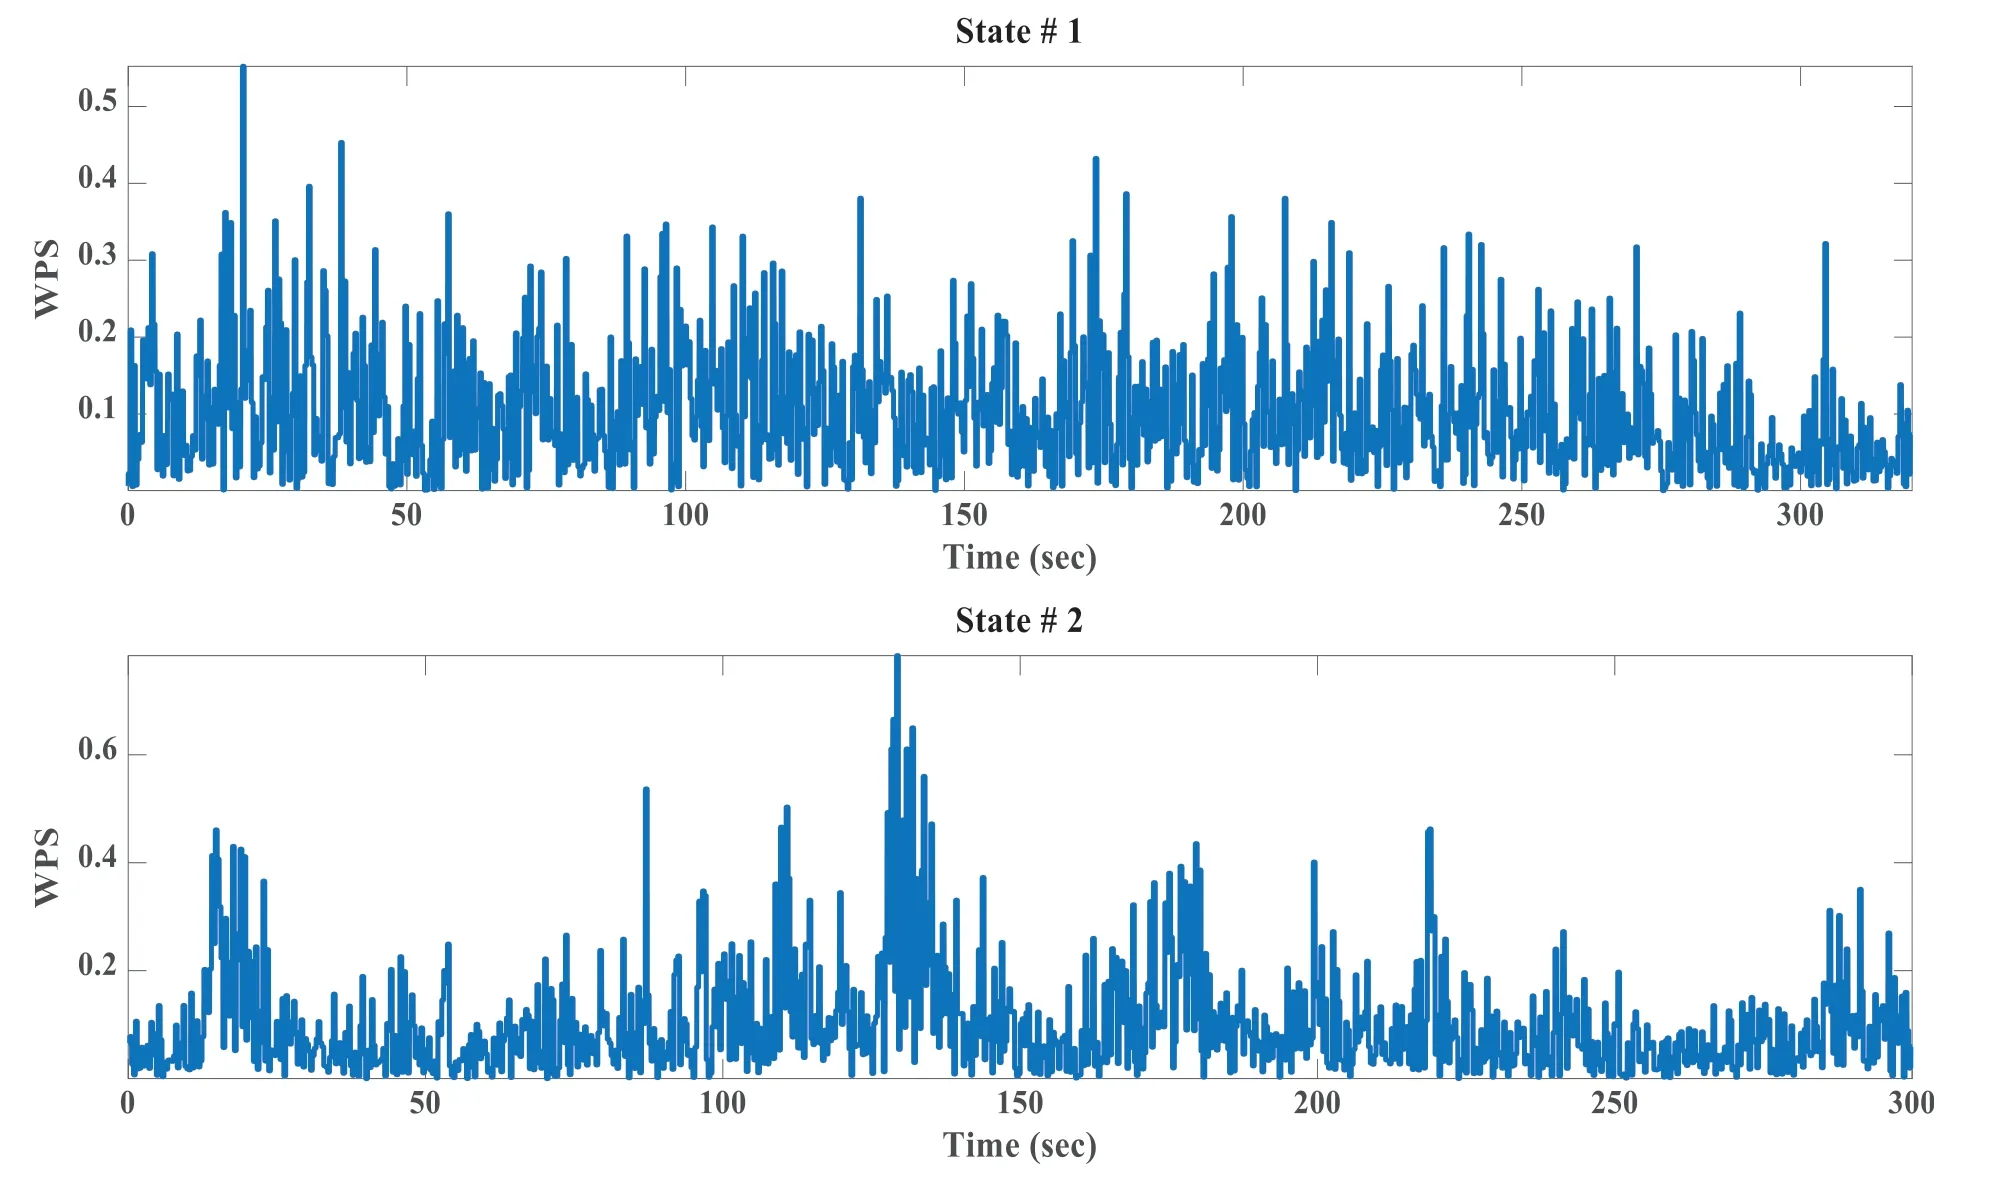
Figure 25: Tracking the signal frequency components evolution overb time of flange_G1
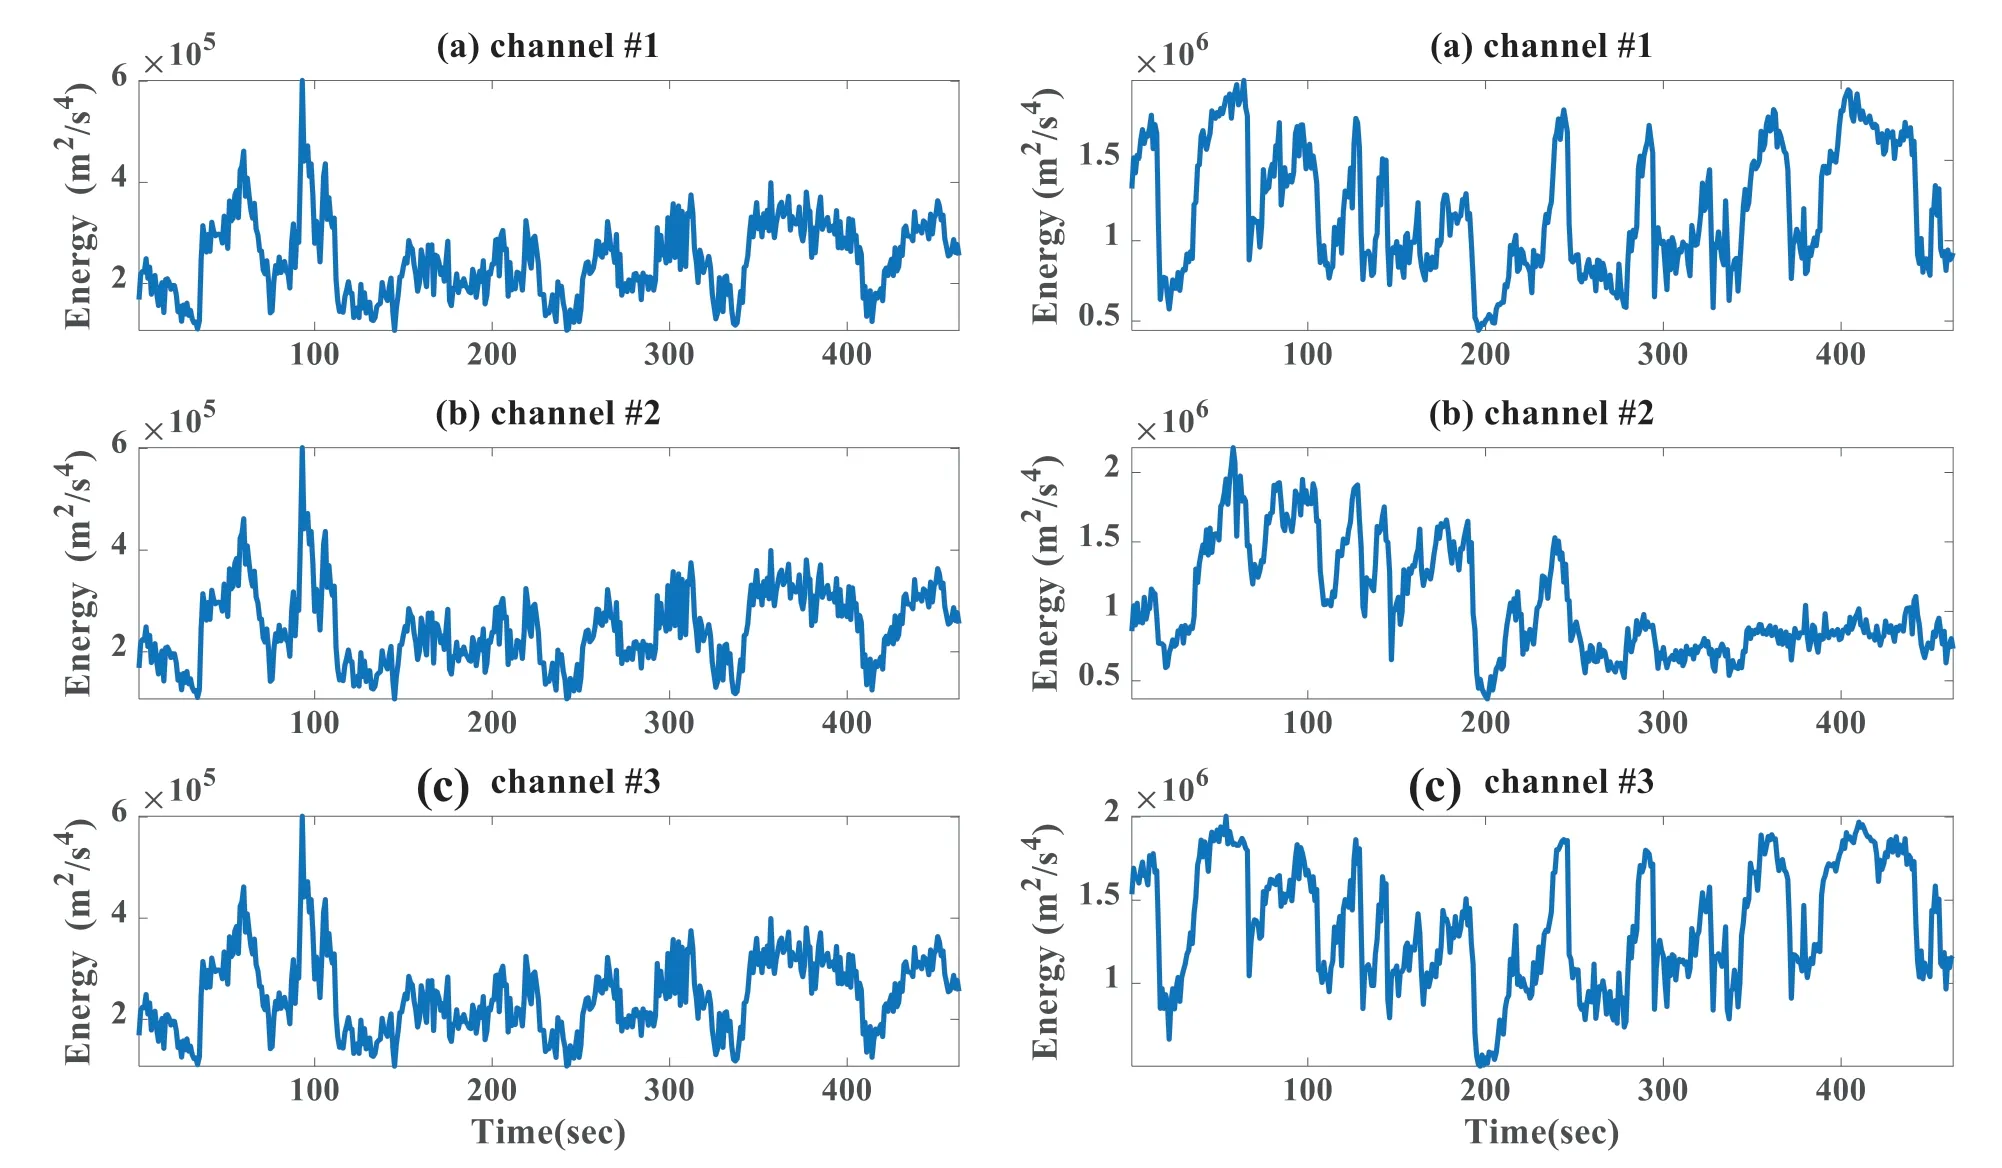
Figure 26: Tracking the energy components’ evolution over time.Left is state #1 and right is state #2
6 Conclusion and Future Work
This paper proposed a new method to assess the bridge deck condition during operation.In the proposed method,we use various damage indices represented in load factor distribution,neutral axis shifts,correlation factor, power spectral density distortion, energy curvature difference, energy components evolution over time, and frequency components evolution over time.Wavelet packet transform is used for signal decomposition using db3 and depth 4.Furthermore, the signal is filtered into equal-width sub-bands at each level and partitions the signal’s energy among the various sub-bands.Real experimental strain data from two bridge statuses of a bridge are used to show further the feasibility and validity of the proposed technique for damage identification.The change in the proposed features is observed.The variation in the correlation values, neural axis shifts, and power spectral density can be used as potential parameters for early abnormalities and bridge deck assessments.
In addition, the wavelet power spectral can be used to reduce the signal’s noise effect and trace the damage through the curvature of the power spectrum energy.Also, the ECD index curve mutation can be employed to assess the bridge deck performance.The absolute difference between the energy curvatures of the intact and the damaged structure increase with the damage.The change in the proposed features is observed.The variation in the correlation values, neural axis shifts, and power spectral density can be used as potential parameters for early abnormalities and for bridge deck assessments.At the same time,the wavelet packet spectrum varies with time and fluctuates with an increasing trend.We concluded that the proposed approach could effectively assess the bridge deck condition.Also, the wavelet packet transform’s ability to provide nonlinear and non-stationary features makes it an effective tool for structural response analysis.In addition, these features can be used as input to an artificial neural network classifier for damage classification.However, more research needs to be performed to confirm the given method’s robustness and show the effectiveness of the proposed features for damage detection and condition assessment.
Funding Statement:The authors received no specific funding for this study.
Conflicts of Interest:The authors declare that they have no conflicts of interest to report regarding the present study.
 Structural Durability&Health Monitoiing2023年4期
- Structural Durability&Health Monitoiing的其它文章
- Research on Breeze Vibration Law and Modal Identification Method of Conductor Considering Anti-Vibration Hammer Damage
- Weak Fault Detection of Rotor Winding Inter-Turn Short Circuit in Excitation System Based on Residual Interval Observer
- Speed Measurement Feasibility by Eddy Current Effect in the High-Speed MFL Testing
- Wireless Self-Powered Vibration Sensor System for Intelligent Spindle Monitoring