
Research on Breeze Vibration Law and Modal Identification Method of Conductor Considering Anti-Vibration Hammer Damage
2023-08-14 06:43LongZhaoXudongLuXinboHuangHaoYangandGuozeFeng
Long Zhao, Xudong Lu, Xinbo Huang,Hao Yang and Guoze Feng
School of Information and Electronics, Xi’an Polytechnic University, Xi’an, 710048, China
ABSTRACT In the harsh environment, the structural health of the anti-vibration hammer, which suffers from the coupled effects of corrosion and fatigue damage,is significantly reduced.As part of the conductor structure,the anti-vibration hammer is rigidly attached to the conductor, effectively suppressing conductor vibration.The conductor’s breeze vibration law and natural modal frequency are altered damage to the anti-vibration hammer structure.Through built a vibration experiment platform to simulate multiple faults such as anti-vibration hammer head drop off and position slippage, which to obtained the vibration acceleration signal of the conductor.The acceleration vibration signal is processed and analyzed in the time and frequency domains.The results are used to derive the breeze vibration law of the conductor under multiple faults and propose an anti-vibration hammer damage online monitoring technology.The results show that the vibration acceleration value and vibration intensity of the conductor are significantly increased after the anti-vibration hammer damage.The natural frequency increases for each order, with an absolute change ranging from 0.15 to 6.49 Hz.The anti-vibration hammer slipped due to a loose connection, the 1st natural frequency increases from 8.18 to 16.62 Hz.Therefore, in engineering applications,there can be no contact to determine the anti-vibration hammer damage situation by monitoring the modal natural frequency of the conductor.This is even a tiny damage that cannot be seen.This method will prevent the further expansion of the damage that can cause accidents.
KEYWORDS Transmission line conductor;anti-vibration hammer;breeze vibration;modal parameter;vibration characteristic
1 Introduction
In power systems,transmission line safety is a topic of widespread concern,and it is related to all aspects of people’s lives[1–3].The conductor has low damping characteristics.It is easy to breeze vibration under wind load excitation of 0.5~10 m/s.The amplitude of vibration generally does not exceed 2~3 times the diameter of the conductor, and frequency range is about 3~120 Hz [4].Long-term breeze vibration is likely to cause fatigue of the conductor material.Finally, it causes broken strands and broken lines in accidents,which seriously threaten the safety of transmission lines [5,6].
In order to reduce the harm caused by vibration,G.H.Stockbridge invented the “Stockbridge” damper,which provides an important reference for the design of anti-vibration hammers[7].Some scholars derived the equations of motion.The results gave the expressions for frequency equation, modal vibration pattern,and nonlinear frequency.The resonant frequencies of the Stockbridge damper were also measured.The correctness of the analytical model was verified by experiments [8].A part of scholars studied the mechanical model of the nonlinear mechanical properties by using numerical and experimental analysis methods.The computational model of the conductor for installing the anti-vibration hammer was obtained [9,10].Some other scholars proposed a new analytical model of the wind vibration damper that can increase the resonant frequency, which is used to derive the resonant frequency of the anti-vibration hammer.The correctness of the model was verified by a three-dimensional finite element method [11].According to these studies, scholars are more concerned with how to improve the anti-vibration hammer’s vibration control and rarely research on the damage anti-vibration hammer model.But in the harsh environment, the structural health of the anti-vibration hammer, which suffers from the coupled effects of corrosion and fatigue damage, is significantly reduced.This is a serious threat to the safety of transmission lines.Therefore, it is necessary to obtain the effect of damaged anti-vibration hammers on the breeze vibration law.
As the anti-vibration hammer is installed on the transmission line conductor where it is located in wild environment,it is difficult to discover faults in a timely manner through manual inspection.Anti-vibration hammer suspended at high altitude,it is difficult to clearly find the fault with the naked eye.Many scholars non-contact measured anti-vibration hammer damage by image recognition method.But the image recognition method still has some problems, such as the installation location of the camera, blind area,weather effects, etc.[12].Some scholars have attempted to use an eddy current sensor to measure local defects and determine damage by magnetic field.But the magnetic field around the transmission line is also variable, and these variations have a considerable impact on the eddy current sensor [13].A number of scholars have also designed an online cantilever beam monitor for amplitude measurement, but it is difficult to find structural changes [14].In recent years, significant progress has been made in structural health monitoring for structural feature identification, structural damage identification, and condition assessment [15–17].In the field of structural health monitoring, modal parameters can reflect vibration characteristics, structural features, and health status [18].However, there are few studies on the modal parameters of the transmission line conductor.After the damage to the anti-vibration hammer structure,the breeze vibration law of the conductor will also change.By monitoring the vibration signal, the modal parameters are obtained from the vibration signal, thereby obtained the degree of damage.This is an extremely effective method.
This paper firstly introduces the principle of anti-vibration hammer damage monitoring,the construction of conductor vibration experiment platform,and the experiment method.Secondly,the vibration acceleration signal is analyzed in the time and frequency domains.The effect of the anti-vibration hammer on the vibration characteristics is obtained.Then simulate the anti-vibration hammer head drop off, position slippage and perform the vibration experiment.The breeze vibration response characteristics of the conductor under different faults are solved.Through the modal method to analyze the impact of antivibration hammer damage on the modal natural frequency.Finally, the implementation of online monitoring technology is described,and the work in this paper is summarized.
2 Principle
As shown in Fig.1, the anti-vibration hammer usually consists of two recessed cylindrical counterweights.They are rigidly attached to the ends of the messenger cable.The messenger cable is rigidly suspended from the transmission line conductor by a clamp [19].The anti-vibration hammer is installed on the conductor as part of the overall transmission line conductor.When its structure is changed,the breeze vibration characteristics of the conductor are subsequently changed.
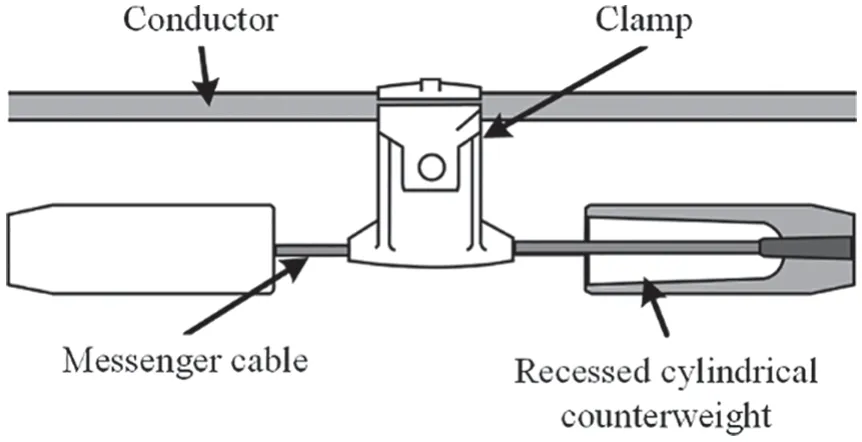
Figure 1: Anti-vibration hammer structure schematic
For the study of structural vibration characteristics,scholars usually use modal parameters for analysis.The modal parameters, as natural properties of the structure itself, can characterize the health state of the structure.The natural frequency is a sensitive indicator of structural integrity.It is an extremely effective method for determining structural damage by extracting the natural frequency.It used the change in natural frequency as an indicator of damage [20–23].During actual operation, conductors are suspended between two towers with a certain arc sag under normal conditions.The anti-vibration hammer is installed on both sides of the suspension clamp [24].The transmission line conductor is a multidegree-offreedom viscous damping system, which presents a multidegree-of-freedom vibration phenomenon under a wind load.The vibration equation for a transmission line conductor can be expressed as Eq.(1)[25,26]:
where M, C, and K are the mass, damping and flexural rigidity matrices for the conductor structure,respectively; x(t) is the displacement response time vector of the conductor structure; t is the time vector;and f(t) is the time vector for the excitation signal of the transmission line conductor vibration, i.e., the wind load action.
In actual operation, factors other than wind load can lead to vibration.From Eq.(1), although the excitation on the right side of the equation changes, the flexural rigidity and mass of the transmission line conductors do not change.Different excitations with different frequency bands can excite modes of different orders.However, there is almost no effect on the modal parameters of the system [27].The antivibration hammer is rigidly mounted on the conductor as part of the overall conductor structure.When the anti-vibration hammer is damaged, the flexural rigidity matrices K and damping C of the conductor will change.As a result, the structural modal natural frequency of the conductor changes.According to this characteristic, the paper attempts to monitor the vibration signal of the conductor, extract the structural state from the vibration signal,and realize online monitoring of the anti-vibration hammer damage.
3 Data Collection and Research
3.1 Experimental Platform Construction
In order to analyze the breeze vibration law after anti-vibration hammer damage,this paper designs and constructs an experimental platform for transmission line conductor vibration.The modal parameters of conductors are mainly related to their length, pretension, mass per unit length, and flexural rigidity [28–30].The transmission line vibration experimental platform is shown in Fig.2 and includes conductor tightener, conductor, shaker excitation device, accelerometer, tension sensor, contact terminal, and antivibration hammer.The shaker is located at two-thirds the length of the conductor.
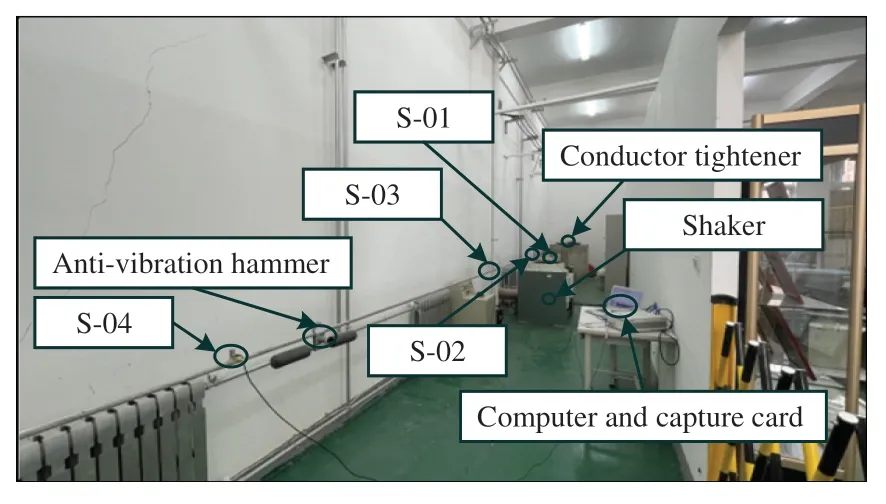
Figure 2: Transmission line vibration experimental platform
Vibration experiments using the model LGJ95-15.The LGJ95-15 basic parameters are shown in Fig.3.The anti-vibration hammer uses the FD-2 type.In order to minimize the measurement error caused by temperature changes, the room temperature is kept at 27°C, and the error does not exceed 1°C.When the conductor is operated outdoors, it is subject to axial tension at both ends.In this paper, the axial tension is applied to the conduct by the conductor tightener.The tension value is measured by a tension sensor,and the conduct tension was 1734 N in the experiment.
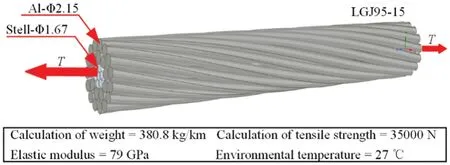
Figure 3: Basic parameters of LGJ95-15 conductor
Because the conductor contains multiple vibration components, a total of four accelerometers are installed in this paper.One of the accelerometers, S-01, is installed on the shaker and is used to measure the vibration excitation signal.The other three accelerometers, S-02, S-03, and S-04, are installed on the conductor and are used to measure the vibration acceleration of the conductor.The S-02 position is 890 mm from the left end of the contact terminal, the S-03 position is located in the middle of the conductor, and the S-04 position is 890 mm from the right end where the conductor is connected to the shaker, as shown in Fig.4.After the accelerometer is set, adjust the parameters to the calibration value.To ensure that the vibration signal below 90 Hz will not be distorted and is conducive to lighter data processing, the sampling frequency is set to 500 Hz.The accelerometer model used in the experiment is TST120A500.Specific parameters: the axial sensitivity is 50 mv/g, the measurement range is 0–100 g,the acquisition frequency is 0.2–2500 Hz.
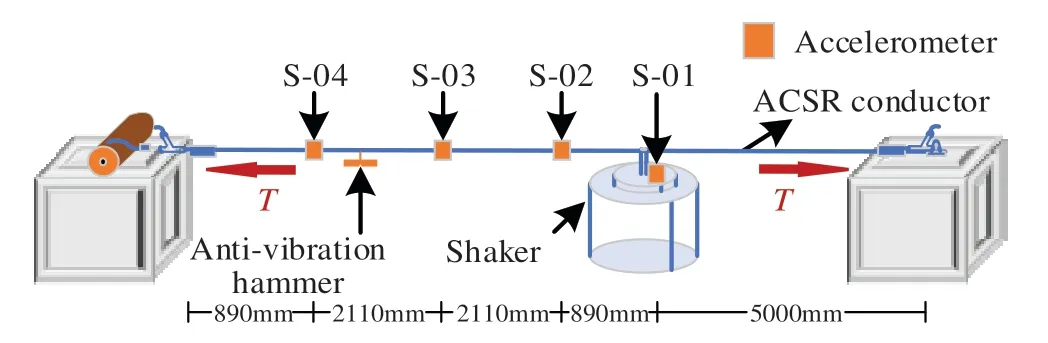
Figure 4: Diagram of the sensor installation position
3.2 Data Acquisition
Before data analysis, the conductor vibration signal is disturbed due to phenomena, such as corona discharge and local flashover of the transmission line [31].Zero-point drift, unstable low-frequency performance, and other problems, causes the long period component to be strung into the vibration signal, which shifts the signal away from the baseline.This eventually leads to a trend term in the signal.In the conductor vibration signal, the trend term may produce low-frequency peaks that drown out the high-frequency signal, making the conductor vibration signal completely distorted.Therefore, it is necessary to use signal filtering,so as to eliminate interference and trend terms.
Theoretical conductor vibration range of 5–120 Hz,the actual measurement of the conductor’s breeze vibration amplitude is not more than double its diameter.At high frequencies(>90 Hz),vibration amplitude is very small.At this time,the vibration on the conductor caused by the value of harm with the increase in frequency becomes negligible.Therefore,the shaker was set to perform sinusoidal vibration in sweep mode,with a frequency range of 5–90 Hz and a vibration period of 300 s.To ensure the accuracy of the measurement, the acceleration values collected by the four accelerometers were recorded simultaneously,and the experiment was repeated four times.Fig.5 shows the time domain waveforms of the vibration acceleration signals in the experiment.As shown in Fig.5a, the vibration excitation acceleration is 1.0 g,and the frequency is increasing with time from 5–90 Hz.With the increase in vibration excitation signal frequency, many peak points appear in the time domain signal of the vibration acceleration of the conductor, as shown in Figs.5b–5d.It can be inferred that the resonance occurs at these points.For a multi-degree-of-freedom viscous damping system such as a conductor, there are multiple orders of natural frequencies.The more peaks in Fig.5b, it means that the natural frequency acquired by accelerometer S-02 is complete.

Figure 5: Time-domain waveform of vibration acceleration.(a) S-01,(b) S-02,(c) S-03,(d)S-04
The breeze vibration is in the vertical direction,so the accelerometer is installed in the vertical direction during the experiment.As shown in Fig.5b, the higher acceleration values at four times: 64.71, 109.02,157.46 and 264.9 s, indicated that the direction of freedom of the natural frequency is close to the vertical direction at this time.Breeze vibration causes more damage to the conductor in the vertical direction during actual operation.It should pay attention to these frequencies.On the other hand, the conductor breeze vibration is a sinusoidal vibration, so the vibration amplitudes of the accelerations collected by S-02,S-03, and S-04 at the same time are not equal.
In this paper, we use the adaptive filtering method.Because of the conventional filters, parameter settings require statistics on vibration frequencies.According to the magnitude of the vibration frequency,adaptive filtering method can automatically adjust the center frequency and bandwidth of the filter.There is no need to statistic the vibration frequencies.The mean value and linear trend are removed after filtering,making the vibration signal characteristics easily identifiable.In order to see the change in acceleration waveform after filtering in detail, this paper takes one section of a waveform to illustrate.Figs.6 and 7 are the time domain waveforms of the excitation acceleration signal and the conductor vibration acceleration signal.It can be seen that the signal before filtering has burrs, and the waveform after filtering becomes continuous and smooth.
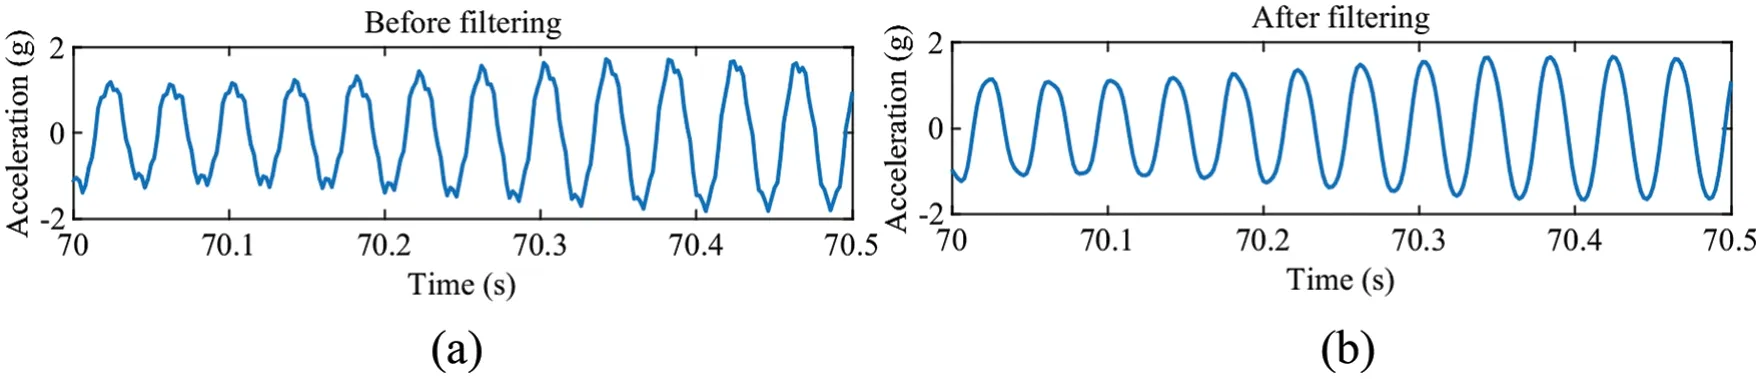
Figure 6: Conductor vibration acceleration.(a) Before filtering,(b)After filtering
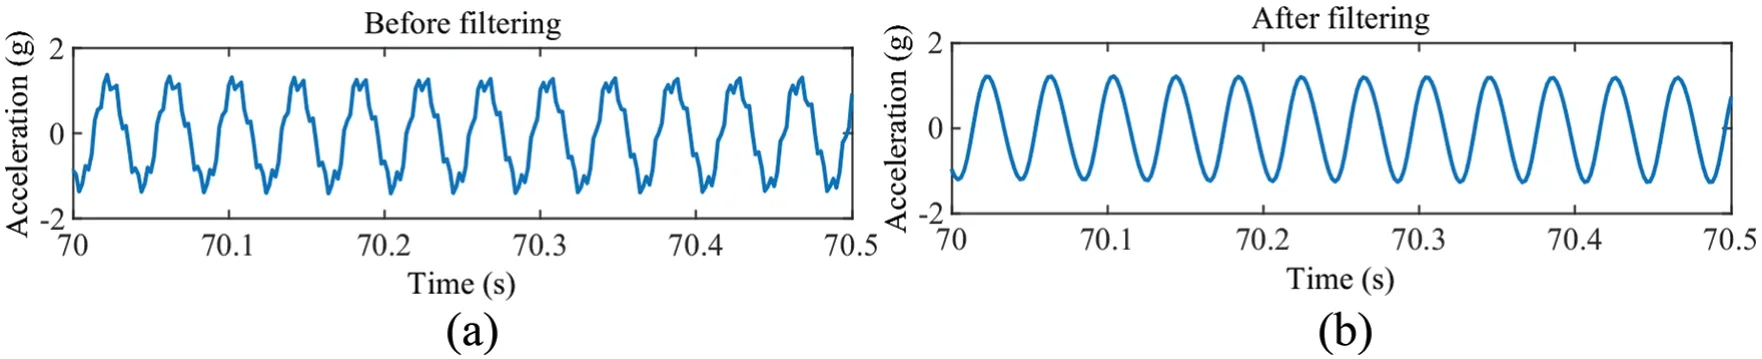
Figure 7: Excitation acceleration.(a) Before filtering,(b)After filtering
4 Result and Discussion
4.1 Impact of Hammer Head Drop on Conductor Vibration
In this paper, the vibration characteristics of the hammer head drop-off are first experimentally investigated.The physical diagram of the hammer used in the experiment is shown in Fig.8.The antivibration hammer installation distance is usually proposed by the design, and the installation distance can also be calculated based on the maximum half-wavelength and minimum half-wavelength.However, in actual operation, the anti-vibration hammer connection loosens and slips off to other positions.In order to obtain the conductor breeze vibration law after the hammer head is dropped off.Vibration experiments were conducted in this paper.The anti-vibration hammer is installed at the following distances from the contact terminal: 1, 2, and 3 m.Simultaneous collection of conductor vibration acceleration signals during the experiment.As shown in Fig.9, for the conductor vibration acceleration time domain signal at 1 m from the contact terminal.The maximum acceleration of the conductor vibration after the hammer head is dropped in the time domain is the signal collected at 94.72 s by the S-03 sensor.The maximum acceleration is 31.11 g.Because the hammer head is not dropped, the transmission line conductor vibration is suppressed in Figs.9b–9h.The maximum acceleration of the conductor vibration in the time domain is the signal collected at 66.30 s by the S-03 sensor.The maximum acceleration is 26.31 g.The amplitude of conduct vibration acceleration increases significantly after the hammer head falls off, as shown in Fig.9.

Figure 8: Anti-vibration hammer physical diagram
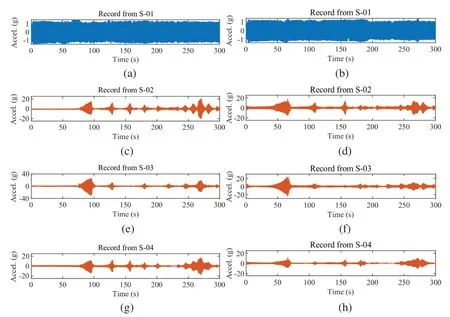
Figure 9: Time-domain waveform of conductor vibration acceleration at 1 m from the contact terminal.(a)Hammer head drop-S-01, (b) Hammer head did not drop-S-01, (c) Hammer head drop-S-02, (d) Hammer head did not drop-S-02, (e) Hammer head drop-S-03, (f) Hammer head did not drop-S-03, (g) Hammer head drop-S-04,(h) Hammer head did not drop-S-04
As shown in Fig.10,this paper extracts the spectra diagram from the acceleration signal by the wavelet transform method.The acceleration time domain diagram is listed above the frequency domain diagram as a comparison.The blue area in Fig.10 indicates the frequency domain range of the lower conductor vibration intensity, and the yellow area indicates the frequency domain range of the higher conductor vibration intensity.It can be seen that there was a significant change in the vibration intensity after the hammer head dropped.After the hammer head drops off, the vibration intensity increases at lower frequencies.Higher frequency also increased, but the degree of increase was smaller.The anti-vibration hammer can effectively absorb the energy when the vibration frequency is low,avoiding too vibration of the conductor.
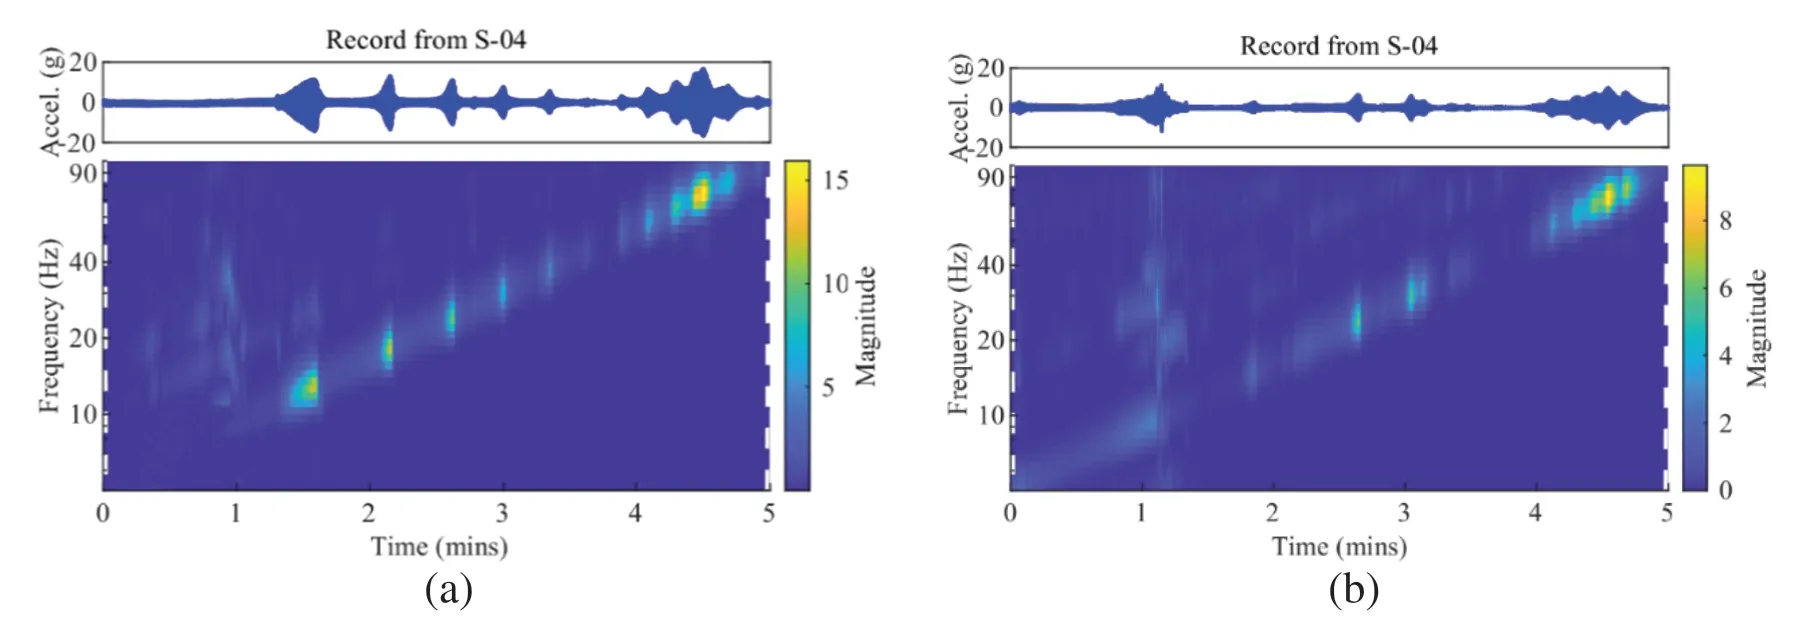
Figure 10: The frequency-domain waveform of conductor vibration acceleration at 1 m from the contact terminal.(a) Hammer head drop, (b)Hammer head did not drop
Transmission line conductors are installed at high altitudes, which are characterized by small cross sections and large spans.If artificial excitation methods, such as knocking, it becomes more difficult to realize.It is more economical and convenient to identify the modal parameters with time-varying wind load excitation.Stochastic subspace identification is a method that extracts the modal parameters of a structure directly under wind load excitation.In this paper, modal calculations are performed using the stochastic subspace identification method.The modal natural frequency results calculated by stochastic subspace identification are shown in Fig.11.The vertical line consisting of red dots in the graph is the natural frequency, and the vertical line is relatively straight.It can be seen that the method can accurately obtain the modal parameters.As shown in Fig.11, the natural frequency of the conductor increases after anti-vibration hammer head drop off.Due to the failure of the anti-vibration hammer, the energy of the vibration cannot be absorbed, which causes the power spectrum density to increase.At lower frequencies,the power spectral density decreases from 4.71 to 0.04 g2/Hz, indicating that the anti-vibration hammer mainly reduces the vibration energy at lower frequencies.

Figure 11: Stochastic subspace identification stable diagram.(a)Hammer head drop,(b)Hammer head did not drop
In this paper,vibration characteristics experiments are conducted by changing the installation position of the anti-vibration hammer several times.The modal natural frequency and the absolute change are calculated for each working condition,as listed in Table 1.On the one hand,as shown in Table 1,the absolute change value increases after the hammer head dropped,with a minimum of 0.15 Hz and a maximum of 6.49 Hz.On the other hand,with the change of position,the modal order is reduced.After the hammer head is dropped,the modal order increases from 8 to 11.
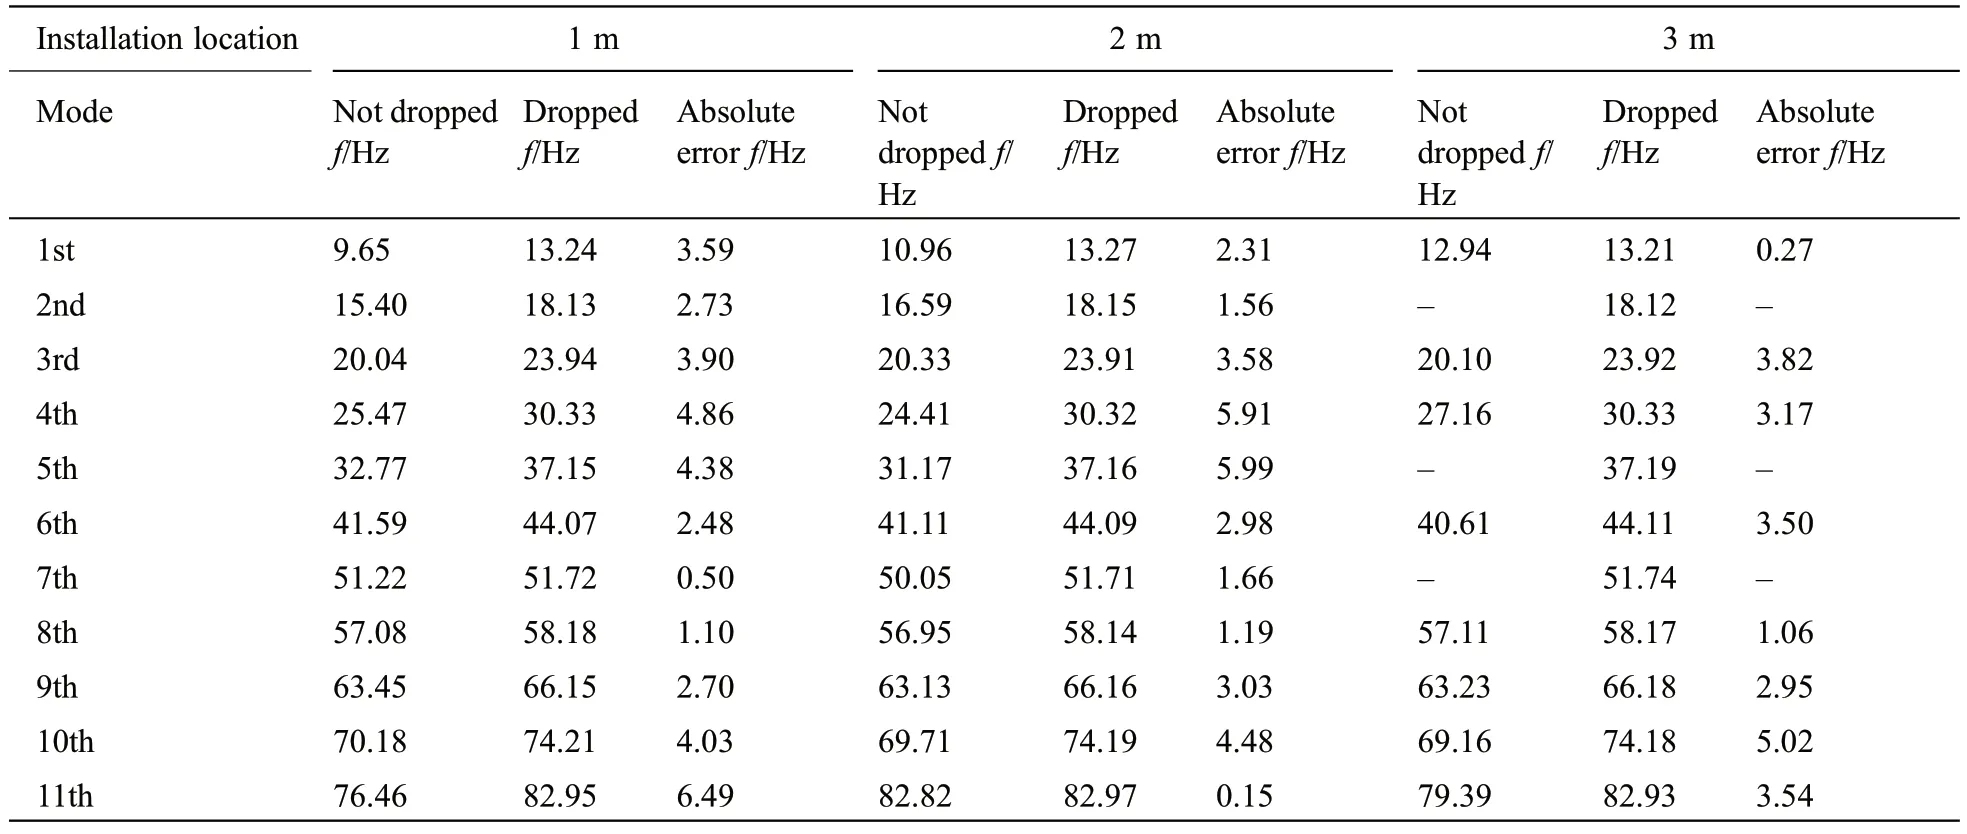
Table 1: The natural frequency of anti-vibration hammer head drop-off
4.2 Effect of Anti-Vibration Hammer Slip on Vibration of Conductor
In this paper,through vibration experiments to simulate the anti-vibration hammer slip faults,and obtain the conductor breeze vibration law.In the vibration experiment,the distance from the contact terminal 20 cm position as the starting point,20 cm as the increment,repeatedly change the installation position of the antivibration hammer.The vibration is excited by a shaker to obtain all natural frequencies of conductor in the range of 5–90 Hz.Each experiment lasted 5 min.The power spectral density curves were calculated for 20–200 cm,as shown in Fig.12.It showed the energy of the vibration.As the distance increases,the frequency corresponding to the first spectral peak increases.And above 60 Hz, each spectral peak is relatively concentrated.This indicates that the anti-vibration hammer is effective at lower frequencies.The power spectral density is a minimum of 80 cm.This position has the best vibration suppression effect, and the anti-vibration hammer’s position is located between the maximum half-wavelength and minimum halfwavelength.
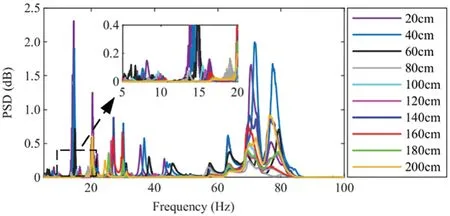
Figure 12: Power spectral density of 20–200 cm conductor vibration
In this paper, the modal parameter of the vibration signal is calculated by stochastic subspace identification, as shown in Fig.13.Table 2 shows the modal natural frequencies of conductor vibration under different positions of the anti-vibration hammer.With the location of the anti-vibration hammer gradually away from the contact terminal, the modal natural frequency changes are mainly reflected in the modal order and modal natural frequency.For the modal order, the order is reduced from 11 to 6.For the modal natural frequency, the 1st order modal natural frequency increases significantly, from 8.18 to 16.62 Hz, and then disappears.The absolute change is 8.44 Hz.At higher orders, such as in the 8th to 11th order modal natural frequencies vary less.The anti-vibration hammer is usually installed at a distance of 0.5–2 m from the contact terminal, the location is the antinode of the vibration.As the distance gets farther, less damping is caused by the anti-vibration hammer, which eventually leads to a higher natural frequency of the conductor.Therefore, the change of position is obtained by monitoring the low-order natural frequency.
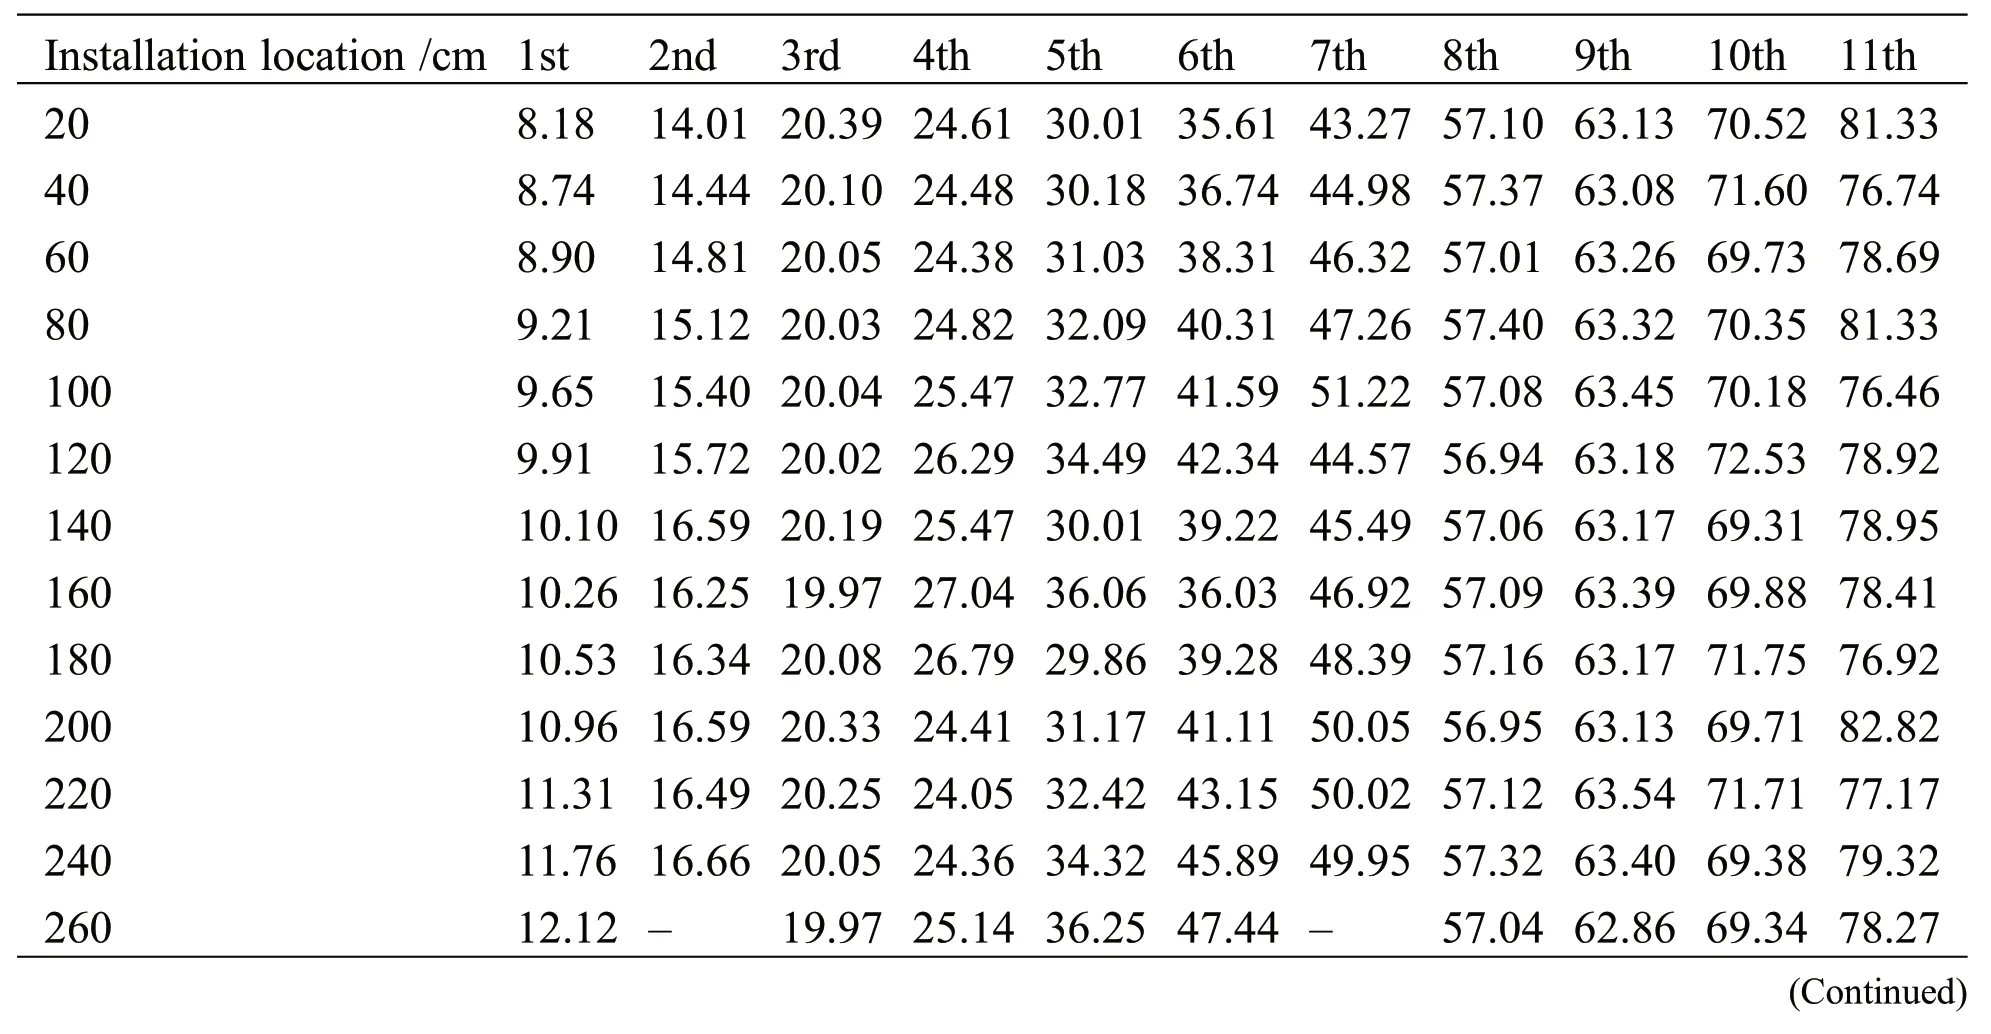
Table 2: Natural frequencies of transmission line conductor with anti-vibration hammer in different positions
5 Monitoring Technology Implementation
In this paper,in order to achieve online monitoring of anti-vibration hammer damage,such as hammer head drop and position slippage,a transmission line conductor vibration characteristic based anti-vibration hammer damage monitoring system is designed.The system architecture is shown in Fig.14,which mainly includes four parts: acceleration sensor, micro-meteorological monitoring device, edge node device, and monitoring center.The accelerometer is installed on the conductor, and the conductor length is long.Therefore, wired transmission is not easy to achieve.The system can use wireless transmission.But since wireless transmission consumes more energy, the system needs to be designed for low power consumption, combining mutual induction and battery power supply.The system collects conductor vibration acceleration and surrounding environment parameters through an acceleration sensor and a micro-meteorological sensor, respectively.After collection, the information is sent to the edge node via LoRa.The edge node performs modal calculation on the data, extracts the modal natural frequency, and analyzes it.The results are then sent via 4G to the monitoring center, which provides data query and early warning to the operation and maintenance personnel through the visualization platform.
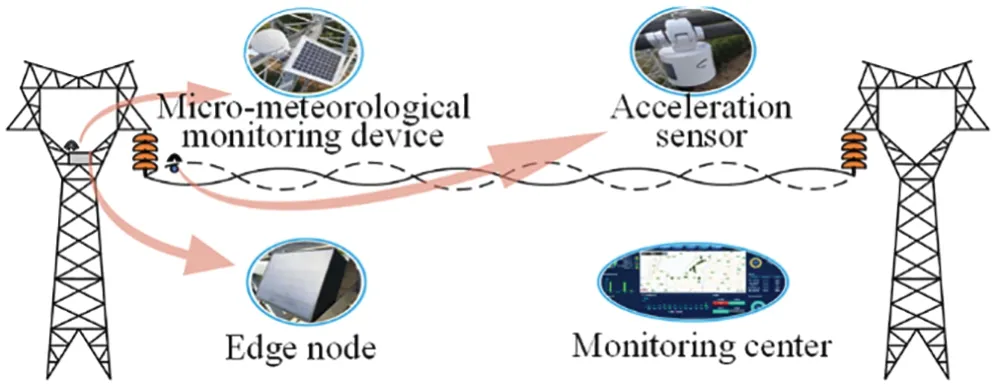
Figure 14: Anti-vibration hammer damage monitoring system based on conductor vibration characteristics
On the one hand,the low-order modal natural frequency increases when the anti-vibration hammer slips off to other locations of the fault due to the loosening of the connection.On the other hand,the modal natural frequency increases when anti-vibration hammers head drop off.Because each transmission line conduct installation span, operating conditions, pretension, and installation process is different, the natural frequency of the mode is also different.Therefore, as shown in Fig.15, in order to avoid interference, the system compares and analyzes the line’s historical data, other two-phase data, and data from the factory installation, and finds anti-vibration hammer damage.The maximum rate of change δMaxselected.In addition, determine whether the maximum modal natural frequency rate of change exceeds the set threshold value of 10%.If it does not exceed the threshold value, the anti-vibration hammer structure is considered to be in good condition.To prevent misjudgment caused by other environmental factors, the data after 5 min are intercepted and analyzed again.
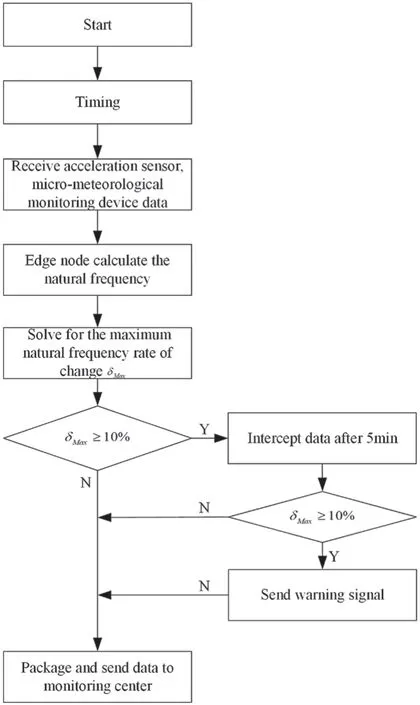
Figure 15: Monitoring system workflow diagram
6 Conclusion
In this paper, through the construction of the vibration experimental platform, to analysis the antivibration hammer head off and position changes and the law of the conductor breeze vibration characteristics.The modal method is applied to identify the modal natural frequency under various operating conditions.The following conclusions were drawn to establish the on-line monitoring technology for anti-vibration hammer damage:
The conductor increased its frequency as the vibration excitation signal frequency increased, and the vibration acceleration time domain signal appeared at many of the peak points.This indicates that the conductor has a multi-order harmonic frequency.On the one hand, the absolute change value increases after the hammer head dropped off, with a minimum of 0.15 Hz and a maximum of 6.49 Hz.On the other hand, with the change of position, the modal order increases after the hammer head dropped off,from 8 to 11 order.
The anti-vibration hammer,after a long period of vibration,is easy to loosen and slip to other positions.With the change of the anti-vibration hammer position,the vibration characteristics of the conductor change.When the anti-vibration hammer position is far away from the contact terminal, for the modal natural frequency, the 1st order modal natural frequency increases significantly, from 8.18 to 16.62 Hz, an absolute change of 8.44 Hz.In engineering applications, the fault of the anti-vibration hammer can be monitored according to the change in the natural frequency.Through online monitoring means, early warning signals are sent to the operation and maintenance personnel to take timely operation and maintenance measures to prevent further deterioration of the accident.
Faults in other accessories can introduce errors into the calculation.In the next step,we will research the effect of other accessories’faults on the vibration characteristics.
Funding Statement:This work was supported by the National Natural Science Foundation of China(No.52007138),the Natural Science Basis Research Plan in Shaanxi Province of China(No.2022JQ-568),and the Key Research and Development Program of Shaanxi Province(No.2023-YBGY-069).
Conflicts of Interest:The authors declare that they have no conflicts of interest to report regarding the present study.
 Structural Durability&Health Monitoiing2023年4期
- Structural Durability&Health Monitoiing的其它文章
- Weak Fault Detection of Rotor Winding Inter-Turn Short Circuit in Excitation System Based on Residual Interval Observer
- Speed Measurement Feasibility by Eddy Current Effect in the High-Speed MFL Testing
- Wireless Self-Powered Vibration Sensor System for Intelligent Spindle Monitoring
- Development of Features for Early Detection of Defects and Assessment of Bridge Decks