
Remote sensing images change detection based on PCA information entropy feature fusion
2024-01-08 09:11HUOJiuyuanLIUMeng
HUO Jiuyuan,LIU Meng
(1.School of Electronic and Information Engineering,Lanzhou Jiaotong University,Lanzhou 730070,China;2.Lanzhou Ruizhiyuan Information Technology Co.,Ltd.,Lanzhou 730070,China;3.National Cryosphere Desert Data Center,Lanzhou 730070,China)
Abstract:In order to make full use of texture information and neighborhood information provided by remote sensing images to improve the accuracy of change detection,a change detection method of remote sensing images is proposed based on principal component analysis (PCA) information entropy fusion of texture and neighborhood features from the perspective of feature fusion.Firstly,texture features of remote sensing images are extracted by gray-level co-occurrence matrix (GLCM),and neighborhood features are extracted by logarithmic ratio of neighborhood.Then,the texture features and neighborhood features are fused by PCA method to obtain principal feature information.Secondly,the information entropy of each principal feature is calculated,and the entropy weight method is used to assign weight to each principal feature to obtain the fusion difference image.Finally,fuzzy c-means (FCM) clustering algorithm is used to divide the fusion difference image into two categories to obtain the change detection results.Experimental results show that the proposed method can make full use of texture features and neighborhood features,reduce the influence brought by speckle noises,and significantly improve the accuracy of change detection of remote sensing image.
Key words:principal component analysis information entropy; remote sensing images; gray-level co-occurrence matrix (GLCM); texture feature; neighborhood feature
0 Introduction
Change detection of remote sensing (RS) images is a technique that collects relevant spatial data in the same geographic area and different periods,and uses image processing technology to analyze the changes of the region and carry on long-term dynamic monitoring of the changes[1].It is one of the essential research directions of RS data analysis.Currently,the change detection technology has become the key technology to update geo-spatial database and is widely used in many fields[2].For examples,in the civil field,the change detection is mainly used in land coverage[3-4],building change detection,and urban planning.In the field of ecosystem monitoring,it can be used for change detection monitoring of forest coverage,dryland[5],and lake disaster[6].In the field of natural disaster detection and assessment,it is mainly used in earthquake damage assessment[7],landslide detection[8],and tsunami damage assessment[9].In the military field,RS images change detection is widely used in dynamic sensing of battlefield information,military target reconnaissance,and nuclear test field detection[10].
In recent years,many change detection methods have been proposed for RS images,which can be divided into supervised change detection and unsupervised change detection according to whether prior knowledge is used[11-12].Supervised change detection obtains more characteristic information by labeling the original samples[13].At present,deep learning methods are widely used in the field of computer vision.Based on deep learning model,change features can be learned from multi-temporal RS images through an end-to-end network structure,and then these features are used to segment the original RS images to obtain changes’ results[14].Huang et al.proposed a multi-temporal hyperspectral RS images change detection method based on tension and deep learning[15].Wang et al.[16]combined methods of deep learning and super-pixel segmentation,and proposed a high-resolution RS images change detection method based on multi-slice scale feature fusion convolutional network model.Wang et al.[17]integrated the residual structure and feature pyramid network to establish a feature pyramid network (FPN) Res-Unet deep learning model,and improved the accuracy of building change detection.However,the training of deep learning-based neural networks is based on supervised training with back propagation algorithms[18].Thus,the supervised change detection methods need to obtain a priori knowledge from a large amount of labeled data and compare the images after classification to improve the accuracy of change detection,but manually labeling data is time-consuming and expensive[19].
Therefore,unsupervised change detection,which does not require additional a priori knowledge,has been more widely used.For example,Celik[20]used principal component analysis (PCA) to extract features from chunked difference images,which had a certain level of noise immunity.Gong et al.[21]used a fuzzy local information C-mean clustering algorithm to fuse and classify changing and non-changing regions in differential images.Li et al.[22]proposed a multi-temporal SAR images unsupervised change detection method based on Gabor features,and designed a cascade clustering algorithm.RS images are susceptible to noise in the process of imaging.How to effectively extract the features of the images and attenuate the effects caused by speckle noise are the key problems for the change detection.Jia et al.[23]proposed a method to reduce image noise by using local neighborhood information.Zhuang et al.[24]extracted the texture features of the image by gray-level co-occurrence matrix (GLCM) and constructed a multidimensional feature vector difference image.Li et al.[25]used the PCA method to separate out irrelevant and noisy elements in the image texture,and then performed correlation change detection.Zhang et al.[26]obtained the spectral and texture variations between images through neighbourhood information and texture information,so as to reduce the error caused by the contrast region inconsistency.
Texture information or neighbourhood information is applied to change detection to reduce the impact of speckle noise on the image,but it does not take full advantage of the large amount of information in RS images,which may result in loss of model accuracy.Therefore,an effective fusion mechanism is needed to fuse different feature information for change detection.
An unsupervised change detection algorithm of RS images with PCA information entropy fusion of texture features and neighborhood features is proposed.Firstly,GLCM is used to extract and calculate five texture features which are angular second moment (ASM),homogeneity (HOM),entropy (ENT),standard deviation (STD) and variance (VAR).Then,the neighborhood logarithmic ratio operator is introduced to construct three neighborhood feature difference images with neighborhood features.Finally,the PCA method is used to fuse multiple feature difference images to obtain the main features,the information entropy of each main feature is calculated,and weights are assigned to each main feature through the entropy weighting method to fuse texture features and neighborhood features,so as to improve the accuracy of RS imags change detection.
1 Information entropy feature fusion algorithm
As shown in Fig.1,an unsupervised change detection algorithm of RS images is constructed based on PCA information entropy fusion of texture features and neighborhood features.The specific steps of the algorithm are as follows.
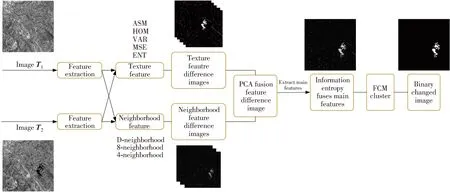
Fig.1 Framework of proposed RS change detection method
1) Extract the GLCM of the RS images in 4 directions and calculate 5 representative texture feature to form 5 groups of 4-dimensional feature vectors,which is used to construct texture feature difference images.
2) Use the neighborhood logarithmic ratio operator to extract the feature difference images of 4-neighborhood,8-neighborhood,and D-neighborhood,respectively.
3) Use the PCA method to fuse five texture feature difference images and three neighborhood feature difference images,and extract main features.
4) Calculate the contribution rate of each main feature and corresponding information entropy,then the main features are weighted by entropy weight method,so as to fuse texture features and neighborhood features.
5) Obtain change detection results by the fuzzy c-means (FCM) clustering.
1.1 GLCM texture features
In 1973,Haralick et al.proposed GLCM method,which was a texture extraction method based on statistical analysis[27].GLCM reflects the position distribution characteristics of pixels with the same or near brightness.
Assume thatf(x,y) is a two-dimensional digital image with a size ofM·Nand a gray level ofNg.Then GLCM with a certain spatial relationship is defined as
P(i,j)=#{[(x,y),(x+Δx,y+Δy)∈M·
N|f(x,y)=i,f(x+Δx,y+Δy)=j]},
(1)
where #{·} represents the number of established elements in the set; (x,y) are the pixel coordinates in the image,andx=0,1,…,M-1,y=0,1,…,N-1;i,jrepresent the gray level,i,j=0,1,…,Ng-1; Δx,Δyrepresent the offset between two pixels;Pis a matrix of sizeNg·Ng.If the distance between (x,y) and (x+Δx,y+Δy) isd,the angle between them and the horizontal axis of the coordinate isθ,then the GLCM of different distances and angles isP(i,j,d,θ).
The normalization method is
(2)
There are 14 texture statistics defined by Haralick,and not all of them are suitable for RS images processing[27].Bo et al.[28]used Brodatz texture library simulation experiments to obtain the three best discriminative and uncorrelated texture statistics:contrast,entropy,and correlation.Shi et al.[29]and Sun et al.[30]adopted five texture statistics (ASM,ENT,HOM,contrast,and correlation) to extract texture features from images of disaster areas and evaluate the damage degree of buildings in disaster areas.Li et al.[25]selected three texture parameters which were mean,VAR,and HOM to analyse the extent of damage to buildings after an earthquake.
Based on the above-mentioned reasons,the five texture statistical parameters are selected to extract texture features combining with the different resolutions of RS images in the experiment.
1) ASM.It is also known as energy which is the calculation of the squares sum of the values of each element in GLCM.It reflects the uniformity and consistency of the image grayscale distribution.Uniformity and consistency refers to the image of a certain pixel on the probability of repeated.The higher repetition rate,the more uniform and consistent gray scale of the images.When the texture of the image is more uniform,the ASM value is larger.The ASM is defined as
(3)
2) HOM.It is analysis of the homogeneity of the image.As the non-zero elements within the GLCM get closer to the diagonal,the higher the HOM value,the more homogeneous the image.The HOM is defined as
(4)
3) VAR.It reflects the rapidity of texture change and texture periodicity of the image.The larger the VAR value,the stronger the periodicity.The VAR is defined as
(5)
whereTMEAis the mean value,which is used to measure the brightness and darkness of the overall grey scale features of the image.The MEA is defined as
(6)
4) STD.It is used to measure the deviation between the pixel value and the mean value of an image.The larger the STD value,the larger the deviation of the grey scale in an image.The STD is defined as
(7)
5) ENT.It is a measure of the information amount in an image,indicating the complexity of the texture in the image.Texture information is a measure of randomness,and the ENT value is larger when the texture in the image is more complex.The ENT is defined as
(8)
1.2 Texture difference image
The similarity between the two types of samples can be measured by distance similarity.Texture feature vector for each image element is calculated in the two time RS images.The texture difference information of the two RS images is obtained by calculating the Euclidean distance between the two feature vectors.
Setd=1,θ={0°,45°,90°,135°},and obtain GLCM in four directions.Then,the five kinds of texture feature values are calculated,respectively,and they are arranged to obtain five four-dimensional feature vectors to describe the texture information of the central pixel position of the local image.The texture difference image construction method is
(9)
whereF1(x,y),F2(x,y) respectively represent the texture feature vector of the pixel at the corresponding position in the two images; ‖·‖2represents the Euclidean distance between the two vectors.
Since texture features are related to the size of texture calculation window,in order to analyze the influence of texture window size on change detection results,analysis experiments are conducted on 8 odd-numbered windows ranging from 3×3 (Unit is pixel×pixel,and all window sizes are in the unit) to 17×17.
1.3 Neighborhood logarithmic ratio difference image
Speckle noise is easy to be generated during RS images generation,which has an impact on change detection.Thus,how to construct a difference image is the key issue for change detection of images.The neighbourhood relationship between pixels can reduce the effect of speckle noise to a certain extent.Neighboring pixels can be grouped into the same area to improve the accuracy of change detection.Neighbourhood relationships between pixels generally include three types:4-neighbourhood,8-neighbourhood and D-neighbourhood[31],which is shown in Fig.2.
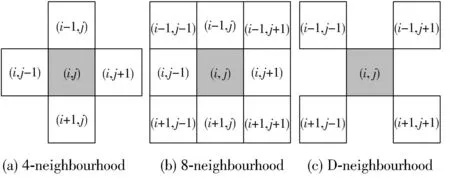
Fig.2 Neighborhood relations
The ratio method is to use the division operation to obtain the difference image between two images.The advantages of this method are that it is intuitive and faster in change detection,and it can eliminate the error generated by multiplicative noise compared to the other image difference method.Based on the ratio method,a neighborhood logarithmic ratio model is proposed to construct the difference image.The model incorporates neighbourhood information of pixels and uses logarithmic ratio operator instead of ratio operator to transform multiplicative noise in the image into additive noise,enhancing the contrast between changing and non-changing regions.The neighbourhood log ratio is defined as
(10)
whereX1andX2represents the front and back time image of the RS images,respectively; Ω represents the neighborhood;xiis the neighborhood center pixel andxi∈Ω;xjis the neighborhood pixel;αis a weighted parameter to control the neighborhood’s influence degree on the central pixel,which is determined according to manual experience.α= 0 means that no neighbourhood calculation being introduced.D2(X1|X2) denotes the calculated value of the logarithmic ratio of the neighbourhood of the imageX1with respect toX2.In order to add different neighbourhood features,4-neighborhood,8-neighborhood,and D-neighborhood are selected to construct three kinds of neighborhood feature difference images.The regularization mechanism is introduced to solve the asymmetry problem in the calculation of neighborhood logarithm ratio[32],which is defined as
(11)
1.4 PCA information entropy feature fusion algorithm
PCA is a commonly used method for dimension reduction of parameter-free data,which enables feature fusion of multivariate data by dimension reduction and retains the main information of the original data.The texture feature difference images and the neighbourhood feature difference images are fused by PCA method to extract the main features,which allows both texture features and neighborhood features to be added to image change detection.
In information theory,information entropy is used to measure the amount of information,and if an event is more likely to occur,the amount of information will be less[33].Therefore,an unsupervised RS images change detection algorithm is proposed with PCA information entropy fusion texture features and neighbourhood features,which adopts the strategy of combining PCA features fusion and information entropy to determine fusion weight.The main feature information is obtained by fusing texture information and neighbourhood information through PCA,and the information entropy corresponding to each main feature is extracted to determine the feature fusion weights.
The specific steps are summarized as follows.
1) Construct the covariance matrix.Assuming that there aremfeature difference images with a size ofM×N,each difference imageDi(i≤m) is converted into a one-dimensional column vector,and a data matrixXis defined as
X=[x1,x2,…,xm]T,
(12)
whereXis a data matrix withmrows andncolumns constructed from multiple feature difference images,andxmis ann-dimensional column vector.
The covariance matrixCofXis defined as
(13)
2) Construct the mapping matrix.The covariance matrixCis factored,then the eigenvalueλiof covariance matrixCand its corresponding eigenvectorξiare obtained.
According to the cumulative contribution rate,the firstkprincipal component eigenvectors is selected,and thesekeigenvectors are combined into mapping matrixP=[ξ1,ξ2,…,ξk].
3) Reconstruct the characteristic matrix.
Y=PTX.
(14)
4) Calculate the characteristic information entropyEiof each principal component.Suppose that the probability of each principal component providing information for the fusion image isqi,which can be calculated by
(15)
The calculation method of the information entropyEiof each principal component feature is
Ei=-qilog2qi.
(16)
5) Construct a fusion feature image.According to the entropy weight method,the feature fusion coefficientwiof the fused images is calculated through the information entropyEi,namely
di=1-Ei,
(17)
(18)
The fusion image is constructed by Eq.(19),and the fused one-dimensional column vectorYFis transformed into a feature fusion image.
YF=YTW,
(19)
whereW=[w1,w2,…,wk]represents the fusion coefficient vector.
1.5 FCM image segmentation
FCM is an unsupervised clustering algorithm,and its idea is to maximize the similarity between objects classified into the same class and has been widely used in the field of image segmentation.
Assuming that the dataset to be divided isx={x1,x2,…,xn},the elements in the dataset are divided into classc(2≤c≤n) and the cluster center isV={v1,v2,…,vc},then the objective function of the FCM algorithm is defined as
(20)
The implementation steps of FCM algorithm are as followed 1)-4).
2) Calculate the cluster centerV.
(21)
wherei=1,2,…,c;k=1,2,…,n.
3) Update the affiliation valueuik.
(22)
wherei=1,2,…,c;k=1,2,…,n.
After convergence of the iterations,each pixel is assigned a category according to the fuzzy subordination matrix.The category of pixel pointxkis the category of its maximum affiliation valueuik.The final clustering result is the change detection result,with the larger class of pixel intensity being the change region and the smaller class being the non-change region.
2 Experiment
The experiments are carried out on the Windows 10 system with CPU of Core(TM) I7-8550U@1.80GHz and memory of 8 G,using Matlab 2018b to achieve the proposed algorithm.In this paper,two sets of experiments are conducted to verify the effectiveness of the algorithm.The first one is for texture window experiments,and the second one is for comparison experiments.
2.1 Experimental evaluation indicators
Seven evaluation indicators are used to evaluate the accuracy of change detection and verify effectiveness of the proposed method.They are false negatives (FN),false positives (FP),overall error (OE),Kappa,percentage correct classification (PCC),false negative ratio (FNR),and false predicted ratio (FPR).The OE is the sum of FN and FP.
TheδPCCrepresents the ratio of the number of correctly measured target pixels to the total number of pixels in the experimental result,and it is calculated by
(23)
whereSFNis the number of pixels that have changed in the reference image but are classified as unchanged pixels by the algorithm;SFPis the number of pixels that have not changed in the reference image but are classified as changed pixels by the algorithm;STPis the number of pixels that have changed in the reference image and are also classfied as changed pixels by the algorithm;STNis the number of pixels that have not changed in the reference image and are also unchanged by the algorithm.
Kappa is a method of evaluating consistency in statistics,which is used to measure classification accuracy.The higher the value of Kappa,the better the result.The Kappa is defined as
(24)
whereδPREindicates the proportion of chance consistent or expected chance consistent number of image elements,andδPREis calculated by
δPRE=
(25)
In order to quantitatively analyze the accuracy of change detection,theδFNRandδFPRare used to measure the performance of change detection.TheδFNRandδFPRare defined as
(26)
(27)
2.2 Experimental datasets
The first experimental dataset is a SAR image dataset for the Ottawa region,obtained by the Radarsat-2 satellite in the Ottawa region of Canada.Fig.3(a) and 3(b) were taken in May 1997 and August 1997,respectively,with a size of 290×350.Fig.3(c) shows the change reference image.Due to the heavy rainfall in the rainy season,the water level of the river rises.Fig.3(b) shows an image of the river fading away to reveal a large area of land after the rainy season.
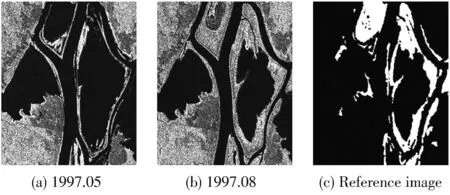
Fig.3 Ottawa dataset
The second experimental dataset is a SAR image dataset of the Bern region,obtained by the ERS-2 satellite in the Bern region of Switzerland.Fig.4(a) and 4(b) were taken in April 1999 after the flood and May 1999 after the flood faded,respectively.And the size of them are 301×301.Fig.4(c) shows the change reference image.

Fig.4 Bern dataset
The third experimental dataset is the SAR image dataset of Bangladesh region,which is obtained from the Envisat satellite in Bangladesh and parts of India.Fig.5(a) and 5(b) were taken in April 2007 before the flood and July 2007 after the flood,respectively,and the size of them are 300×300.Fig.5(c) shows the change reference image.Compared to the first set of experimental data,this set of data is to detect the flooding of the Bangladesh area after the flooding has occurred.
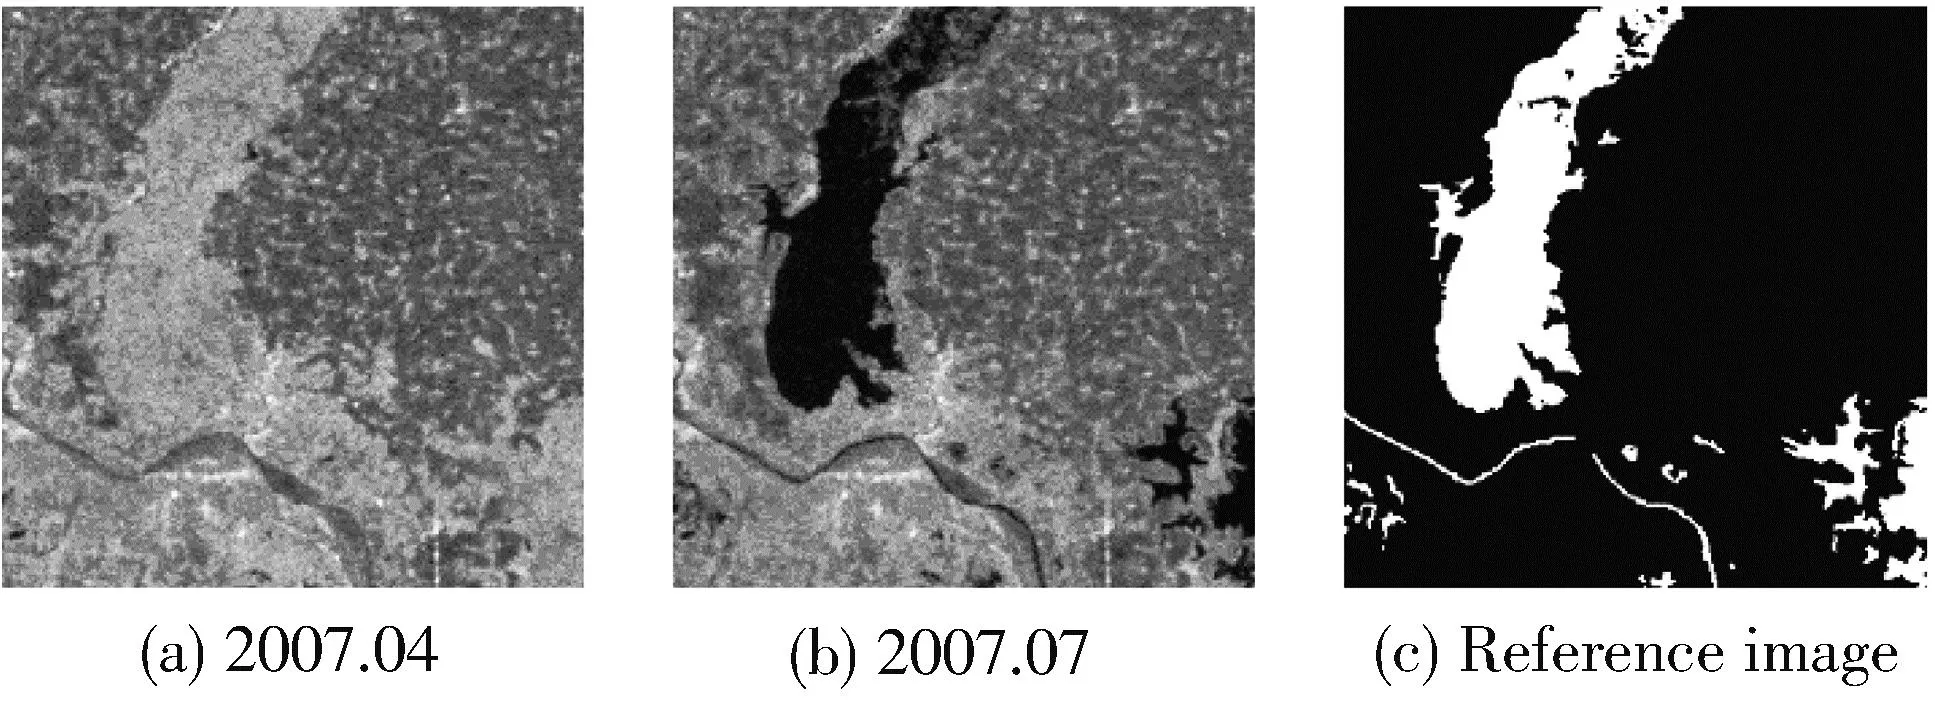
Fig.5 Bangladesh dataset
The fourth experimental dataset is a Google dataset from the literature[34],with images collected between 2006 and 2019,covering the suburbs of Guangzhou,China.It is a high-resolution dataset reflecting the urbanization process in Guangzhou.Fig.6(a) and 6(b) were taken on June 15 in 2015 and December 29 in 2017,respectively.And the size of them is 1 836×1 836.Fig.6(c) shows the change reference image.The set of experimental data is mainly the change detection of urban building structures.
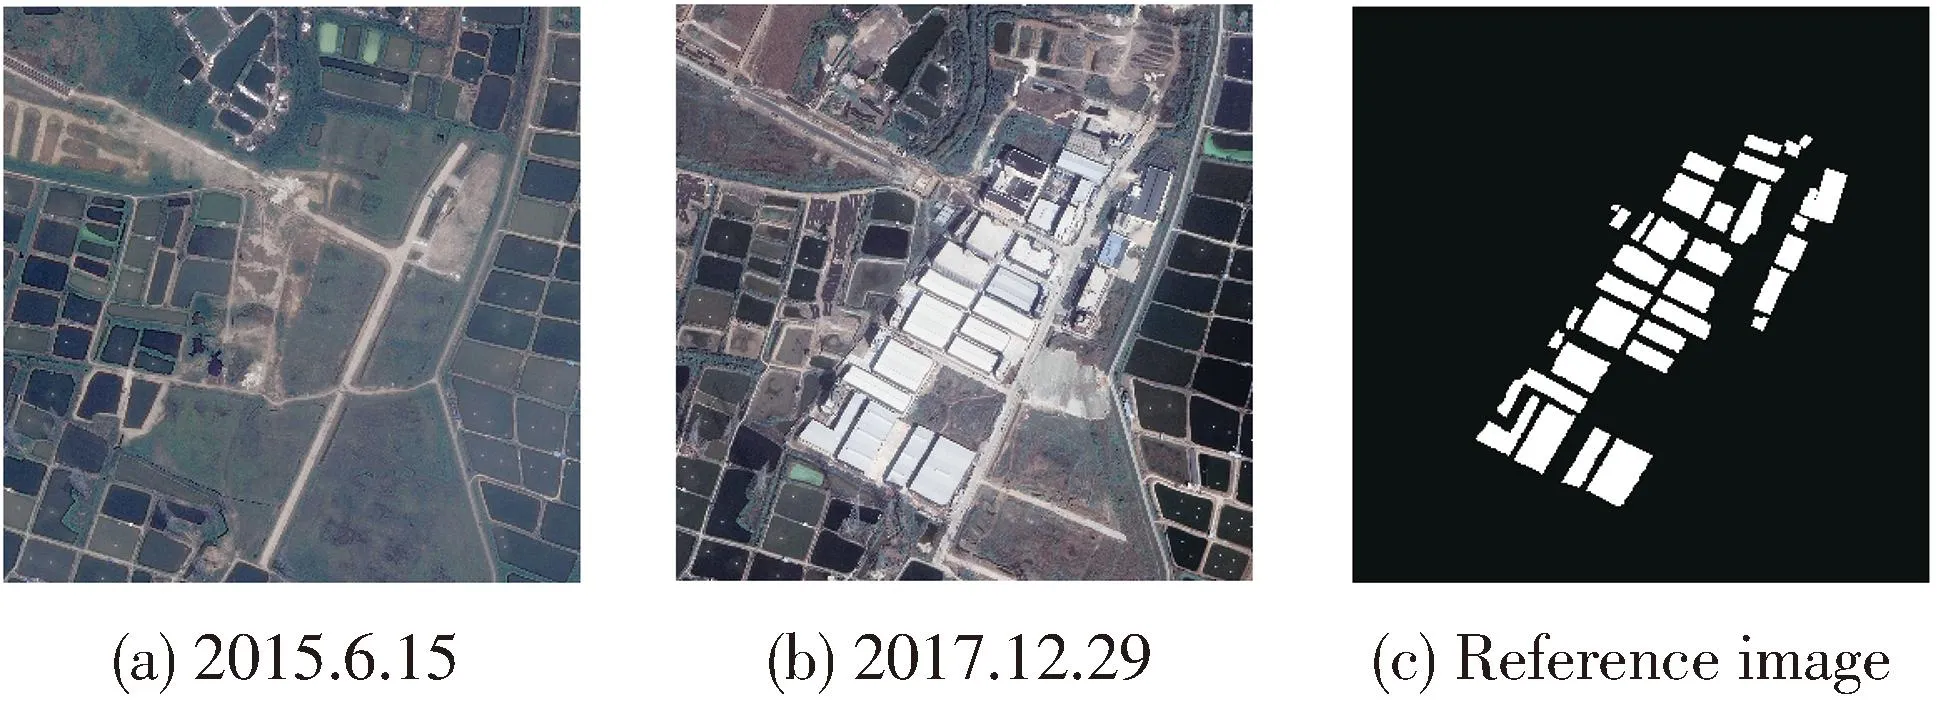
Fig.6 Google dataset
2.3 Texture feature selection
In practical calculations,not all texture statistics are suitable for change detection.In this paper,nine commonly used statistical attributes of texture features are selected for experimentation,namely mean (MEAN),VAR,STD,HOM,contrast (CON),dissimilarity (DIS),ENT,ASM,and correlation (COR).In order to select the most suitable texture statistic,Euclidean distance is introduced to classify the target.The magnitude of Euclidean distance reflects the distance between target points,and the larger distance indicates the greater degree of differentiation between targets.In this paper,the Euclidean distance is used to evaluate the ability of each texture feature to differentiate between the changing and non-changing regions of RS images in two temporal phases,and the Euclidean distance is defined as
(28)
The nine texture feature values of the two-temporal RS images are calculated separately,and the Euclidean distance of the two-temporal phase in each feature is calculated by the Eq.(28),which is used to screen the texture features with stronger change detection.Considering the universality of the selected feature quantities,experiments are carried out jointly by using SAR images and high-resolution RS images to analyse the Euclidean distance changes in each feature based on two-temporal phase RS images,and the results are shown in Fig.7.

Fig.7 Euclidean distance between two time-phase RS images in each feature
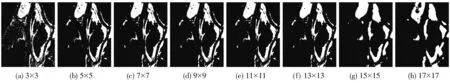
Fig.8 SAR image change detection results at different texture window sizes (Ottawa dataset)
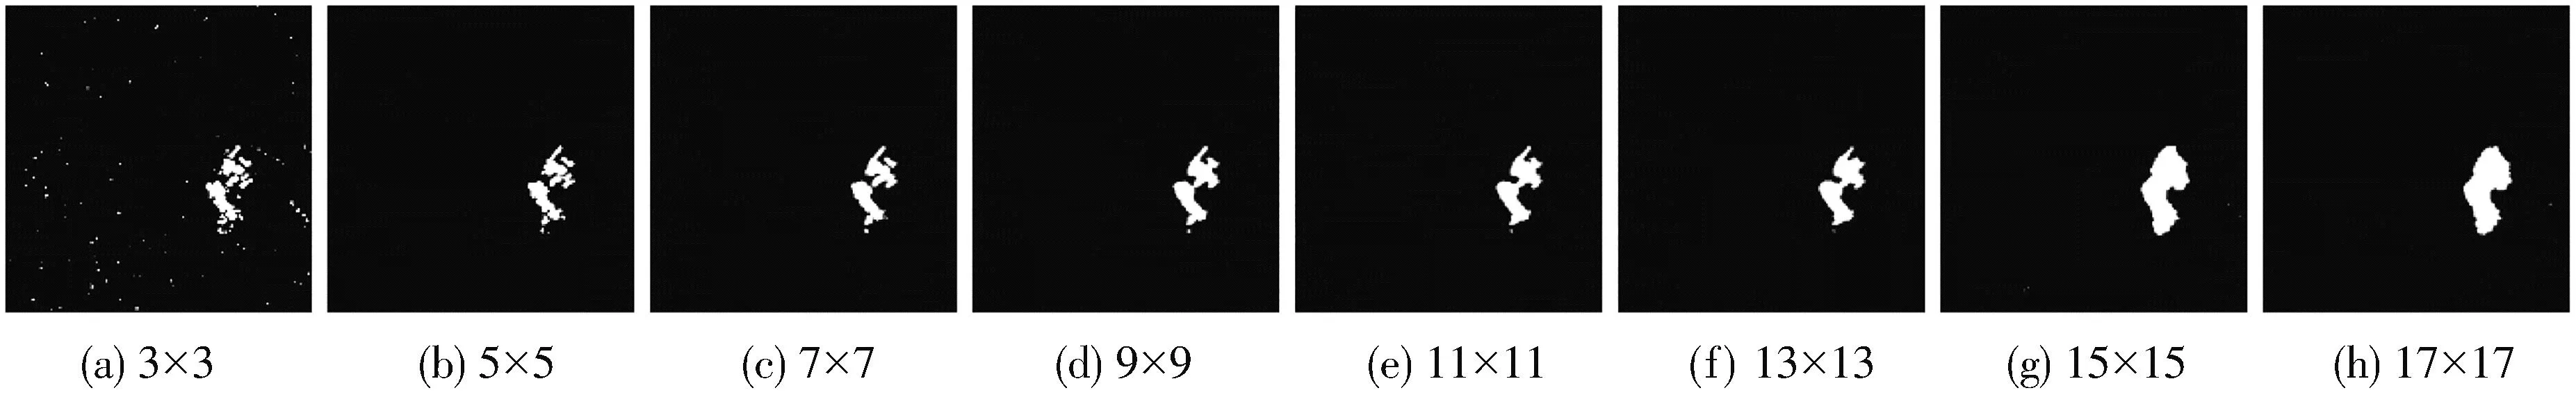
Fig.9 SAR image change detection results at different texture window sizes (Bern dataset)
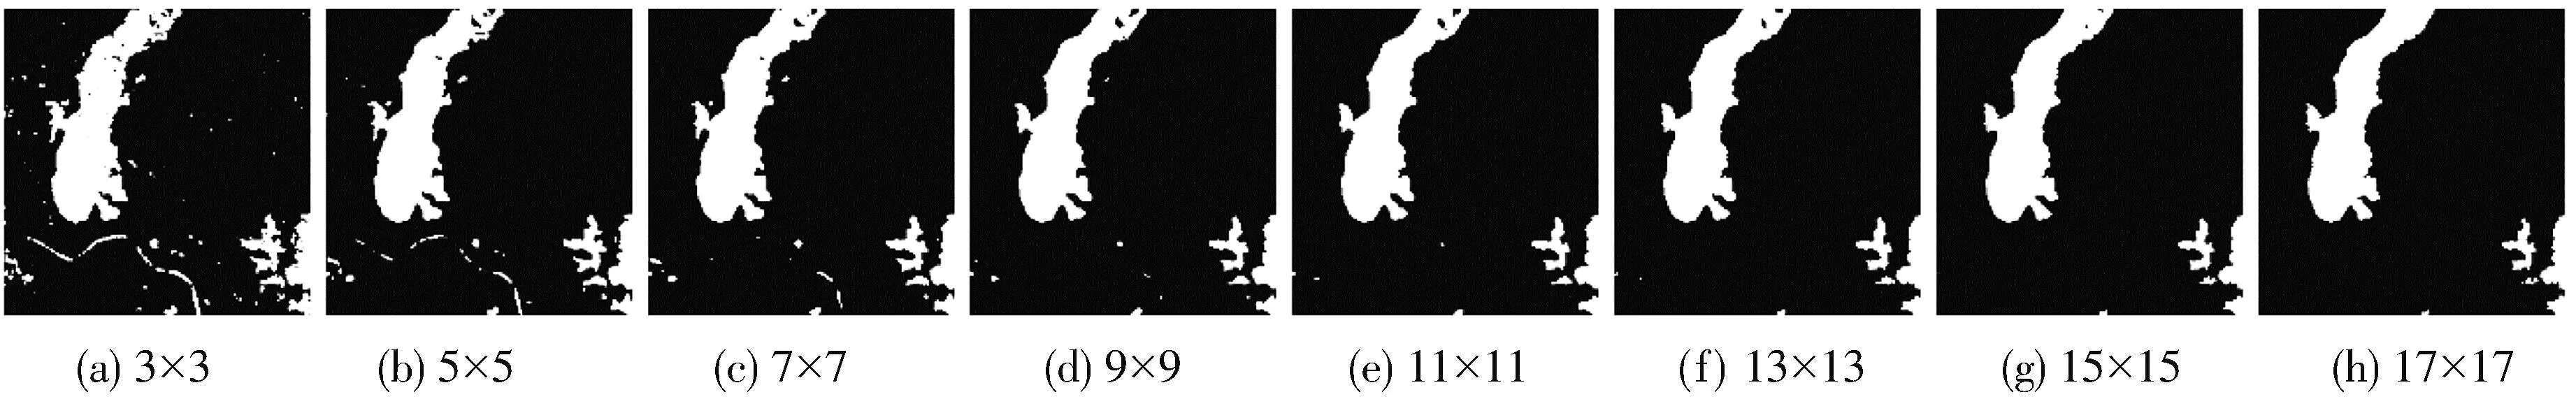
Fig.10 SAR image change detection results at different texture window sizes (Bangladesh dataset)
As can be seen from Fig.7,the discriminatory ability of the texture feature performs differently across the four experimental datasets.In particular,the HOM feature amount shows the most obvious difference between the different experimental datasets,but the feature still has good discriminatory ability for certain regional datasets,such as the Ottawa dataset and Google dataset.Therefore,the ASM,HOM,VAR,STD,and ENT are used as the texture feature quantity for change detection with reference to the mean distance fold between two time-phase RS images.
2.4 Texture window analysis
The size of the texture window will affect the accuracy of change detection.Two sets of experiments are designed to perform texture window analysis on SAR images and high-resolution RS images,respectively.
2.4.1 Effect of texture window size on SAR images change detection
Five texture feature difference images and three neighbourhood feature difference images are extracted for the three SAR image datasets of Ottawa,Bern,and Bangladesh,respectively,and the change detection results are obtained by PCA information entropy fusion.The change detection results at different texture window sizes are shown in Figs.8-10.The results are analyzed for accuracy by using Kappa,PCC,FNR,and FPR.In order to analyse the relationship between texture window size and the detection accuracy of the four variations,a regression analysis is performed by a second-order polynomial model using the texture window size and detection accuracy as the independent variables.Fig.11 shows the regression analysis of texture window with Kappa and PCC,and Fig.12 shows the regression analysis of texture window with FNR and FPR.

Fig.11 Regression analysis of Kappa coefficient and PCC with texture window size
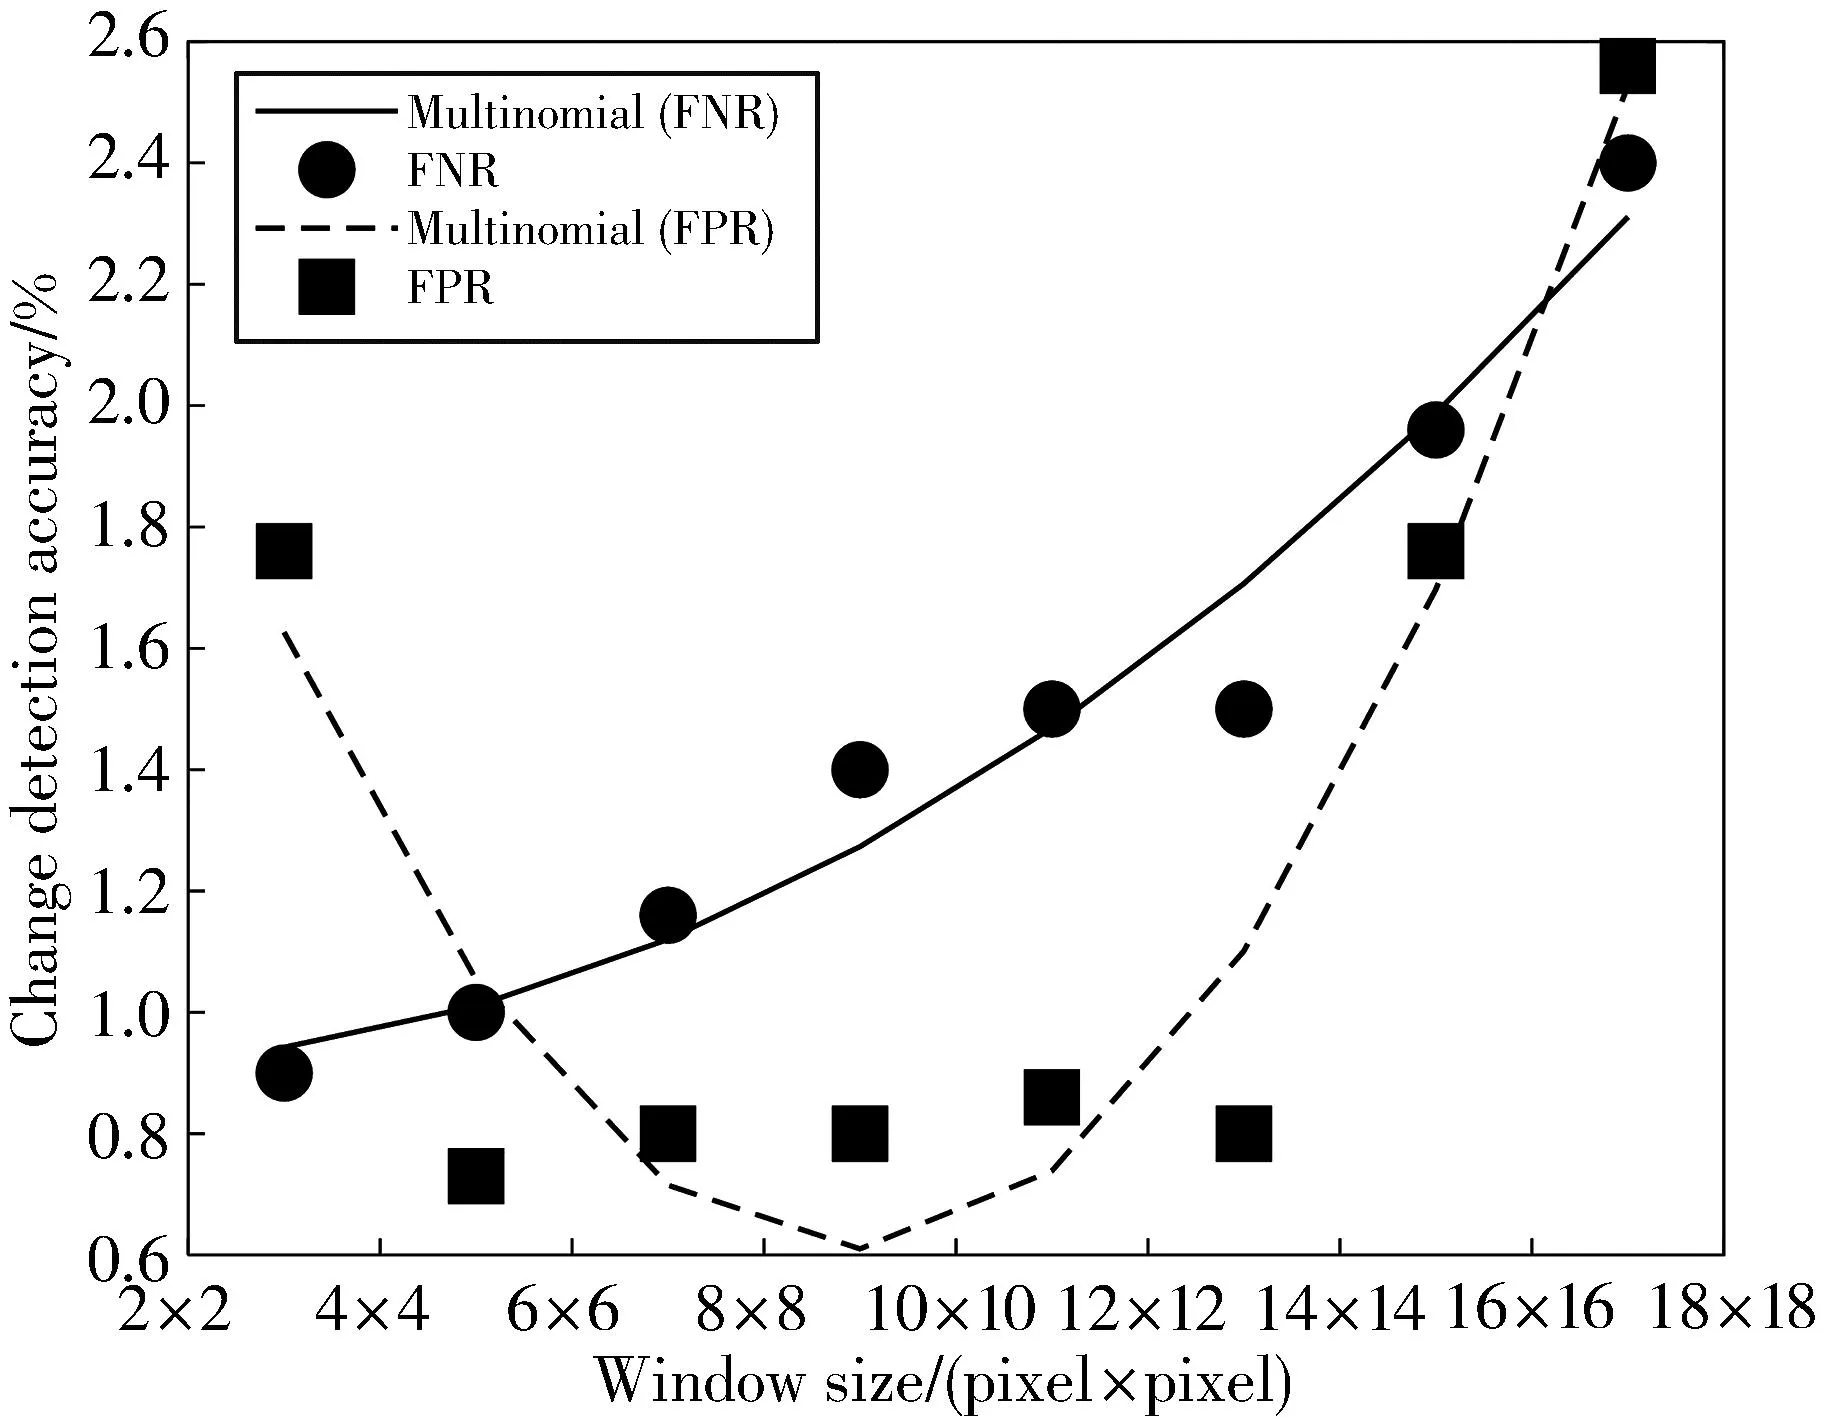
Fig.12 Regression analysis of FNR and FPR with window size
In Fig.9,the fitting correlation coefficients of Kappa,PCC,FNR,and FPR are 0.986 0,-0.918 7,-0.891 3,-0.891 4,-0.931 5,and 0.667 0,respectively.The corresponding fitting equations are defined respectively as
y1=-0.162 7x2+2.269 0x+79.292 4,
(29)
y2=-0.034 7x2+0.527 1x+96.170 9,
(30)
y3=0.005 6x2-0.015 6x+0.960 9,
(31)
y4=0.029 4x2-0.522 5x+2.936 2.
(32)
In the regression curve of Fig.12,the intersection of the FNR,and the FPR is located between window 5×5,15×15,and 17×17.The Kappa,PCC,FNR and FPR for window sizes 5×5,15×15,and 17×17 are derived according to the regression fitting formula as shown in Table 1,respectively.
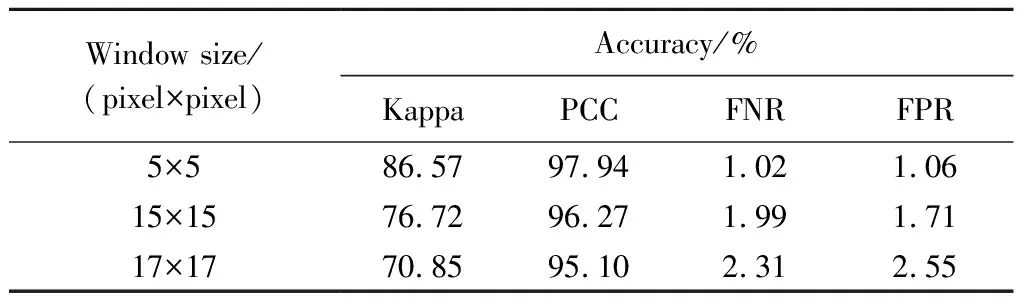
Table 1 Fitting accuracy of different window size
1) As the texture window increases,the Kappa and PCC increases first and then decreases,and the minimum value is obtained when the window is 17×17,and the maximum value of detection accuracy is obtained when the window is 5×5.
2) The FNR increases with the increase of the texture window,and the FPR gradually decreases before the window is 9×9,and the growth rate becomes larger after the window is larger than 9×9.
3) As can be seen from Table 1,when the texture window is 5×5,there is 0.97% reduction in FNR,0.65% reduction in FPR,9.85% increase in the Kappa,and 1.67% increase in PCC.Therefore,the optimal odd texture window for SAR images is 5×5 when the effects of Kappa coefficient,PCC,FNR,and FPR are taken into account.
2.4.2 Effect of texture window size on high-resolution RS image change detection
Five texture feature difference images and three neighbourhood feature difference images are extracted from the Google data high-resolution RS image dataset,respectively,and the change detection results are obtained by PCA information entropy fusion.The results under different texture window sizes are shown in Fig.13.
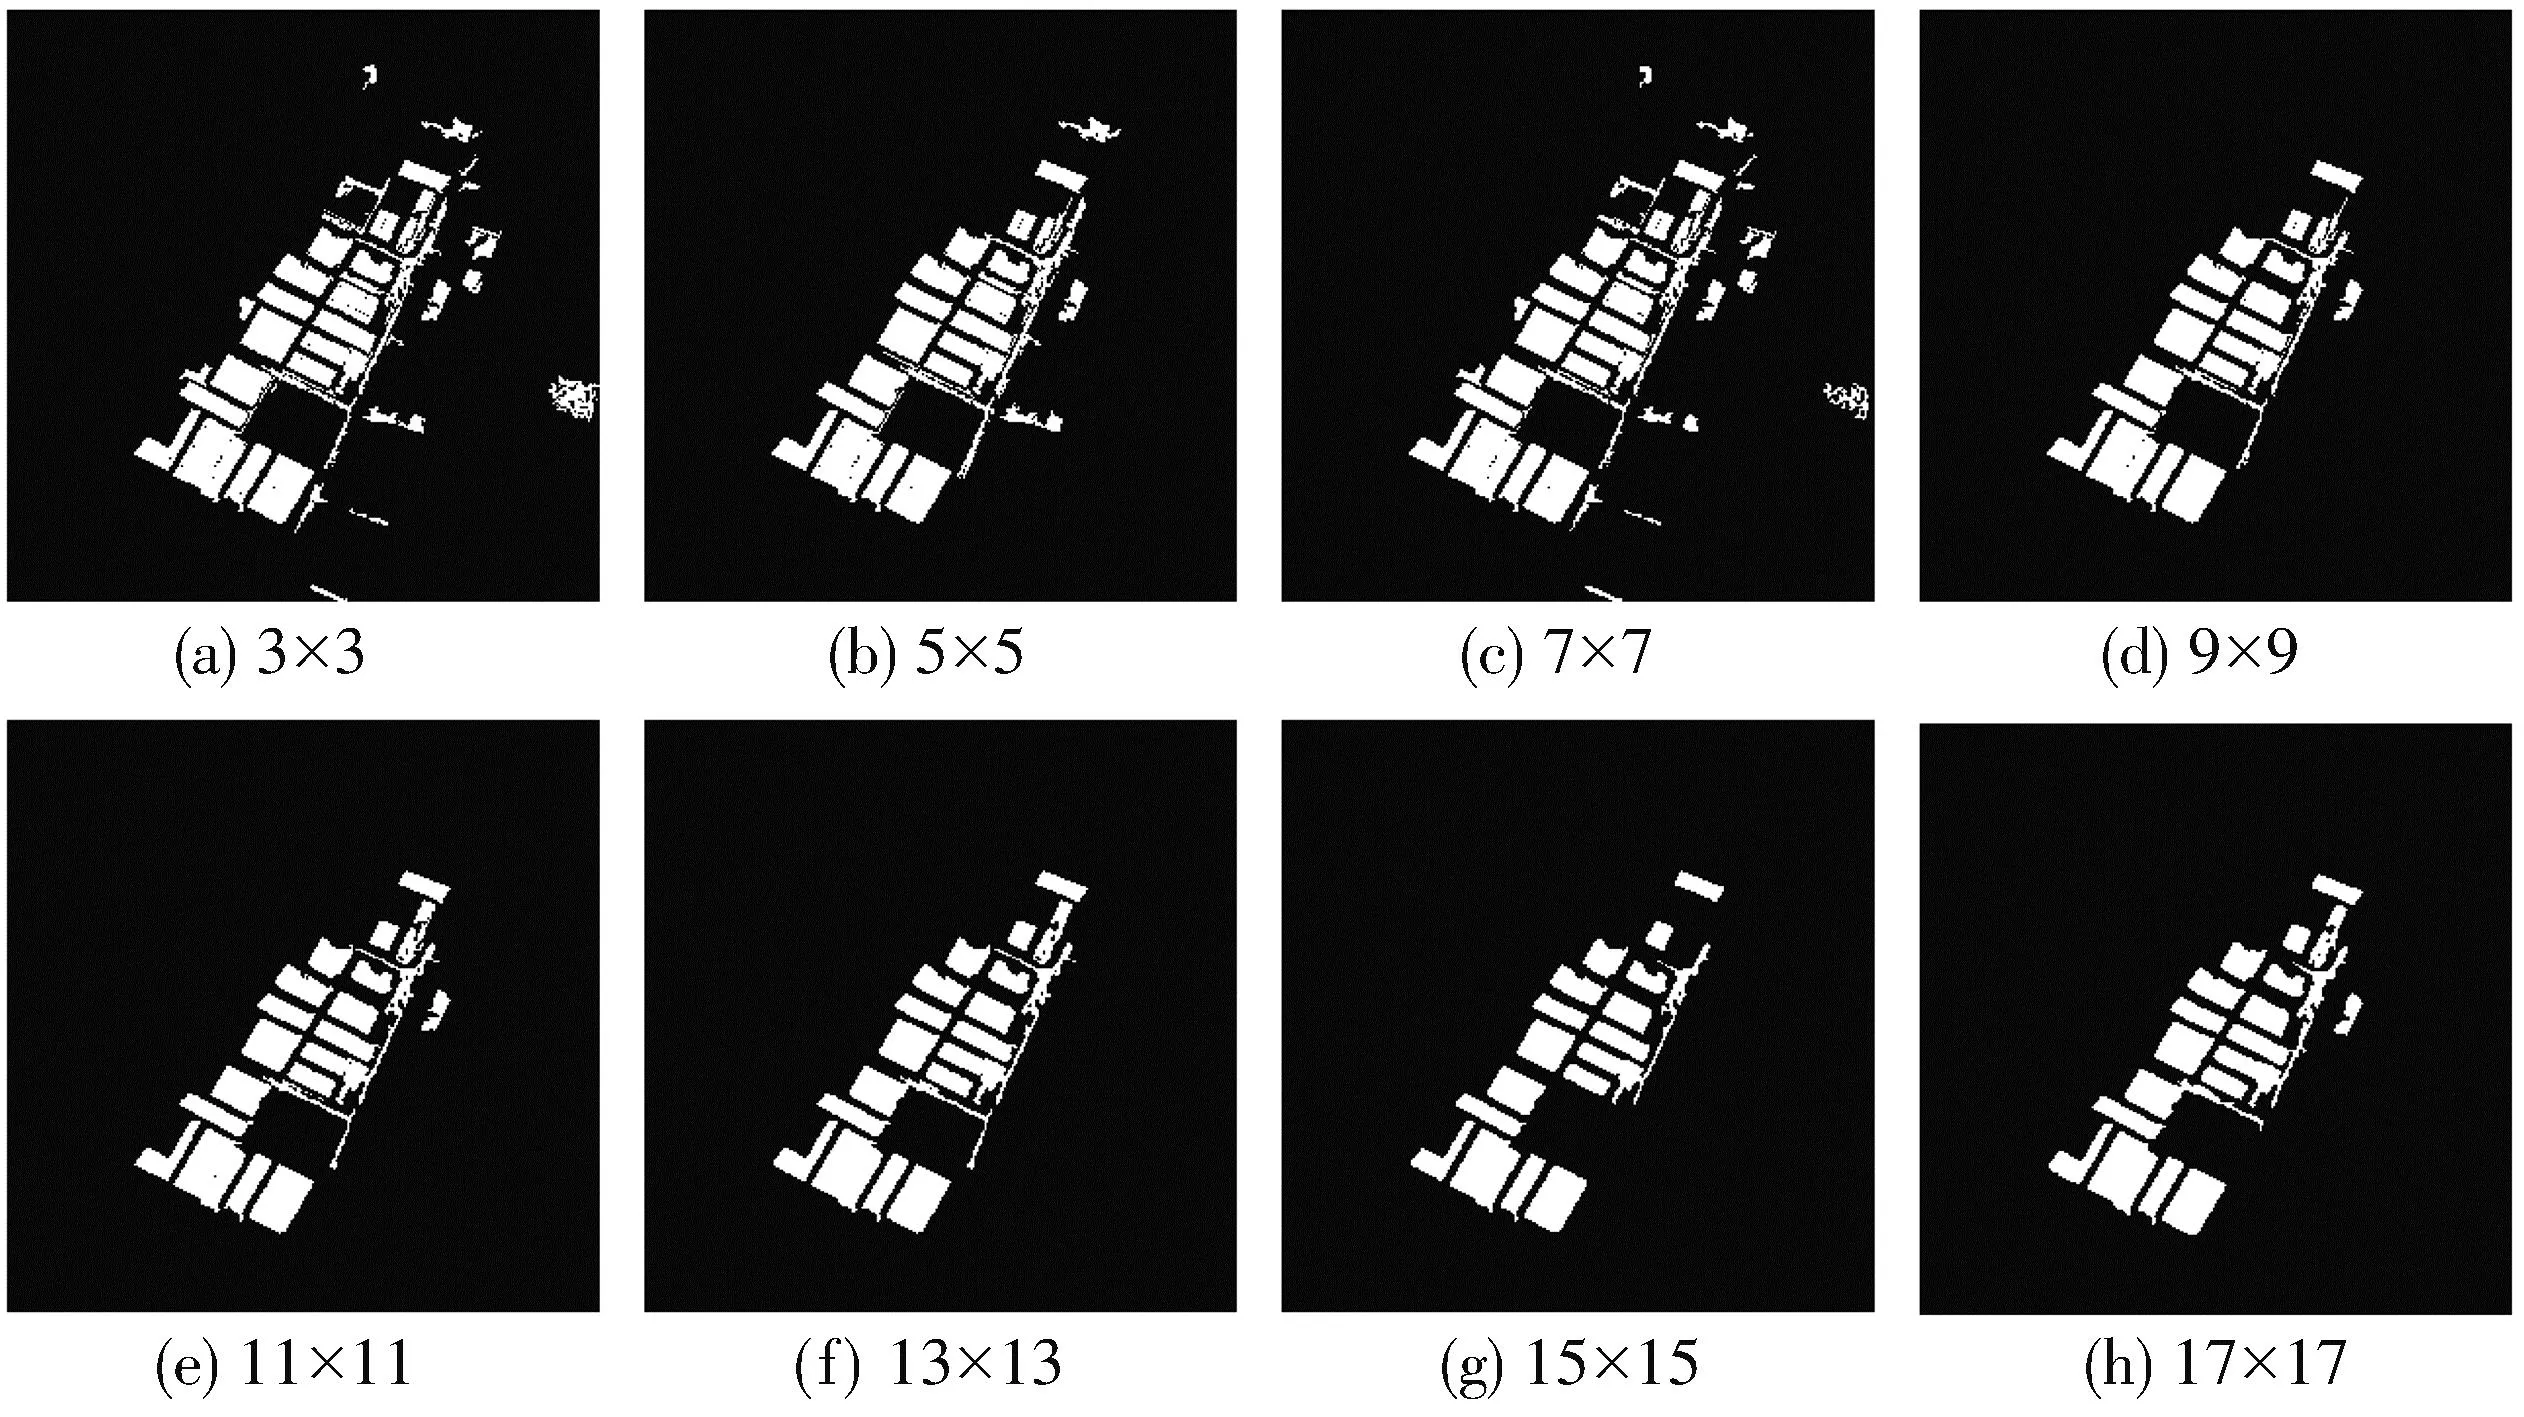
Fig.13 High-resolution RS image change detection results at different texture window sizes (Google dataset)
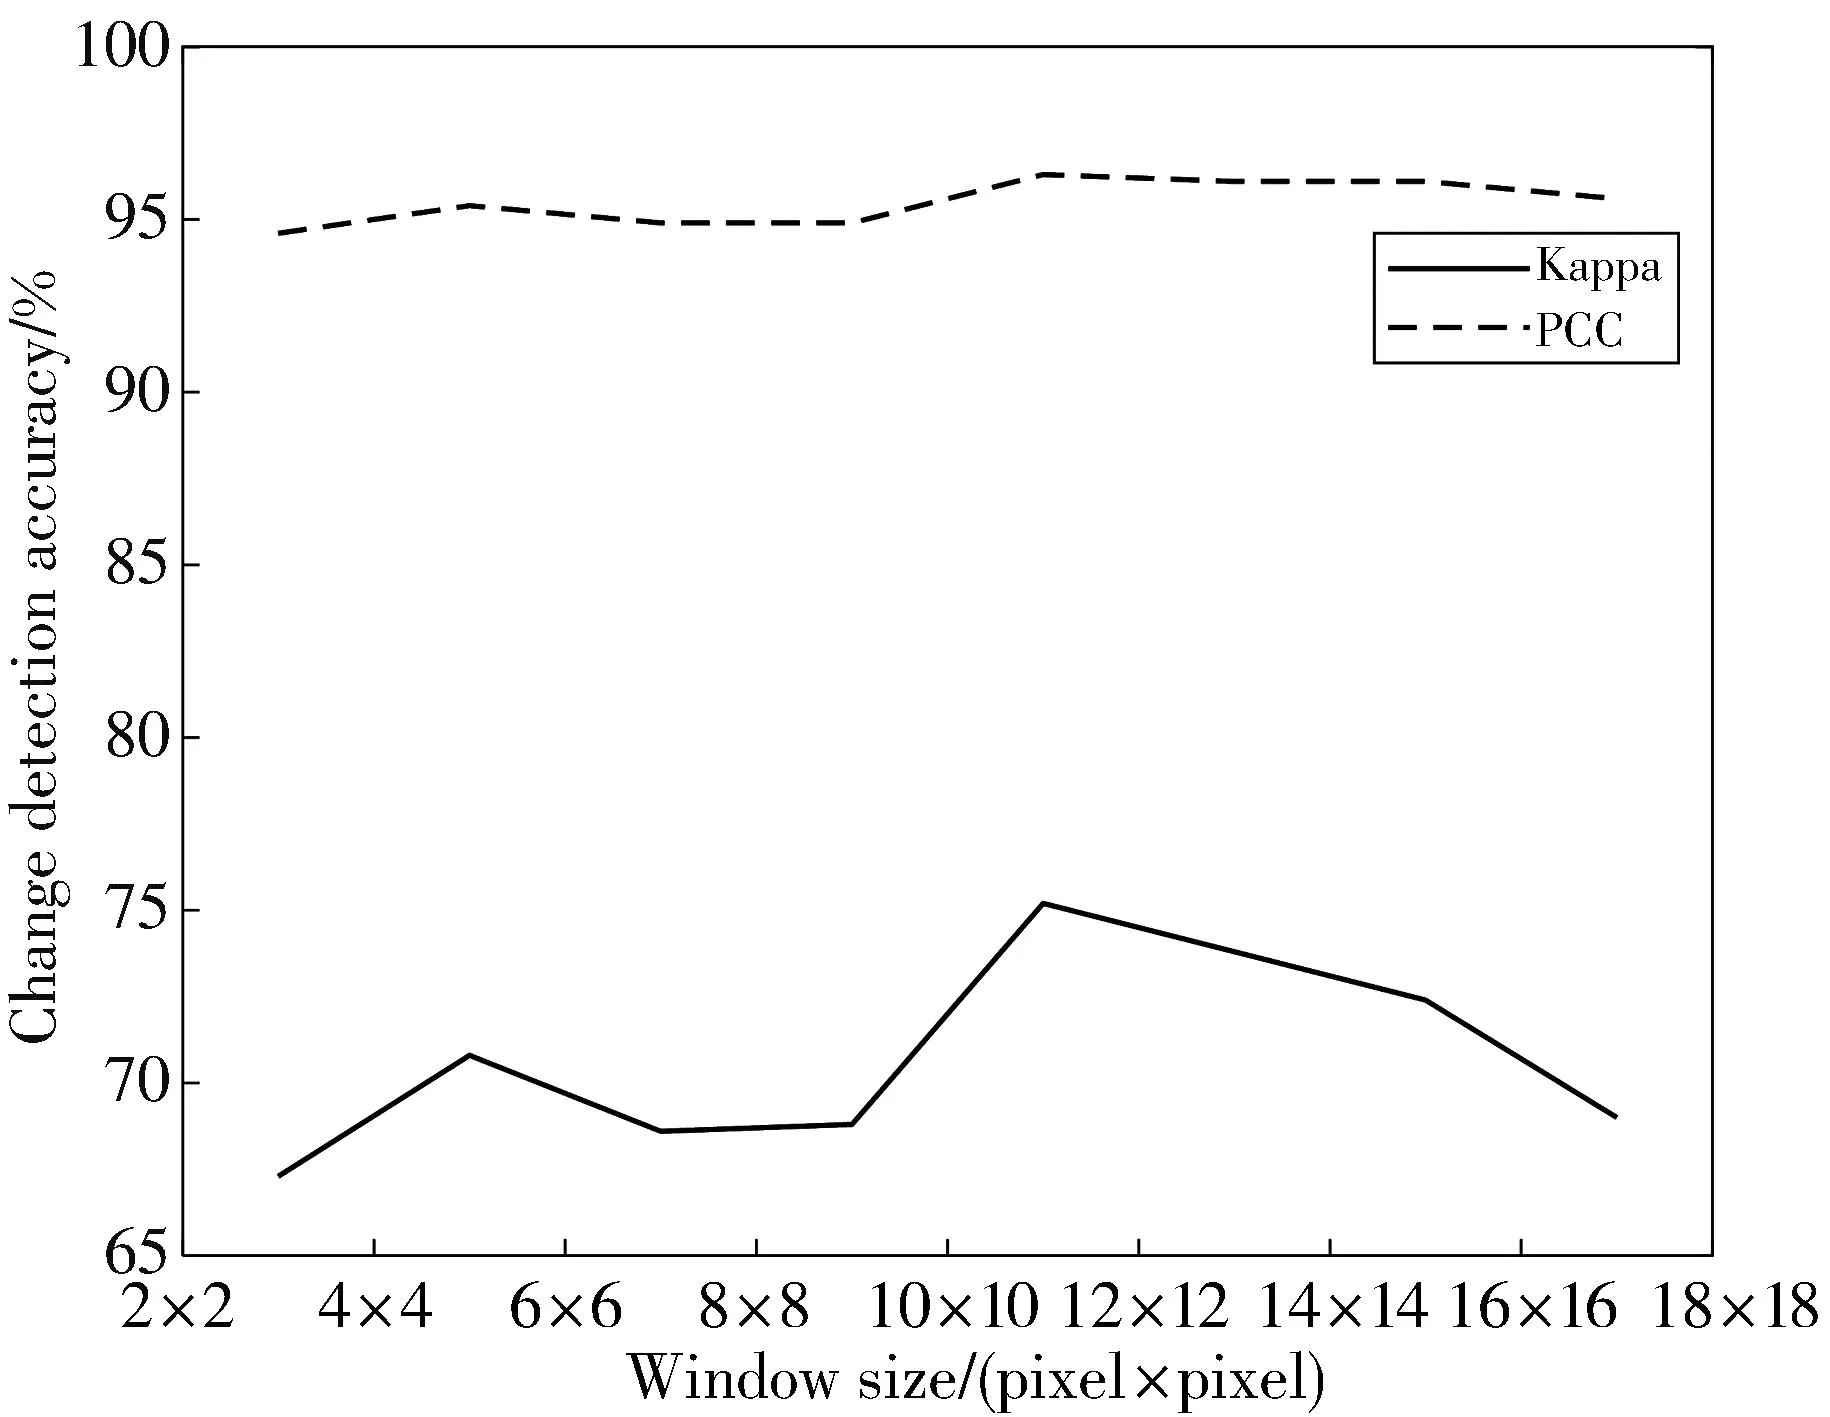
Fig.14 Regression analysis of Kappa and PCC with texture window size

Fig.15 Regression analysis of FNR and FPR with window size
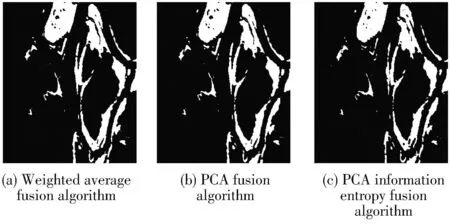
Fig.16 SAR image change detection results of different fusion methods (Ottawa dataset)
Figs.14-15 show the relationship between change detection accuracy and texture window size.The results show that when the texture window is increased from 3×3 to 11×11,the accuracy indexes generally tend to increase.When the texture window is 11×11,the accuracy indexes basically reach the optimum,but continue to increase the texture window will make each accuracy index decrease.The reason is that as the texture window gradually increases,the information of the image elements within the window is linked to each other and the computed differential image is able to accurately represent the feature information of the image.
However,as the texture window increases further,the “transition correlations” appear between image elements,the intensity of the region is weakened indirectly,the small change area is difficult to detect,some change area is misjudged as non-change area,and the change detection accuracy is reduced.Therefore,after comprehensive analysis of the evaluation index of change detection,the optimal odd texture window of high-resolution image is 11×11.
2.5 PCA information entropy fusion
Texture features and neighborhood features of four groups of RS images are extracted,respectively,and 8 features (ASM,HOM,VAR,STD,ENT,4-neighborhood,8-neighborhood,and D-neighborhood) are analyzed by PCA information entropy feature fusion.Firstly,the 8-dimensional feature matrix is constructed,and PCA fusion analysis is performed on the 8-dimensional feature matrix.Secondly,the eigenvalues,variance contribution rates and cumulative contribution rates of the four groups of RS image datasets are obtained by PCA fusion analysis,as shown in Table 2.
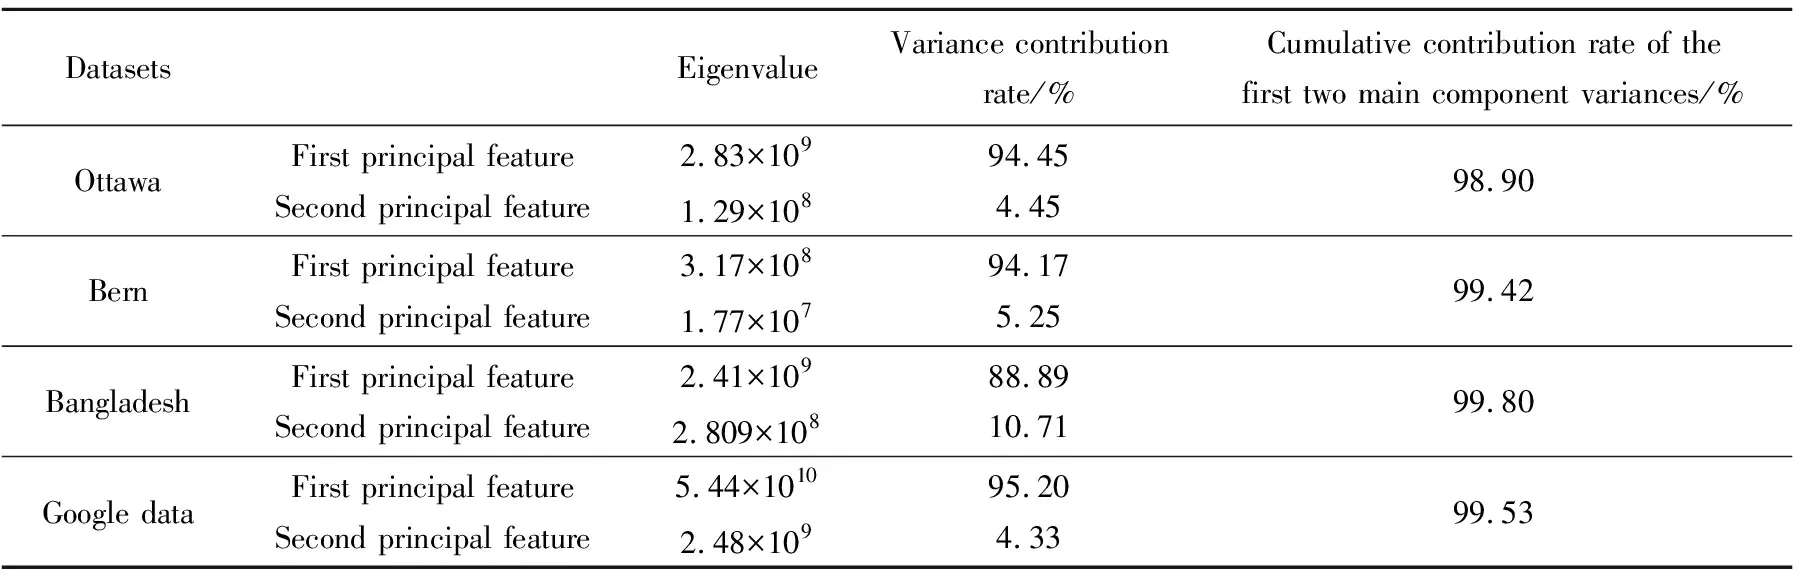
Table 2 PCA fusion characterization
The cumulative contribution rate of the first two main features of the four groups of RS datasets has reached 98%,which can reflect the overall feature information of the image.Therefore,the first two main features are selected to carry out image fusion by entropy weight method through information entropy strategy.
The eight features are fused by weighted average algorithm[35],PCA algorithm[36],and PCA information entropy algorithm to verify their fusion performance.Figs.16-19 shows the fusion results of the four groups of RS datasets.Compared with Fig.17(c),Fig.17(b) shows the image of Bern dataset using the PCA fusion method,and has larger noise.Fig.18 shows the change detection result of the Bangladesh dataset with more missed regions in Fig.18(a) and 18(b).Table 3 shows the detection and analysis of FCM clustering results after fusion of the three methods.Qualitatively,Kappa and PCC of Figs.16(c),17(c),18(c),and 19(c) are superior to the detection results of other methods,indicating that the PCA information entropy fusion method obtains the richest information from the feature images and has the best fusion effect.
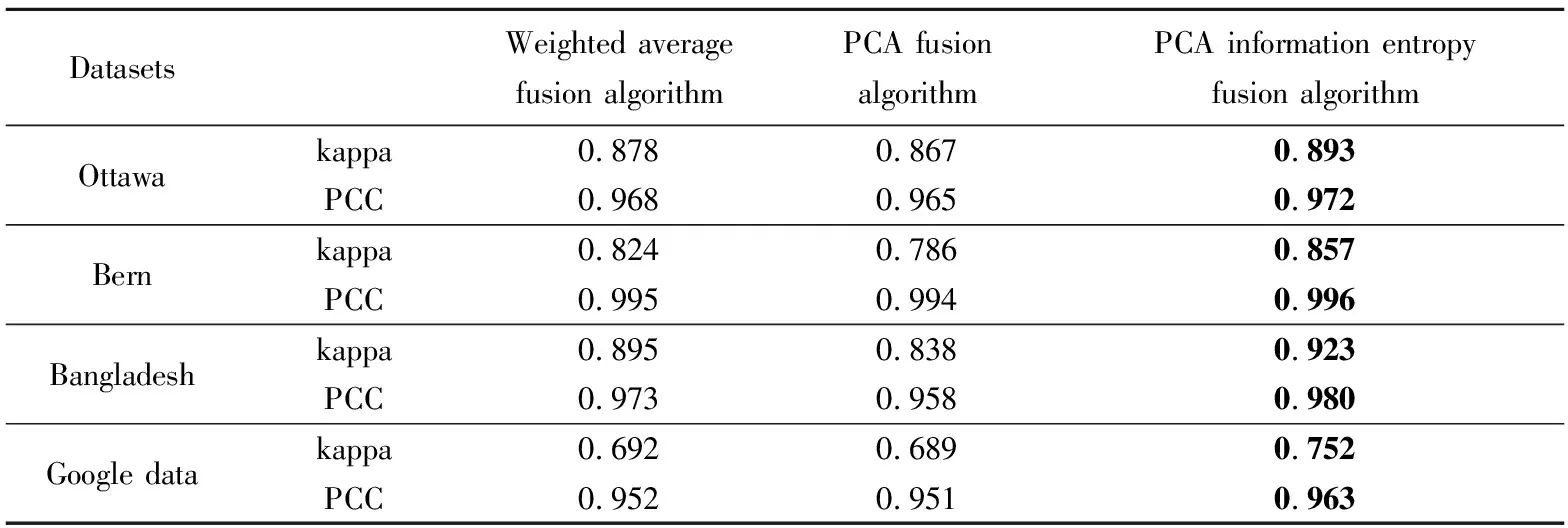
Table 3 Precision index of RS image change detection at different fusion methods
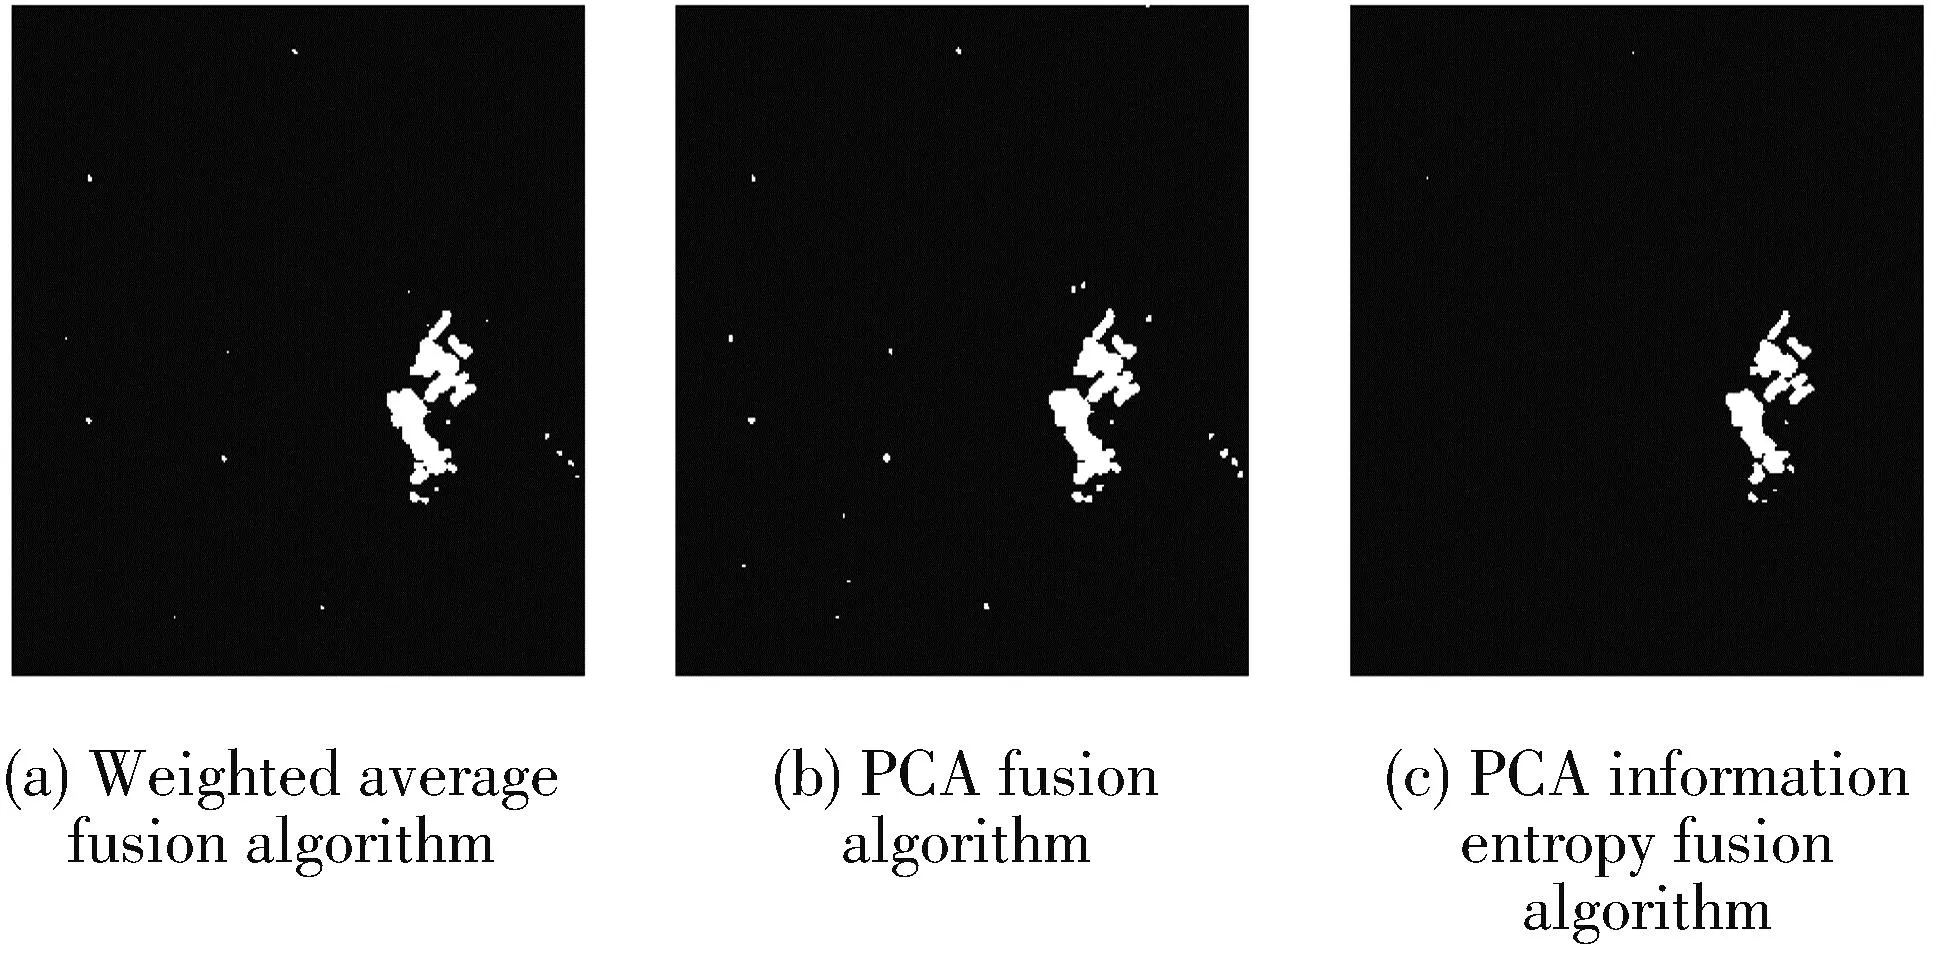
Fig.17 SAR image change detection results of different fusion methods (Bern dataset)
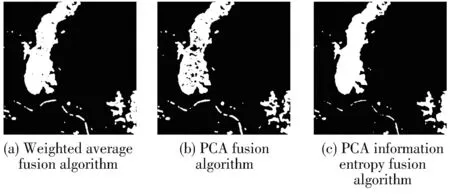
Fig.18 SAR image change detection results of different fusion methods (Bangladesh dataset)
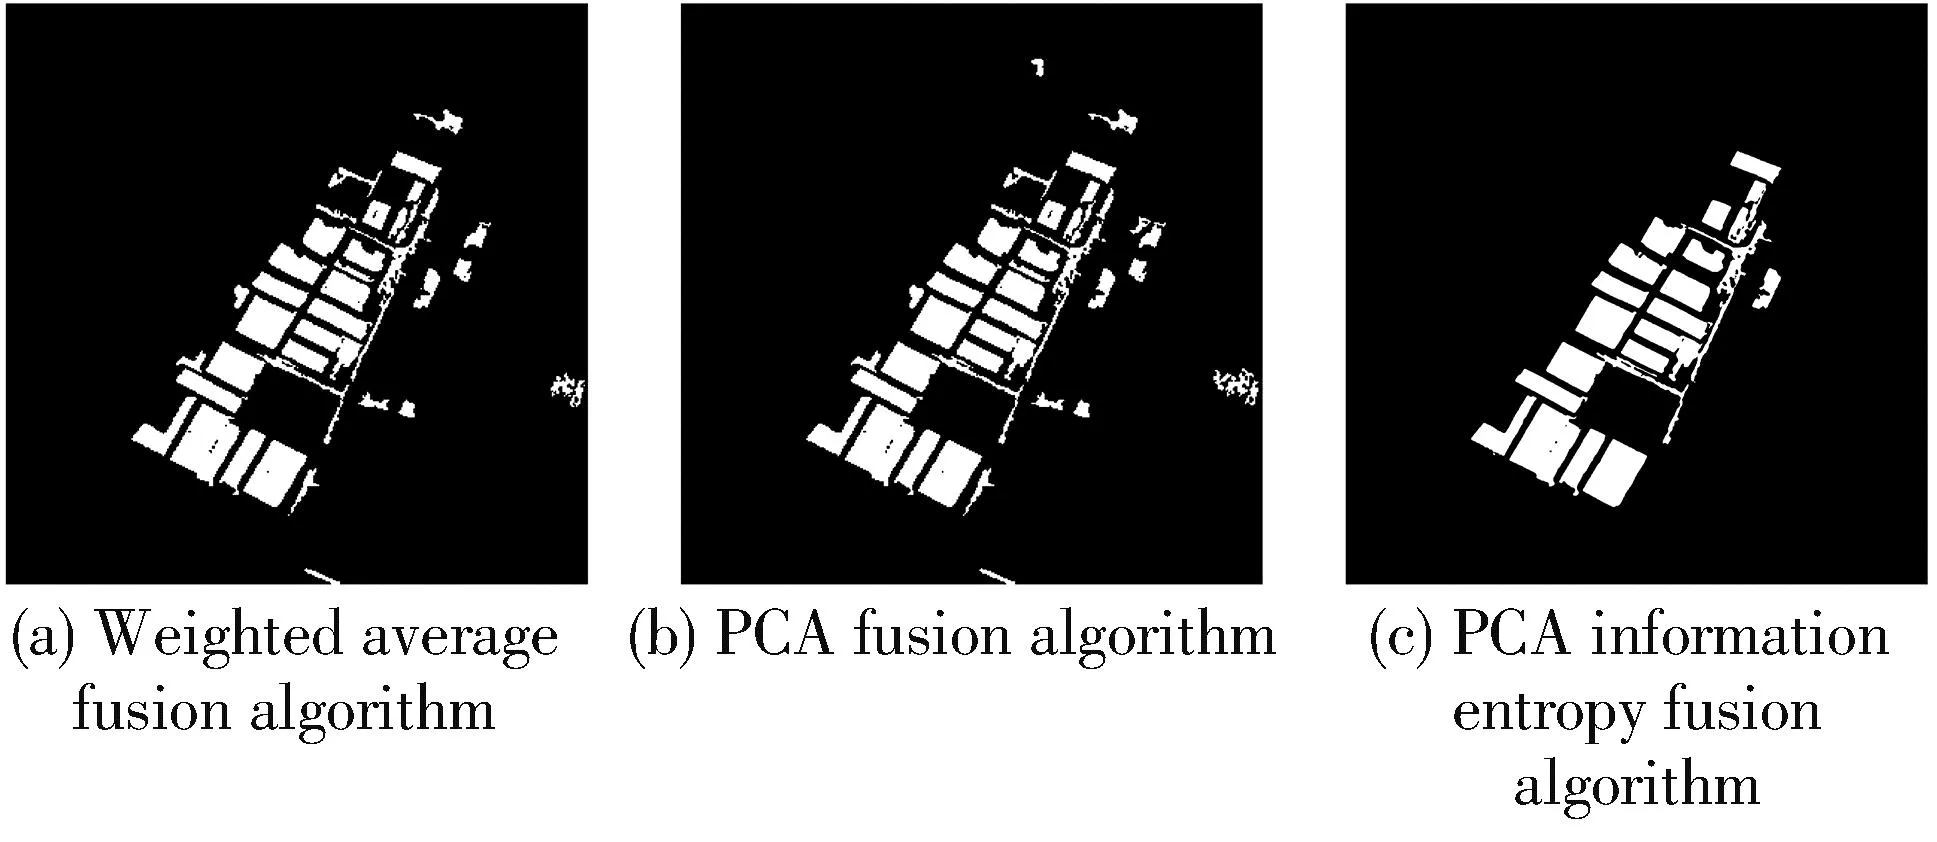
Fig.19 High-resolution RS image change detection results of different fusion methods (Google dataset)
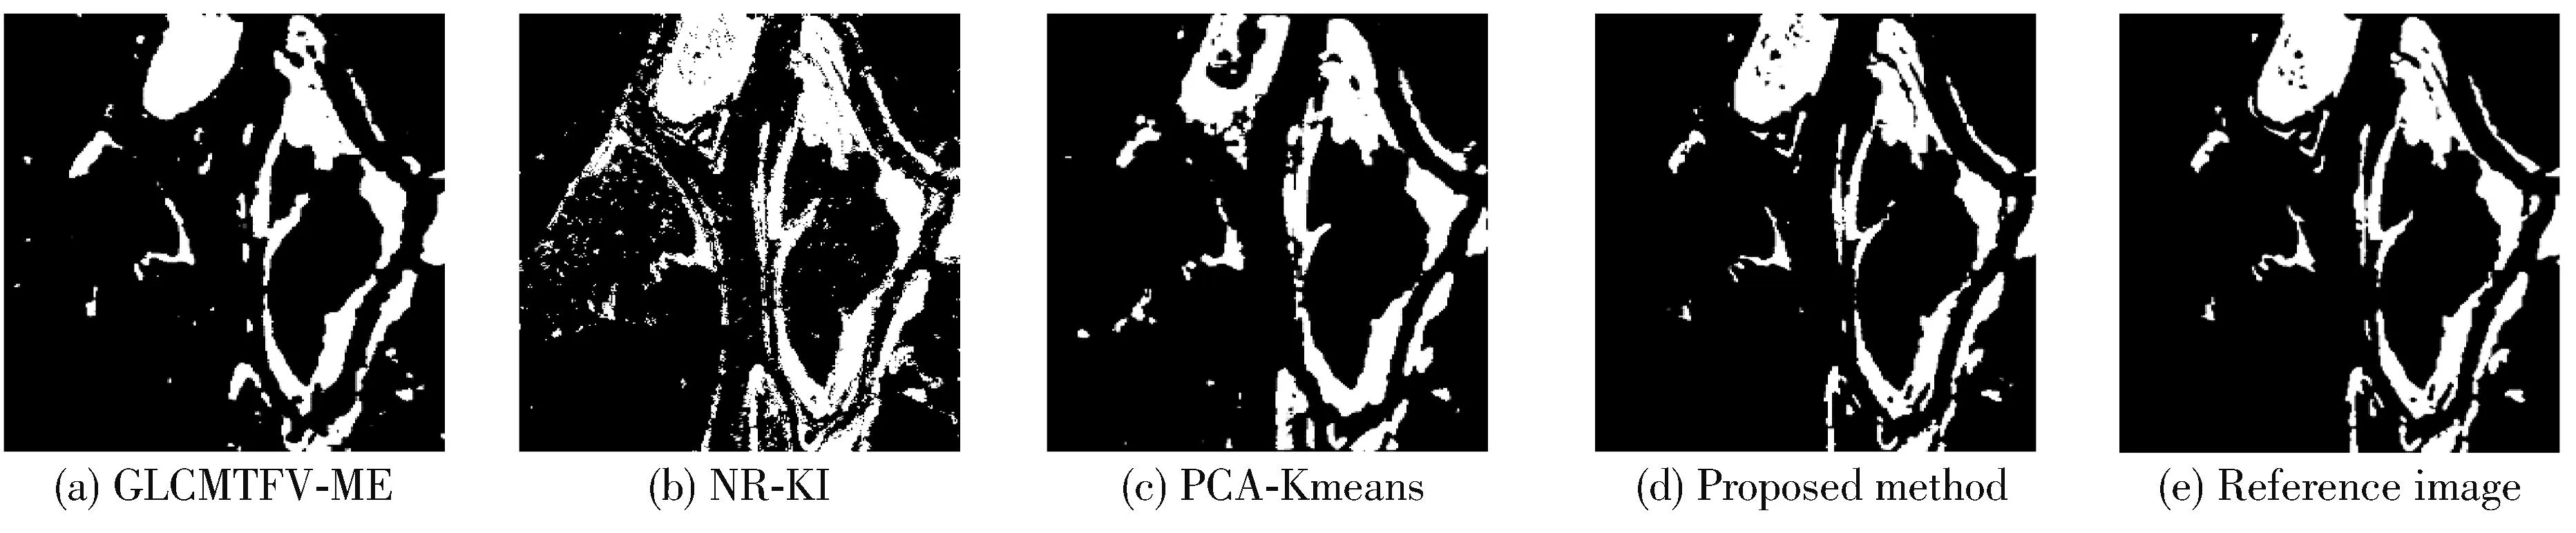
Fig.20 The SAR image change detection results of different comparative methods (Ottawa dataset)
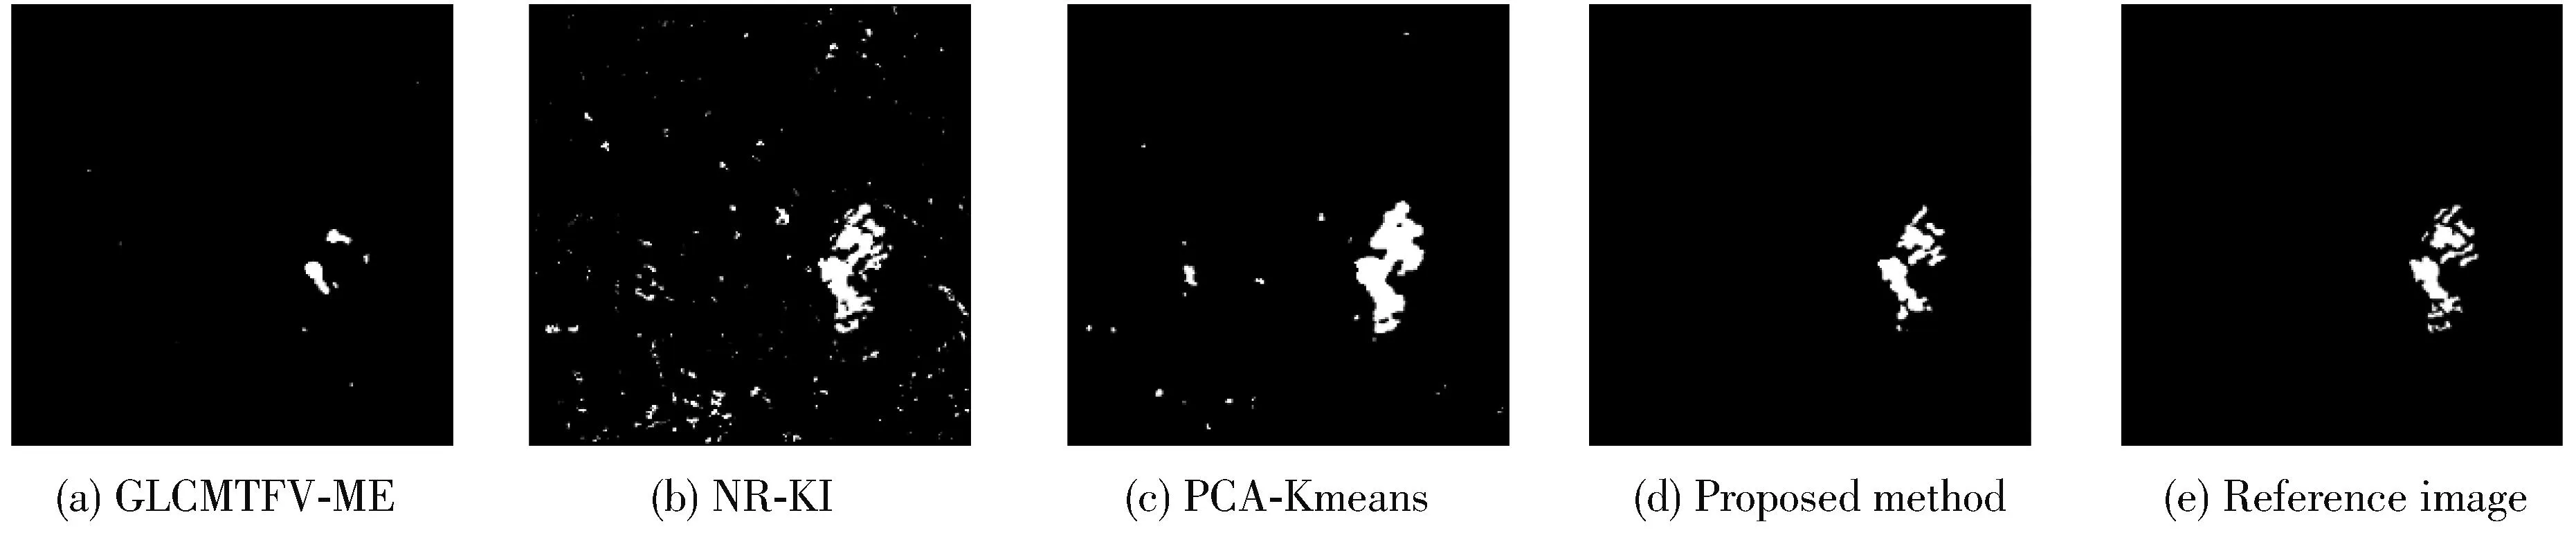
Fig.21 SAR image change detection results of different comparative methods (Bern dataset)
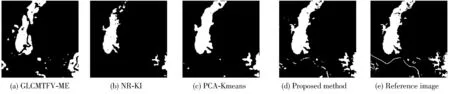
Fig.22 SAR image change detection results of different comparative methods (Bangladesh dataset)
2.6 Comparative experiments and analysis
In order to verify the effectiveness of the proposed method,it is compared with the following three methods.(1) The single-use texture feature method is a segmentation algorithm combining texture features vector and maximizing entropy threshold[24],which is denoted as “GLCMTFV-ME”.(2) The method of single use of neighborhood features is denoted as “NR-KI”,where NR method[21]is used to construct the difference image,then the KI threshold method is used for threshold segmentation.(3) The method based on PCA feature extraction[20]adopts PCA to extract feature vectors of difference images for change detection,which is denoted as “PCA-Kmeans”.The change detetion results are shown in Figs.20-23,in which the (a),(b),(c),and (d) sub-figures represent the change detection results of GLCMTFV-ME,NR-KI,PCA-Kmeans,and the proposed method,respectively.
2.6.1 Comparative analysis by using single texture features
The proposed method is compared with GLCMTFV-ME,and its performance is verified by experiments based on Ottawa,Bern,Bangladesh,and Google Datasets.Figs.21(a) and 23(a) have a lot of missed information,and the texture difference image constructed by the GLCMTFV-ME from the 32-dimensional texture feature vector can not effectively detect the changed area.On the change detection of high resolution RS images,the changes information of target building can’t be effectively detected.The proposed method gives better results for the fine edge part and has less clutter,which can effectively detect the change area.
As can be seen from Table 4,the FN of GLCMTFV-ME method is 854 and the Kappa is 0.400 in Bern area,while the FN of the proposed method is 174 and the Kappa coefficient is 0.856 5.In Ottawa and Bangladesh,the Kappa of the proposed method are 0.893 0 and 0.922 9,while the Kappa of GLCMTFV-ME method is 0.766 and 0.594,respectively.
Therefore,the proposed method can detect the change region more effectively than the methods based on single texture feature vector,and can extract the change information better while resisting noise.
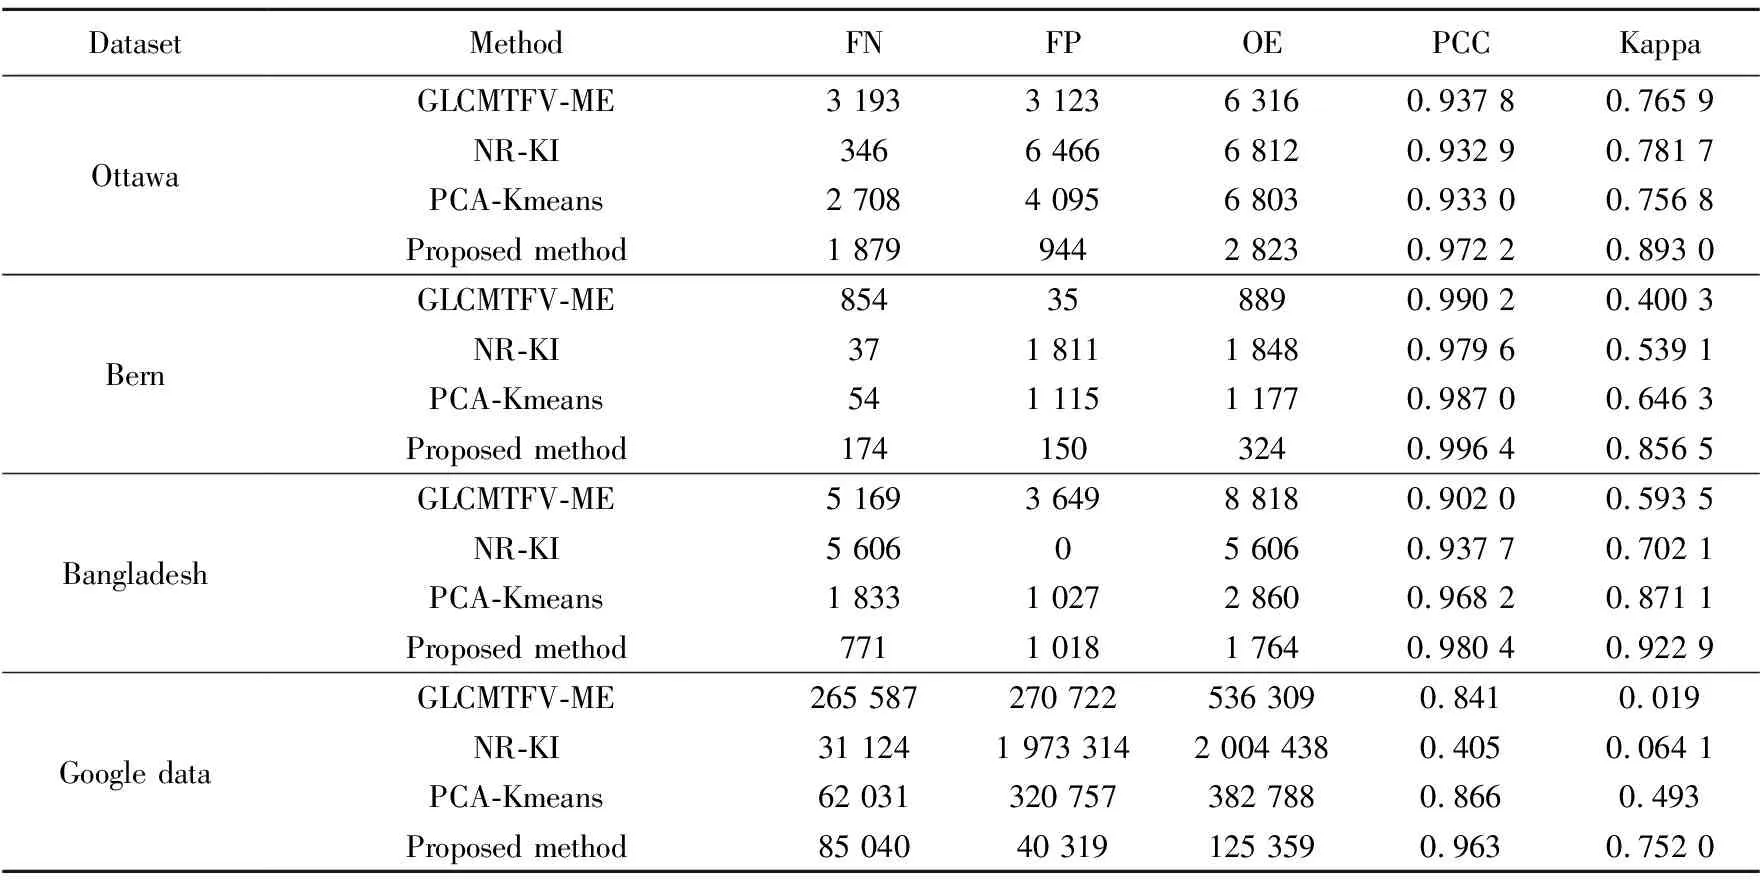
Table 4 The RS change detection index of three groups of comparative experiments
2.6.2 Comparative analysis by using single neighborhood features
The proposed method is compared with other methods by using single neighborhood features.Due to the NR-KI method is less resistant to noise and cannot effectively combat RS image noises,Figs.20(b) and 21(b) have more noise.Fig.23(b) has too many wrongly detected regions and cannot effectively separate the changing regions and non-changing regions.The detection result image of the proposed method has better performance for the fine edge parts and fewer stray points,which can effectively detect the changing regions.
It can be seen from Table 4,the FN of NR-KI method is 5 606 in Bangladesh,which is much higher than the FN of the proposed method.And the proposed method’s Kappa is 0.922 9.Therefore,the method only based on the single neighborhood features can’t suppress the background information better and has more noise.The proposed method combines the features of neighborhood and texture,so as to extract the change information better while resisting noise.
2.6.3 Comparative analysis with PCA feature extraction methods
Compared with the results of PCA feature extraction method,PCA feature extraction method can detect more information,but there is too much error detection information,as shown in Figs.20(c) and 21(c).From Fig.22(c),the PCA feature extraction method can detect most of the change region,but there are too many noise points.The detection result image of the proposed method has better detection results for the fine edge part and less noise points,and can effectively detect the change region.
It can be seen from Table 4 that the FP of PCA-Kmeans is 4 095 in the Ottawa region,while the FP of the proposed method is 944 and the Kappa is 0.893 0.In the Bern and Bangladesh regions,the Kappa for the proposed method is 0.856 5 and 0.922 9,respectively,while the Kappa for the PCA-Kmeans method is 0.646 and 0.871,respectively.
The proposed method can reduce the OE and improve the change detection accuracy,therefore it is more effective than the method based on PCA extraction of differential image feature vectors.
3 Conclusions
In order to improve the accuracy of change detection methods,the PCA feature fusion principle and information theory are studied and applied to the field of RS images.And a new unsupervised change detection method is proposed for RS images by using PCA information entropy to fuse texture features and neighborhood feature,which can make full use of texture information and neighborhood information of images to find more information hidden in the datasets.Through different types of experiments on various datasets,the proposed method is compared and analyzed with other advanced methods.The experimental results demonstrate the proposed method obviously improves the accuracy of the algorithm and has better performance of change detection for RS images.In the future work,the influence of shape features will be considered for the change detection and the methods to improve the calculation speed of GLCM method also will be studied.
 Journal of Measurement Science and Instrumentation2023年4期
- Journal of Measurement Science and Instrumentation的其它文章
- A synchronous scanning measurement method for resistive sensor arrays based on Hilbert-Huang transform
- A covert communication method based on imitating bird calls
- An image dehazing method combining adaptive dual transmissions and scene depth variation
- Research on restraint of human arm tremor by ball-type dynamic vibration absorber
- Drive structure and path tracking strategy of omnidirectional AGV
- Electro-hydraulic servo force loading control based on improved nonlinear active disturbance rejection control