
Elemental Assessments in Paddy Soil for Geographical Traceability of Rice from Peninsular Malaysia
2023-09-05 13:00NazaratulAshifaAbdullahSalimNorlidaMatDaudJulietaGriboffAbdulRahimHarun
Rice Science 2023年5期
Nazaratul Ashifa Abdullah Salim, Norlida Mat Daud, Julieta Griboff, Abdul Rahim Harun
Research Paper
Elemental Assessments in Paddy Soil for Geographical Traceability of Rice from Peninsular Malaysia
Nazaratul Ashifa Abdullah Salim1,2, Norlida Mat Daud1,3, Julieta Griboff4, Abdul Rahim Harun2
()
This investigation aimed to establish the geographical traceability of Malaysian rice by assessing the elemental composition in paddy soil. Multi-element determination in combination with a chemometric approach was applied to evaluate the elemental concentrations of paddy soil from granaries cultivated with the same rice variety and to assess the relationship between elements in the soil and rice (SAR) system. A total of 29 elements (aluminum, arsenic, barium, bromine, calcium, chlorine, cobalt, chromium, cesium, europium, iron, gallium, hafnium, potassium, lanthanum, lutetium, magnesium, manganese, sodium, rubidium, antimony, scandium, samarium, thorium, titanium, uranium, vanadium, ytterbium and zinc) were successfully determined in paddy soil from Kedah, Selangor and Langkawi by neutron activation analysis. A significant difference (< 0.05) between 18 elements in the soil samples was obtained. The chemometric approaches of principal component and linear discriminant analyses demonstrated clear discrimination and highly corrected classification (100%) of the soil samples. A high classification (98.1%) was also achieved by assessing 10 elements (aluminum, arsenic, bromine, chlorine, potassium, magnesium, manganese, sodium, rubidium andzinc), which similarly applied to rice geographical origin determination. Similar elements in SAR were also observed for differences in the pattern of correlation and bioaccumulation factor between the granaries. Furthermore, the generalized Procrustes analysis showed a 98% consensus between SAR and clear differences between the studied regions. The canonical correlation analysis demonstrated a significant correlation between the chemical profile of SAR (2= 0.88,< 0.001). Therefore, the current work model provides a reliable assessment to establish rice provenance.
soil; rice; multi-element; correlation; geographical origin
Soil elemental properties are capable of being reflected in the agricultural product. The dynamic chemical processes such as dissolution, complexion, sorption, precipitation and volatilization influence elemental behaviour in soil, besides the soil type and parameter, and environmental conditions (Kabata-Pendias, 2013). Additionally, human activities including mining, urbanization and agricultural practices also affect the accumulation of elements in plant tissues due to remobilization and bioavailability processes (Payus et al, 2015; Chai et al, 2019). Hence, the localization of chemical elements in the plant creates a unique fingerprint in the final agricultural product that characterizes its geographical origin, which may subsequently be applied in developing product traceability.
Paddies are generally cultivated on temporarily flooded soils. Diverse factors related to soil modifications, including fertilizers and pesticide applications, and contamination issues with heavy metals, contribute to the highly variable chemical composition in paddy soil (Hang et al, 2009). Since rice production areas are geographically distinct from one another, the rice chemical elements could be different, albeit of the same variety. Although Malaysia is one of the rice-producers in Southeast Asia, no study has investigated the relationship between local rice products with their geographical origin, particularly in linking it to the soil matrix. Additionally, underlying issues in which rice processing plants are situated in different regions or states make tracing or identifying the cultivation origin even more challenging. Furthermore, there has been a demand to verify the origin of products in recent years due to a rise in customer interest in organic and health products, and supporting local agricultural products. Therefore, there is a significant need to establish methods of geographical traceability by assessing the chemical of soil and correlating its relationship with rice.
Considerable research has been conducted in assessing the relationship between soil and rice (SAR) specifically for verifying the geographical origin using the compositions of multi-element (Shen et al, 2013;Mu et al, 2019; Qian et al, 2019a), isotopic (Lagad et al, 2017) and anions (Sun et al, 2014). Nevertheless, the multi-element composition has been widely applied in this kind of investigation. Rationally, the elemental composition in soil and food matrix is more stable compared to organic composition as some organic compositions may easily modify with the temperature, light and storage period (Qian et al, 2019a). This approach has also been used to verify other agricultural products, including tea (Lagad et al, 2014; Liu et al, 2019), wheat (Zhao et al, 2013;Liu et al, 2017), honey (Baroni et al, 2015), apple (Aguzzoni et al, 2019) and banana (Wang et al, 2020). Principally, using multi-elemental profiles of rice as a fingerprinting approach necessitates the proper selection of relevant elements that typically represent the characteristics of the soil of origin. In addition, multi-element provides a dependable marker in linking the environmental influence from anthropogenic activities, underground rock, temperature and climate, notably from the soil,to rice composition (Podio et al, 2013; Mu et al, 2019). Thus, the association between the chemical composition of rice and the provenance of soil is commonly regarded as a crucial criterion for classifying rice according to geographical origin.
Profiling of the elemental composition is generally performed using methods that determine simultaneous multi-elements, time-saving and cost-effective. Analyses such as inductively coupled plasma mass spectrometry (ICP-MS) and neutron activation analysis (NAA) are generally used to serve the purpose of quantifying the elements. However, in this preamble investigation, NAA was considered a more convenient method in treating soil samples than ICP-MS, which involves the usage of strong acids during the sample preparation stage. Moreover, NAA allows simultaneous determinationof multi-element with high precision using a low sample amount in the form of a solid matrix (Kukusamude and Kongsri, 2018). Although the analysis of multi-elements by NAA has been widely used for food origin traceability, simultaneous evaluation of the soil composition is limited. A small number of works were performed in assessing agricultural products to the soil of origin using NAA such as tea from India and wine in Moldova (Lagad et al, 2014; Zinicovscaia et al, 2017). Meanwhile, Seeprasert et al (2017) also employed the NAA technique to quantify SAR elements, but only to evaluate bioconcentration factors in rice. Therefore, the current work demonstrated an elemental profiling development specifically by NAA to classify the paddy soil group regions and assess the relationship of SAR in order to establish the geographical origin.
The assessment of the soil-plant relationship regarding multi-element compositions, particularly in rice cultivation, mostly focuses on the effect of contamination, the efficiency of fertilizers or nutrient intake by plants (Hashim et al, 2015; Ying et al, 2018). In Malaysia, individual assessments of the interest element between SAR were investigated through correlation, translocation factor, biological absorption coefficient and bioaccumulation factors (BAF) pattern analyses (Alrawiq et al, 2014; Aziz et al, 2015a, b). However, in establishing geographical origin verification, the assessment of a single-element concentration is not sufficient. But, chemometrics allows verifying the contribution of each element to the model, and its capacity to discriminate several origins from another with the integration of multi-elemental profiles of soil with those of agricultural products. The generalized Procrustes analysis (GPA) and canonical correlation analysis (CCA) were among the chemometric tools that were effectively applied in the evaluation of the correspondence element between soil and agriculture products to verify their origin (Baroni et al, 2015; Griboff et al, 2019). To the best of our knowledge, no report has been published that uses a chemometric tool to evaluate the SAR elemental interaction while explicitly dealing with agricultural product origin verification.
This study assessed the geographical origin of Malaysian rice corresponding to the soil provenance using elemental profiling in combination with chemometric approaches. It was hypothesized that SAR elemental profile can provide reliable verification for geographical traceability through their inter-relationship assessment. The objectives of this study were to characterize elements in paddy soil that create unique profiles across different regions and to evaluate the inter-relationship between the element profiles of SAR.
RESULTS
Validation of quality control of reference materials
Twenty-nine elements were determined in the reference materials (RMs). The comparison of the current analysis and the corresponding reference values are shown in Table 1. The accuracy of the NAA determination of all elements was satisfactory. The acceptance criteria indicated a satisfactory level of consistency between the measured and certified values with the recovery percentages rangingfrom 90% to 108%. The precision of the analysis was high, with less than 10% RSD. The limits of detection (LOD) values were in the range of 0.05 to 1000 mg/kg.
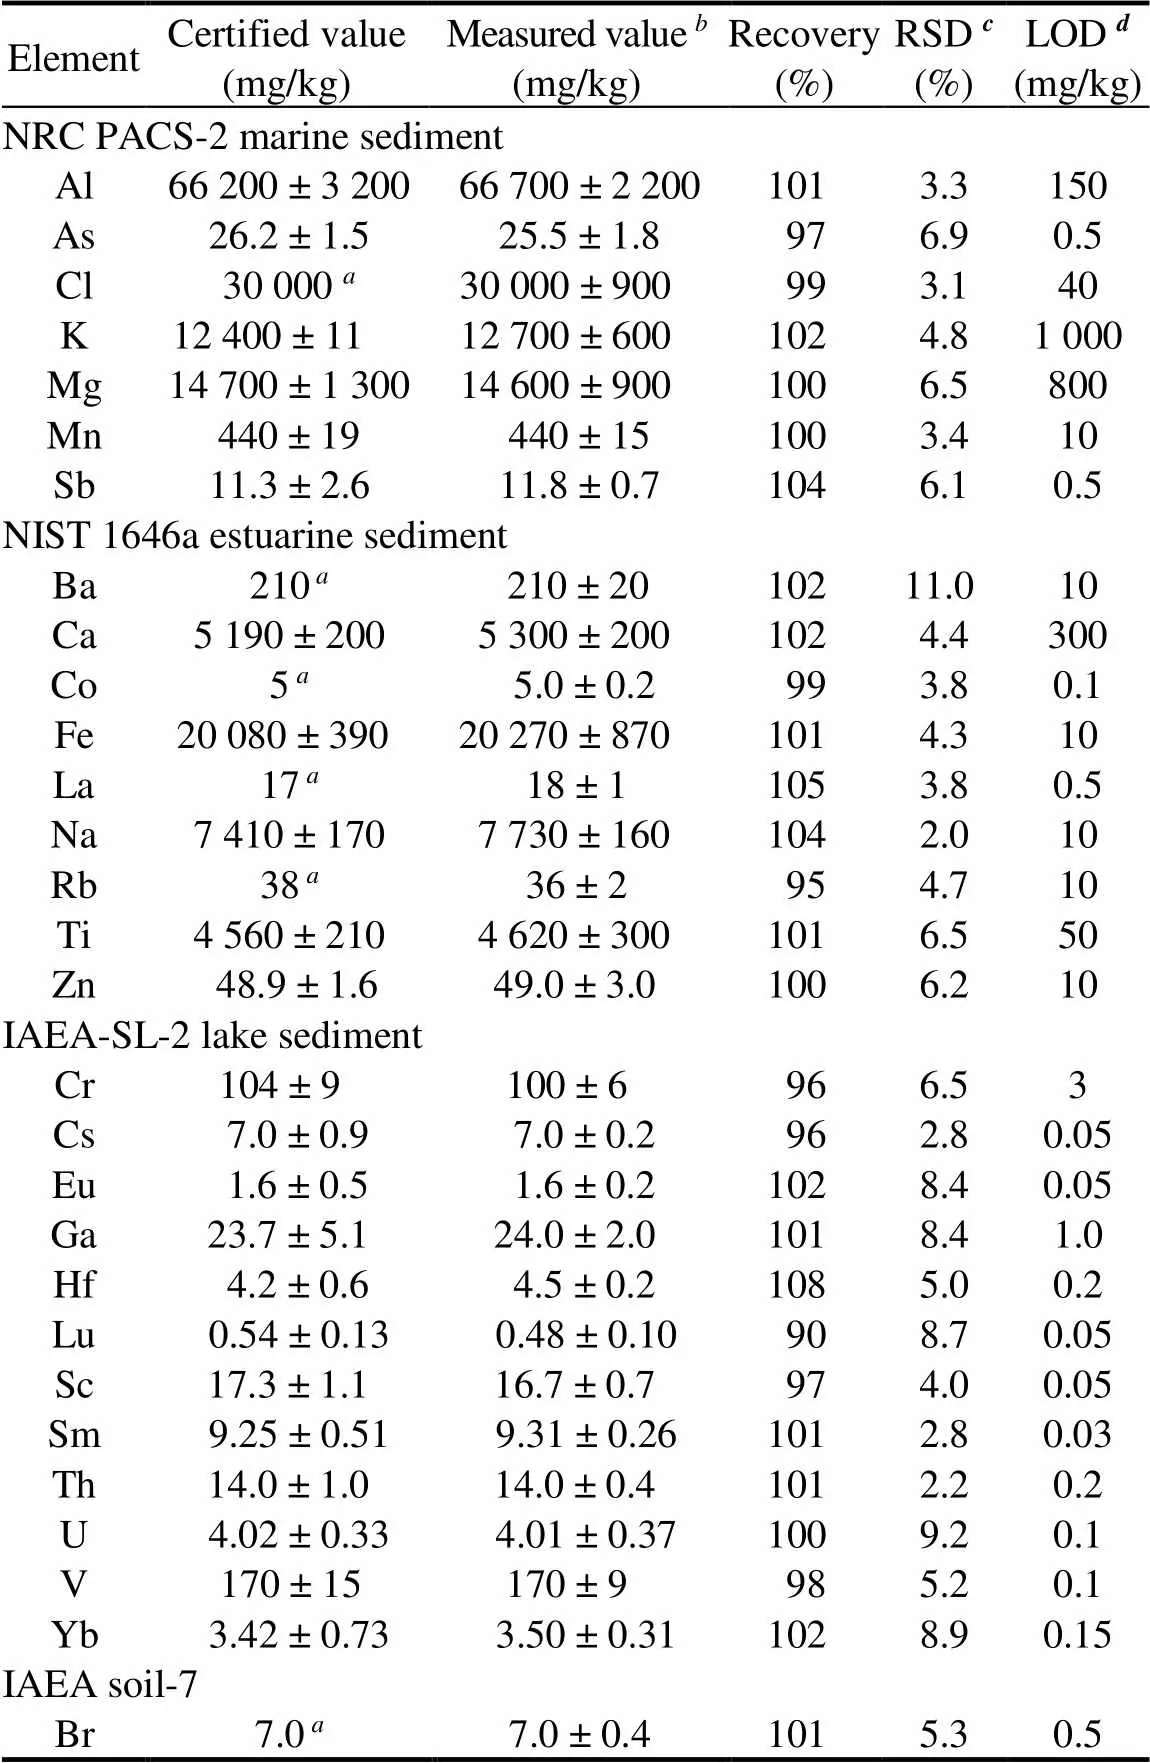
Table 1. Comparison between certified and measured values of reference materials.
Information value;The measured values (=5) are expressed in Mean ± SD;Relative standard deviation;Limits of detection.
Al, Aluminum; As, Arsenic; Ba, Barium; Br, Bromine; Ca, Calcium; Cl, Chlorine; Co, Cobalt; Cr, Chromium; Cs, Cesium; Eu, Europium; Fe, Iron; Ga, Gallium; Hf, Hafnium; K, Potassium; La, Lanthanum; Lu, Lutetium; Mg, Magnesium; Mn, Manganese; Na, Sodium; Sb, Antimony; Rb, Rubidium; Sc, Scandium; Sm, Samarium; Th, Thorium; Ti, Titanium; U, Uranium; V, Vanadium; Yb, Ytterbium; Zn, Zinc.
Differences in element compositions of soil among regions
The multi-element mean concentrations and standard deviations of each soil sampling point are presented in Table S1. The Kedah soil showed the highest concentrations of arsenic (As), calcium (Ca), cobalt (Co), chromium (Cr), europium (Eu), lanthanum (La), antimony (Sb), scandium (Sc), samarium (Sm), thorium (Th), titanium (Ti) and vanadium (V). In contrast, aluminum (Al), bromine (Br), chlorine (Cl), iron (Fe), gallium (Ga), potassium (K), magnesium (Mg), and zinc (Zn) were found to be in the highest concentrations in Selangor soil and barium (Ba), cesium (Cs), hafnium (Hf), lutetium (Lu), manganese (Mn), sodium (Na), rubidium (Rb), uranium (U) and ytterbium (Yb) in Langkawi soil. Subsequently, the analysis of variance showed that 18 (Ba, Br, Cl, Co, Cr, Eu, Fe, Hf, La, Lu, Mn, Na, Sc, Sm, Ti, V, Yb and Zn) of 29 elementswere significantly different (< 0.05) between the granaries (Table 2). The results indicated that elemental levels in soil from different origins had their own profiles.
Pattern recognition and classification of region
Principal component analysis (PCA) revealed that the first four principal components (PCs) which accounted for the total variance of 79.3% were constructed from a matrix of 53 samples and 28 variables. Ca was omitted from the data set due to the low detection values derived from Langkawi soil. Fig. 1-A illustrates the biplot of PC2 versus PC1 on soil samples from Kedah, Selangor and Langkawi granaries. Langkawi samples were mainly located at the negative PC1 and enriched in Na, Rb and K. Instead, Kedah and Selangor samples were shown to be more populated at the center of the quadrant, which had positive and negative PC1 and PC2, respectively. Conversely, the biplot of PC3 versus PC1 presents a distinct separation of soil samples from Selangor and Kedah (Fig. 1-B). Most of the Kedah samples have been observed in positive PC3 and were loaded with Al, As, Ba, Co, Cs, Eu, Ga, Hf, La, Lu, Mg, Sb, Sc, Sm, U, Ti, Th and V. Besides, Br, Cl, Na, Mn, Zn, Cr and Fe were the dominant factors for Selangor samples located at the negative segment of PC3 and had both positive and negative PC1. Yb was excluded in the next analysis due to the low loading score.
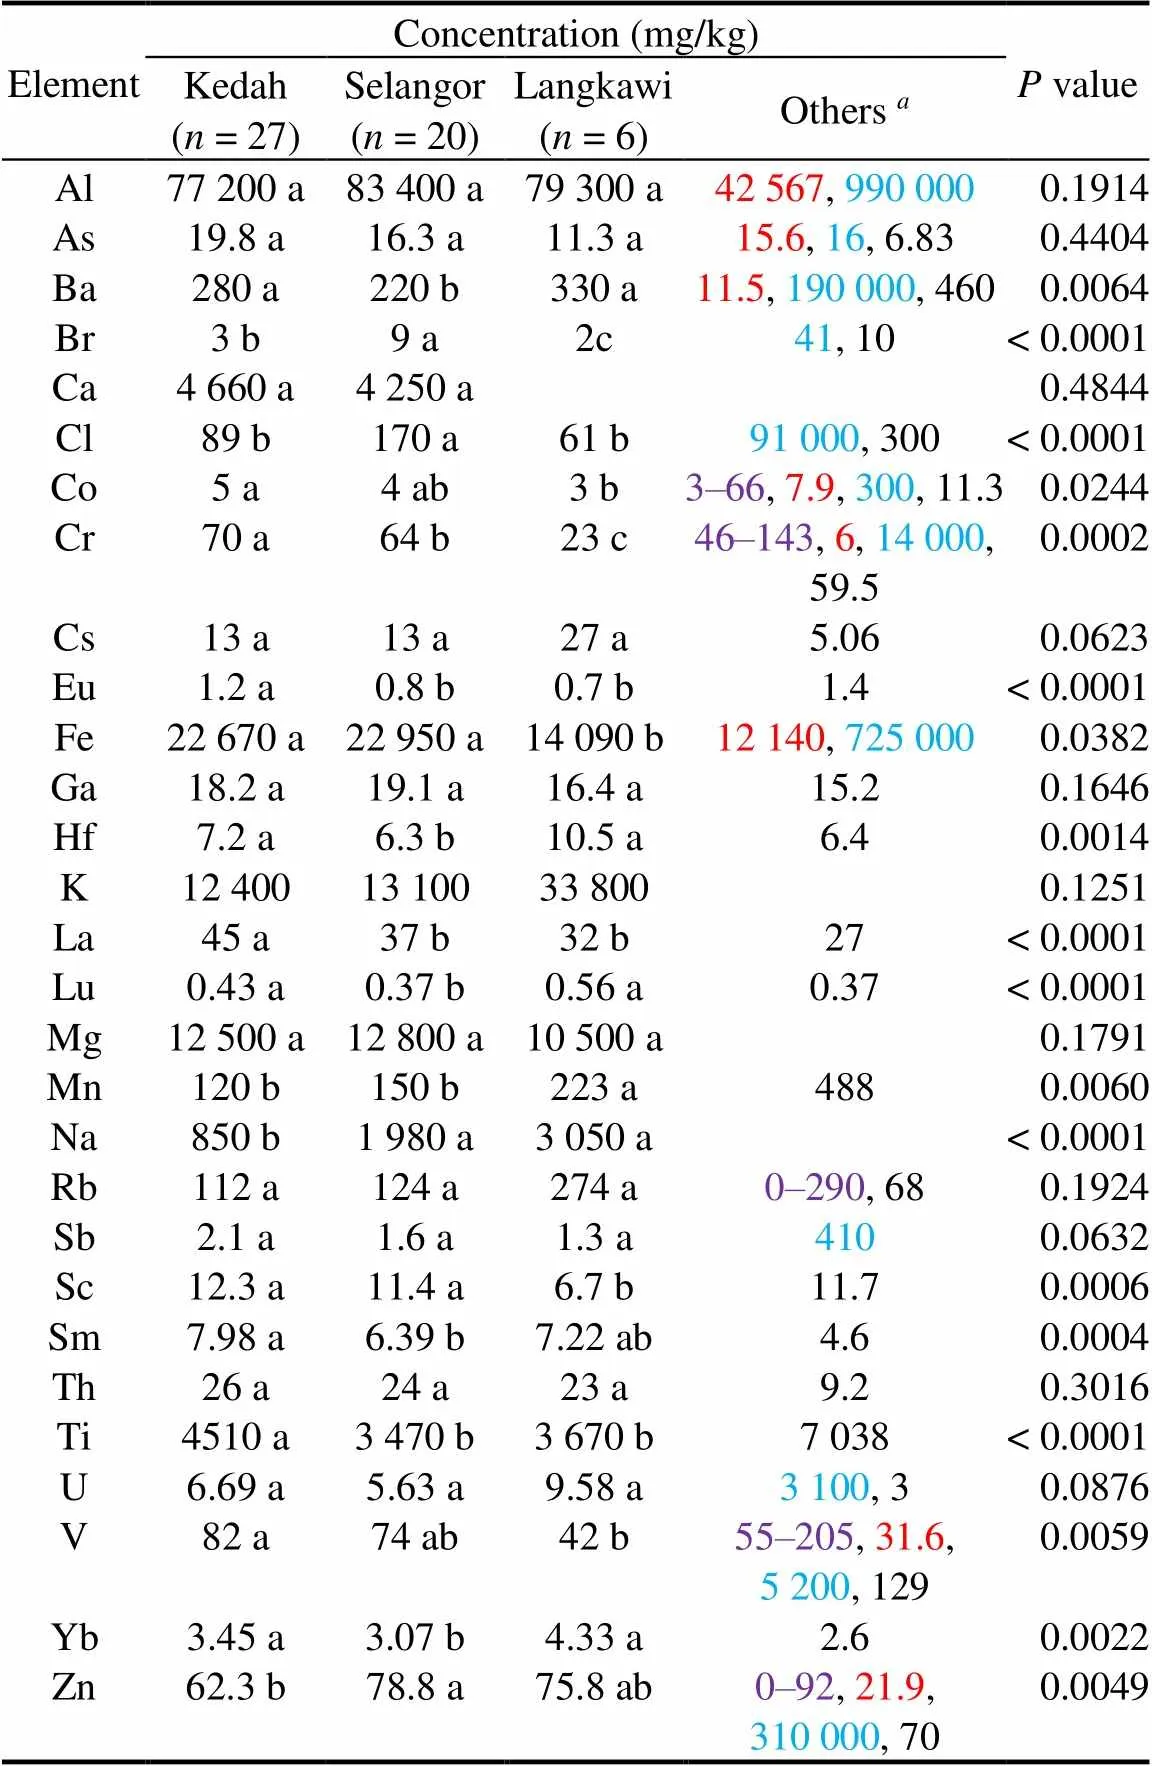
Table 2. Mean of soil concentrations and comparison to other established soil multi-elemental values.
Values in purple are from West Malaysia, Domingo and Kyuma (1983). Values in redare from Malaysian Soil Natural Occurring Background Concentrations, Malaysian Recommended Site Screening Levels (Industrial Soil).Values in blue are fromthe Department of Environment Malaysia (2009). Values in black are world-soil average from Kabata-Pendias (2013).
Al, Aluminum; As, Arsenic; Ba, Barium; Br, Bromine; Ca, Calcium; Cl, Chlorine; Co, Cobalt; Cr, Chromium; Cs, Cesium; Eu, Europium; Fe, Iron; Ga, Gallium; Hf, Hafnium; K, Potassium; La, Lanthanum; Lu, Lutetium; Mg, Magnesium; Mn, Manganese; Na, Sodium; Sb, Antimony; Rb, Rubidium; Sc, Scandium; Sm, Samarium; Th, Thorium; Ti, Titanium; U, Uranium; V, Vanadium; Yb, Ytterbium; Zn, Zinc.
Different lowercase lettersin the same row indicate statistically significant difference between regions (< 0.05).
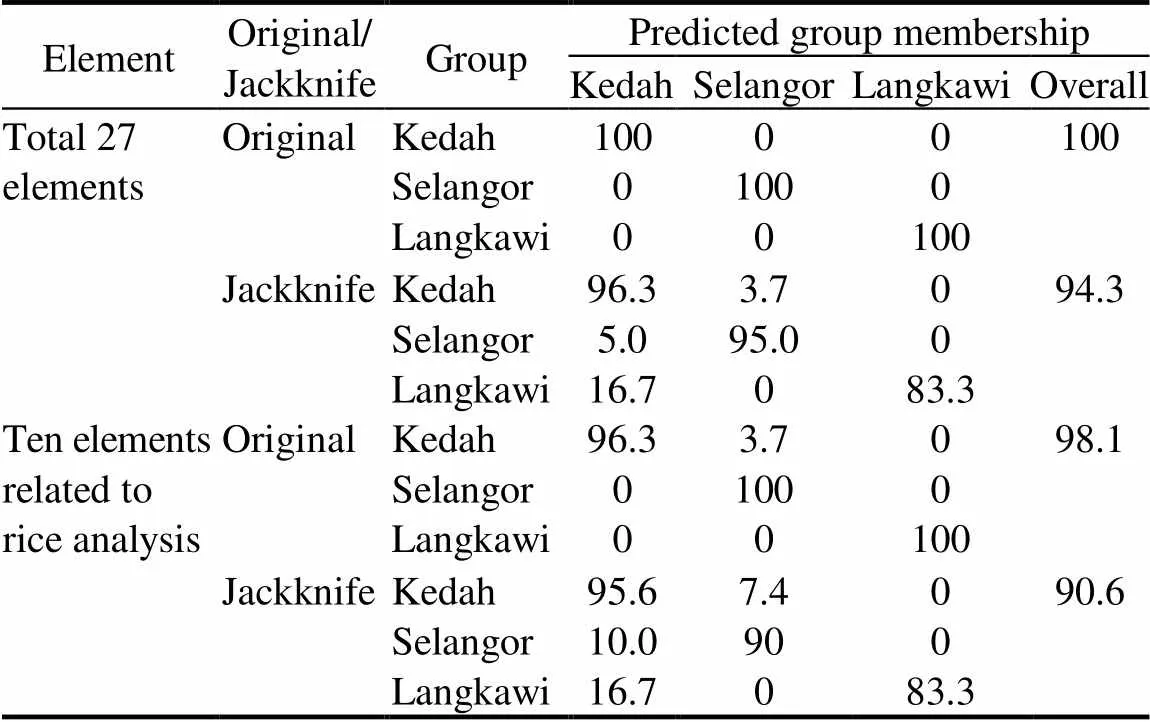
Table 3. Classification of soil samples according to regions. %
The classification of soil samples by linear discriminant analysis (LDA) is described in Table 3. A classification was obtained with an overall correct classification rate of 100% and the Jackknife estimation rate of 94.3%. The separation among granary region groups in the discriminant model was visualized by plotting the scatter plot of two discriminant functions (Fig. 2). It can be markedly shown that samples from the three regions were plotted in separate areas based on the 27 elements. Function 1 accounted for 78.4% of the total variance, and function 2 explained 21.6%. Elements of La (-50), Cr (-19), Hf (16), Sm (11), V (11), Co (10), Cs (10) and Al (10) were the variables with the higher loading value (≥ 10) in discriminant function 1. Function 2 was formed primarily with Ti, Rb and K with loading values of -15, -13 and 12, respectively. Other elements, including As, Ba, Br, Cl, Eu, Fe, Ga, Lu, Mg, Na, Sc, Th, U and Zn, showed moderate weights between 1 to 9 that distinguished the soil of three granaries.
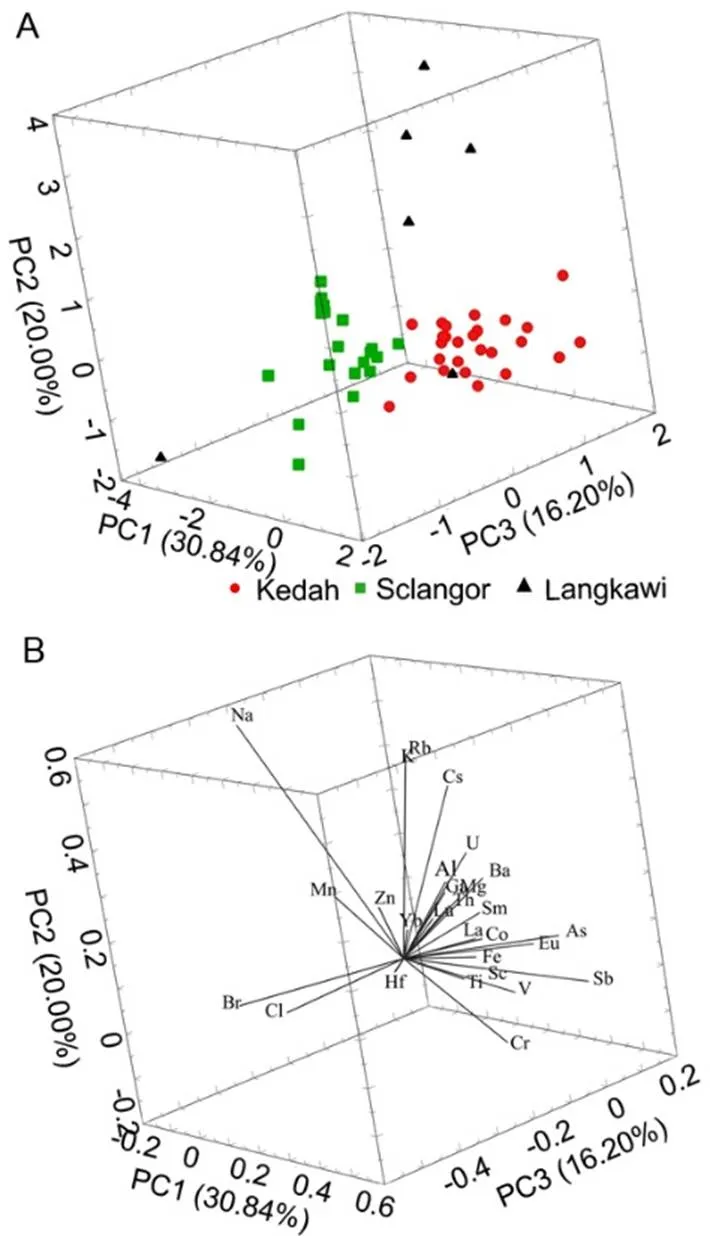
Fig. 1. Principal component analysis (PCA) of soil based on multi- elements.
A, 3D PCA score plot soil sample from Kedah, Selangor and Langkawi Island.B, Loading plot based on 28 multi-elements.
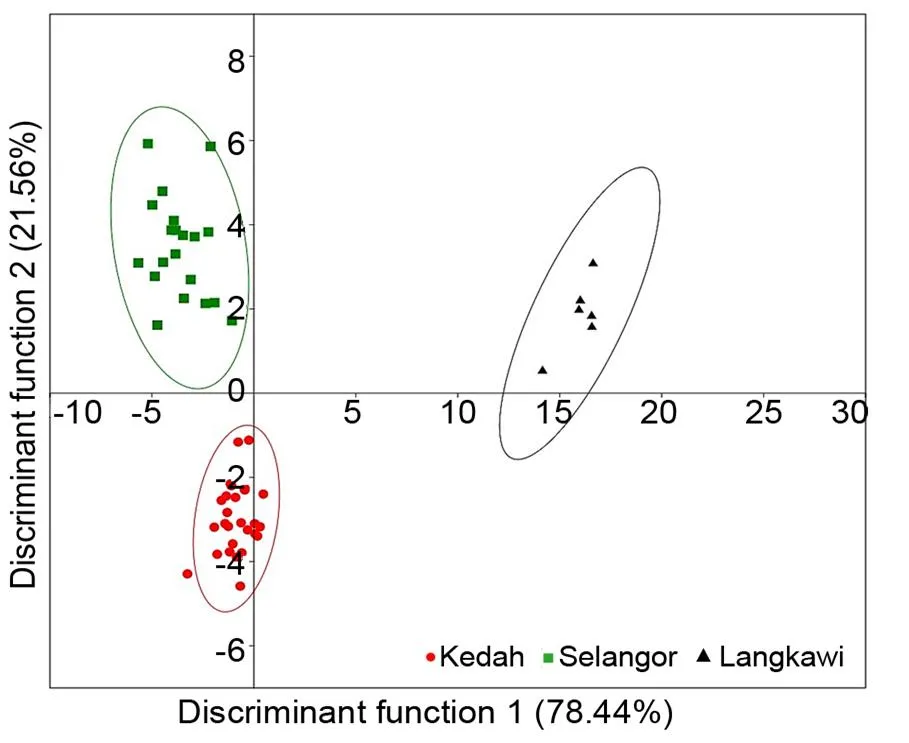
Fig. 2. Linear discriminant analysis scatter plot of the first two discriminant functions of soil samples (= 53) based on 27 multi-elements.
Simultaneously, LDA was also performed based on 10 elements (Al, As, Br, Cl, K, Mg, Mn, Na, Rb and Zn) related to the elements previously determined in rice. The correct classification rate achieved 96.2% for rice samples from the same location based on the combination of similar elements (Salim et al, 2020). Hence, excellent average correct classification rates were also attained for soil indicating 98.1% and 90.6% of the samples correctly classified for original and Jackknife estimation, respectively. The result indicated that the ten elements were also greatly effective in evaluating the traceability of rice that linked to the cultivation region based on the soil assessment.
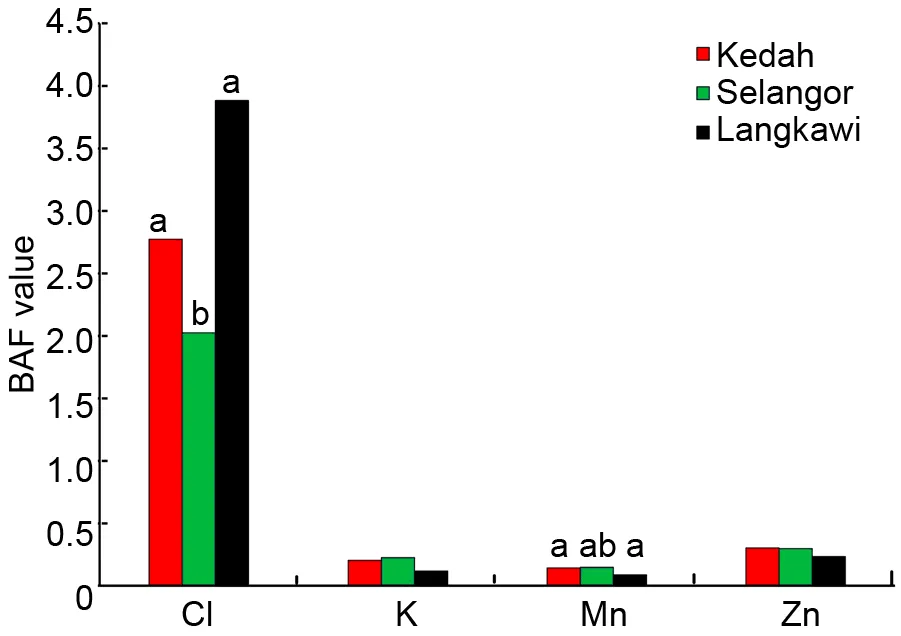
Fig. 3. Bioaccumulation factor (BAF) value of selected elements.
Cl, Chlorine; K, Potassium; Mn, Manganese; Zn, Zinc.
Different lowercase letters above the bars represent significant differences at the 0.05 level.
Relationships between soil and rice composition
The evaluation of the relationships of Al, As, Br, Cl, K, Mg, Mn, Na, Rb and Zn between SAR from each of the granary regions by correlation analysis and BAF are disclosed in Fig. 3 and Table 4, respectively. Each region showed different correlation patterns. However, only the elements As-As, Zn-K and Zn-Mg were positively correlated between SAR inter-relationship samples from Kedah (= 0.49, 0.44 and 0.40, respectively) and Selangor (= 0.53, 0.51 and 0.57, respectively). It is suggested that there were substantial increases of these elements in rice with increasing contents in soils. This analysis indicated that high variability was observed in the inter-relationship of the SAR system among the granaries, which results in different accumulation patterns of the element in the plant tissue.
The BAF values for elements in the rice-soil system in the descending order were Cl (2.63) > Zn (0.29) > K (0.20) > Mn (0.14) > Mg (0.10) > Br (0.09) > Rb (0.08) > As (0.02) > Na (0.01) > Al (<0.01). The value of BAF ≤1 was obtained for Zn, K, Mn, Mg, Br, Rb, As, Na and Al in the rice grains. The results showed that the bioavailability of elements was low in all granaries. However, significant differences in the BAF values of Cl, Mn, Mg, As, Br and Rb were found between the three granary regions which are closely related to the bioavailable elements in their respective soils.
The correspondence between SAR matrix evaluation by the GPA enlightened the variability of 100% between samples explained by the first and second principal axes (Fig. 4). The three geographical regions were well separated based on the ten elements of SAR samples. This result showed that rice data has a significant consensus (98%) with the elements in the soil, as both data sets projected the regions in the same way onto the plane defined by its first two principal axes.
The CCA analysis showed a significant positive correlation between the SAR profiles (Fig. 5). This result indicated that 88% of the variability observed in the element content in rice could be attributed to paddy soil. The contents of Br, Cl and Mg in the soil, and K in rice, displayed significant loadings on the first canonical factor, indicating that they were greatly correlated with this factor. This means that these elements are the ones that have the most impact on the correlation between SAR. Therefore, both GPA and CCA coincided, showing the influence of soil on rice composition.
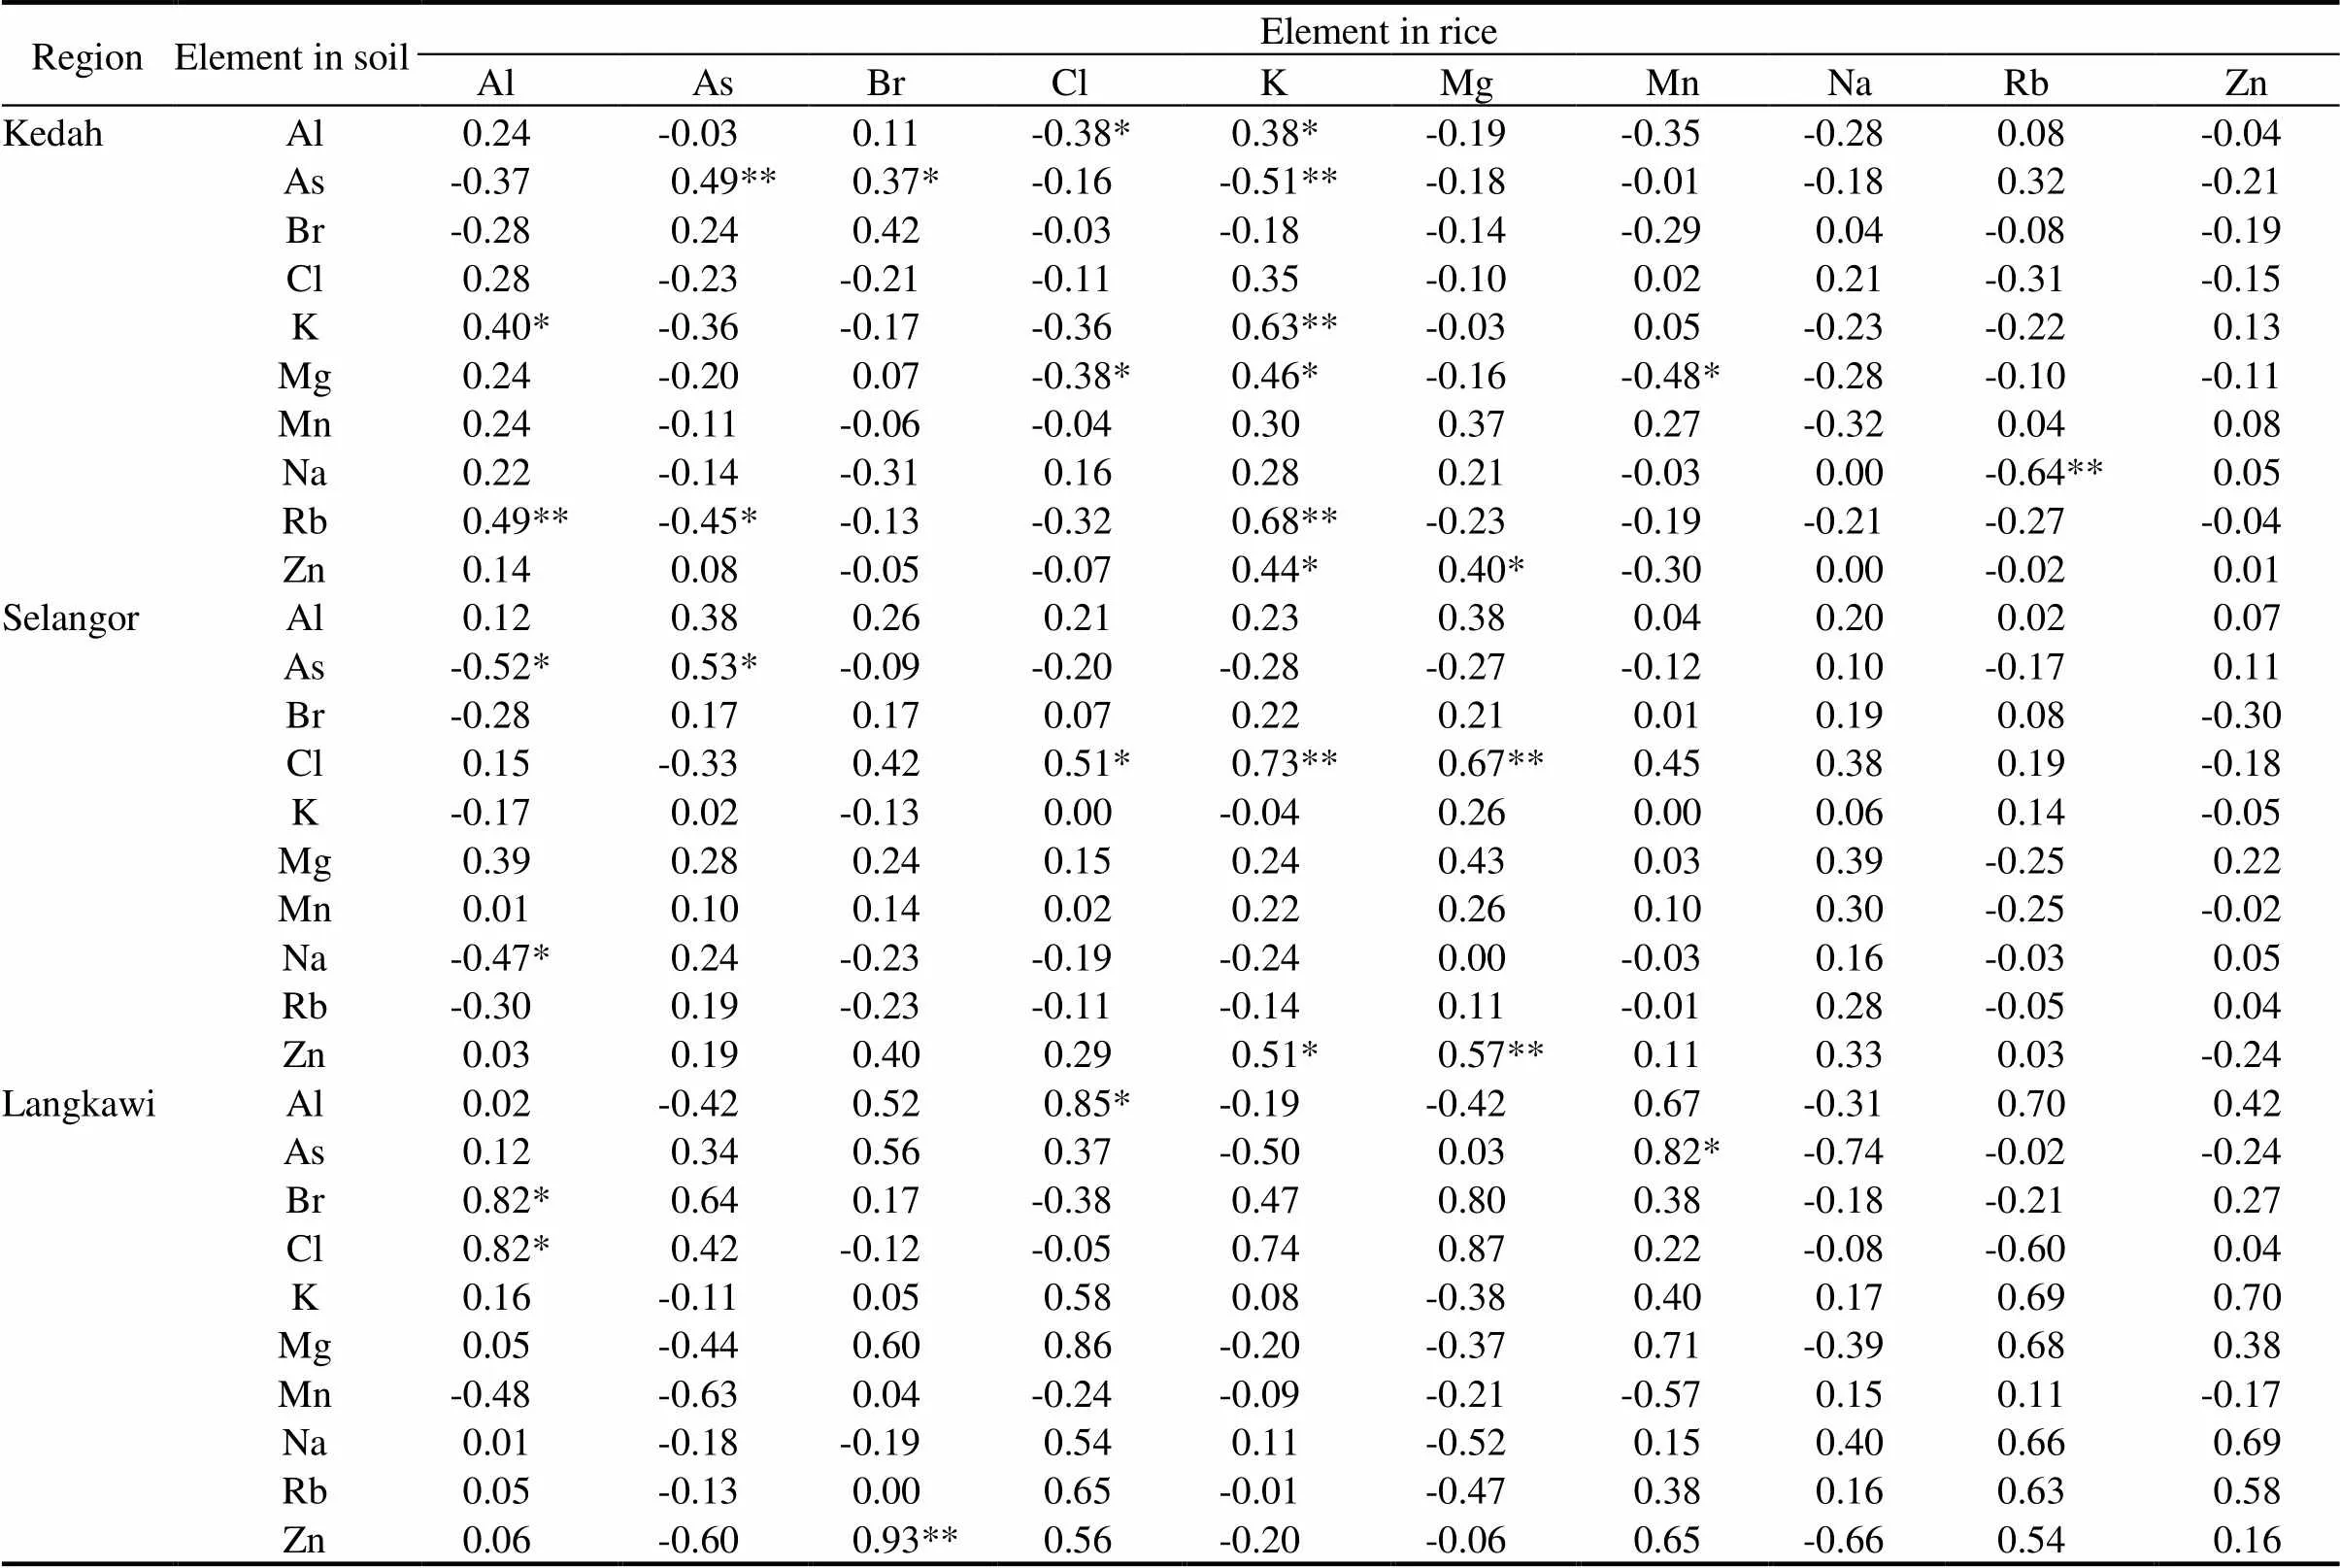
Table 4. Pearson correlation coefficients of elements in soil and rice.
Al, Aluminum; As, Arsenic; Br, Bromine; Cl, Chlorine; K, Potassium; Mg, Magnesium; Mn, Manganese; Na, Sodium; Rb, Rubidium; Zn, Zinc.
* and **, Significant correlations at the 0.05 and0.01 levels, respectively.
DISCUSSION
Mineral compositions in paddy soil play crucial roles that support plant growth. An initial study related to mineral content in paddy soil of west coast Peninsular Malaysia was done in 1969. Then, several studies followed the investigation, which focused on soil fertility and nutrient content (Kyuma and Kawaguchi, 1973; Kawaguchi and Kyuma, 1974a, b). They also reported the total chemical composition of minerals: Si, Fe, Al, Ca, Mg, Mn, Ti, K and P using X-ray fluorescence. Generally, paddy soils on the west coast of Peninsular Malaysia were described as having low Mn oxide, Si and Fe contents despite the high amount of clay with enriched Al and K contents. This could be explained by the granitic nature of the parent materials (Kawaguchi and Kyuma, 1974b). Domingo and Kyuma (1983) reported ten trace element concentrations (B, Cr, Co, Cu, Mo, Ni, Rb, Sr, V and Zn) in paddy soils. Then, more studies were conducted mainly focusing on the composition of heavy metals such as As, Cd, Cu, Cr, Pb and Zn in paddy soils (Khairiah et al, 2009; Payus et al, 2015; Zulkafflee et al, 2019; Zhang et al, 2022). A preliminary study on agricultural soil is necessary for data comparison and assessing chemical changes that occur in the system. Co, Cr, Rb, V and Zn levels in soils from Kedah and Selangor were within the previously reported values (Table 2). In contrast, Co, Cr and V concentrations in Langkawi were lower, while Rb concentrations were higher than the values quantified earlier. Thus, more potential discriminative elements have been defined in this study to distinguish the soils among regions as a result of the large number of elements measured by NAA.
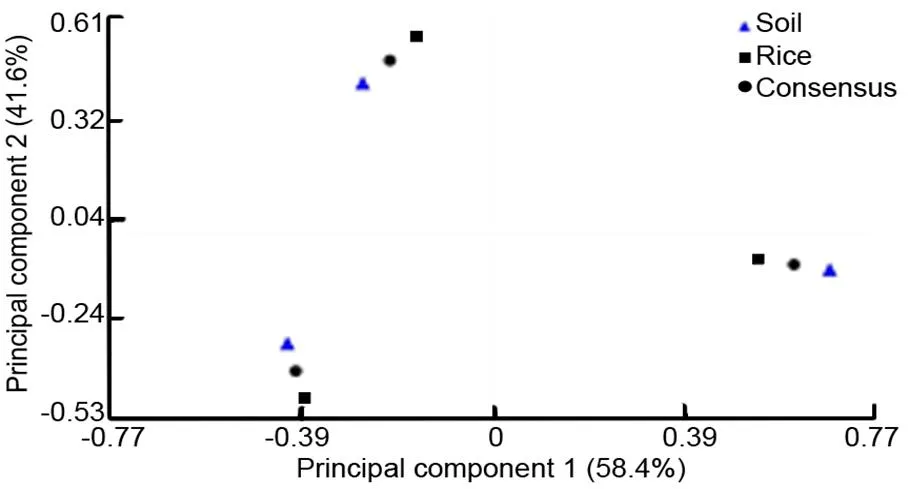
Fig. 4. Configuration of different geographical regions that reflects consensus between soil and rice matrix.
Fig. 5. Canonical variables illustrating the correlation between soil and rice.
**, Significant correlation at the 0.01 level.
The multi-element analysis showed that the concentrations of Al, Ba, Cr, Fe, V and Zn had exceeded the Malaysian background soil levels. However, it did not reach the concentration of Malaysian Recommended Site Screening Levels (SSL) for industrial soil (Department of Environment Malaysia, 2009). In addition, the mean values of Co, Cr, Rb, V and Zn were within the range described in SSL recommended values. The concentrations of several elements, including As, Cr, Cs, Ga, Hf, La, Lu, Rb, Sm, Th, U, Yb and Zn, were quantified as higher than world-soil average levels (Kabata-Pendias, 2013). However, the amount of As, Cr, U and Zn were still below SSL values.
Variations in rare earth elements (Eu, La, Lu, Sm and Yb) suggested that the distribution may be related to the difference in the geological characteristic. The existence of La, Yb, Sm and Eu were similarly observed in the paddy soils of Jiulong River Basin, China, and were shown to be closely related to the parent materials (Huang H B et al, 2019). The bedrock or parent material is a primary source of elements in the soil. The weathering process of a single bedrock material such as granite in Selangor or sedimentary rock in Kedah and Langkawi can release the crystalline structure of several rock minerals that enable chemical elements to mobilize within the soil matrix (Cocks et al, 2005;Arunakumara et al, 2013). For example, Aziz et al (2015b) reported high amounts of Cr, Co and Ni in the paddy soil from Ranau Valley (Sabah, Malaysia) that are associated with its parent materials of ultrabasic rock. Therefore, the mineral content of the parent material is a significant factor that determines the variation of the multi-elemental profile of the granary soil.
Trace elements such as Ba, Br, Cl, Co, Cr, Fe, Hf, Mn, Na, Sc, V and Zn found in soils are not primarily determined by the mineralogical composition of the parent material. Their variabilities are influenced by soil type, weathering degree, climate, and other factors that predominate throughout the soil formation process (FAO, 1972). Most paddy soils have greater trace element concentrations than non-paddy soils due to anthropogenic inputs such as irrigation, fertilizer application, crop residue burning and farming near mining tailings (Sebastian et al, 2015). Nitrogen-phosphorus-potassium fertilizer regime used in the granary may have influenced the increment of Fe, Co, Ni, Mn and other element levels in the soil (Qian et al, 2019b). P in the fertilizer is derived from phosphate rock containing a substantial amount of Pb, Co, Mn and Fe as impurities (Jamil et al, 2011). Consequently, excessive usage of fertilizers was also typically associated with heavy metal contamination in many Malaysian granaries (Khairiah et al, 2013; Zulkafflee et al, 2019).
Br and Cl are halogen elements with similar chemical properties (Yuita et al, 1982a). Both elements are generally found in soils in highly soluble form and are subject to losses by leaching (FAO, 1972). Yamada (1968) measured Br and Cl in soil and tobacco plant in Japan using NAA and X-ray fluorescence. The method of NAA was also applied in determining the concentrations of Br and Cl in paddy soil of different areas in Japan. Levels of Br and Cl from the basin of the Miomote River, Nagara River, Fukui and Tochigi Prefecture, Japan, ranged from 0.33 to 22 and 13 to 172 mg/kg, respectively (Yuita et al, 1982a, b; Yuita, 1983). These results agreed with the range of Br and Cl concentrations found in paddy soil in the current investigation. However, the highest concentration of Cl (470 mg/kg) in paddy soil was recorded from Aomori Prefecture, Japan (Tsukada et al, 2007). The usage of fertilizer and pesticide contribute significantly to the existence of Br and Cl in paddy soil (FAO, 1972;Ali et al, 2020).
Furthermore, the contribution source of Br, Cl and other elements in agricultural soil can also be produced through atmospheric deposition and irrigation systems (Huang Y et al, 2019). In Malaysia, granary areas are commonly susceptible to incineration residues and wastewater from industrial activities even though located far from each other. These substances entered the paddy field through rain, wind and irrigation water (Harun et al, 2020). In this study, the irrigation water of granaries originated from more than one river that carried away dissolve elements from the upper stream. It flowed through countryside residential or industrial areas along the river. Hence, these pathways could influence the type and concentration of elements accumulated in the granary soil system.
Even though some elements exhibit comparable range of concentrations in soil, their presence in rice grains has revealed considerable differences between regions (Salim et al, 2020). Although the distributions of Al, As, K, Mg and Rb in soil were comparable across regions, additional variables may alter element bioavailability. Paddy field management activities had a major impact on soil physicochemical properties such as soil texture, pH and soil organic matter, which influence element behavior in the soil (Li et al, 2018). After soil submergence, the concentrations of P, K, Fe, Mn and Si in the soil solution were increased (Yoshida, 1981). However, prolonged submergence may result in acidic soil conditions. Conversely, soil low pH and organic matter degradation could cause K and Mg deficiencies in rice plants (Sebastian et al, 2015). Low pH is also linked to high exchangeable Al levels in soil, which affects rice growth (Shamshuddin et al, 2016). Moreover, microbial activity and redox reactions in soil could alter chemical speciation and affect element solubility (FAO, 1972). This situation was notably seen in relation to the presence of As in SAR (Hossain et al, 2008; Zheng et al, 2013). Therefore, element concentrations that show no significant difference in soil between regions should be considered for further investigation since they have a varied influence on rice grain variability.
Each cultivation region had shown dominating elements associated with each other using PCA and LDA. The pattern of the associating elements in soil reveals more information and structures of the relationship in the SAR system. More relationships were noticed in exchangeable elements, such as K, Mg and Na in soil, which are widely known as the fraction instantly accessible to plants (Shen et al, 2013). In Kedah, the SAR showed immensely high relationships for elements K and As. K in rice showed a highly significant positive correlation with K and Rb in soil. Previous studies identified Rb as a good indicator of geographical identity in agricultural products, including rice. This is because it can mobilize in soil and is easily transferred into the plant (Kelly et al, 2002). An increase of Rb in the soil also leads to an increment of Al in rice. Furthermore, K in rice also indicated positive correlations with Aland Mg in the soil at significance levels. K in rice magnified with the level of soil’s K, Rb, Al, Mg and Zn. Conversely, an inverse association was observed in As SAR inter-relationship with Al and K in the samples from Kedah and Selangor regions. However, both regions and Langkawi established similar association patterns of As in SAR with a positive correlation. Significant positive correlations were also reported between As in rice and soil from China and Bangladesh (Hossain et al, 2008;Fu et al, 2011). As in rice grain has been linked to a specific geographical characteristic that differs in geology, topography, drainage, age of land formation and pattern of sedimentary deposition (Chowdhury et al, 2017). Furthermore, a generally high As concentration in agricultural soil in Peninsular Malaysia might be produced by arsenopyrite, which is prevalent across Southeast Asia (Zarcinas et al, 2004).
Additionally, Cl in soil showed several associations with other elements in rice. Cl increases with the level of its respective soil, which also elevated the accumulation of K, Mg and Al in rice from Selangor and Langkawi. Besides, Cl in rice showed associations with Al and Mg in soil. Both elements exhibited a significant inverse correlation with Cl in rice from Langkawi. However, the correlation was reversed in Kedah rice. Cl is essential for glucose metabolism and the formation of chlorophyll in plants. Cl in soil has a significant role in improving the bioaccessibility of other ions including F–and NO3–to plants (Sun et al, 2014). Therefore, an observation of Cl concentration in soil is crucial as several elements in the SAR system are closely associated with it.
In another assessment, Cl was found to have the highest BAF values and rice plants showed a substantial ability to accumulate Cl. TheBAF value is higher than the soil-to-rice value of 0.43 from Japan (Tsukada and Takeda, 2008). Besides, BAF values of Zn and Mn in this study were comparable to other studies that obtained values ranging from 0.20 to 0.30 and 0.14 to 0.49, respectively (Alrawiq et al, 2014; Satpathy et al, 2014; Kong et al, 2018). Both elements also showed higher BAF values than other toxic elements including As, Cd, Cr and Pb. However, elements with a BAF value below 1 indicate that plants only absorb the elements. Distinctive patterns in BAF between regions signified that the accumulation or absorption rate of elements is affected by multiple factors. The variation of the relationships between SAR may relate to the environment or geological factors. Specifically, the different characteristics of soil such as soil type, pH, organic matter, moisture, Fe-Mn oxides and the presence of Ca and Fe at high concentrations may affect the correlation pattern and accumulation of an element in the SAR system (Yuita, 1982a, b; Kong et al, 2018). Therefore, future studies should include investigations on the effect of these characteristics in rice elemental compositions to corroborate its relationship with the soil of origin.
In the previous work, rice plants cultivated in Kedah, Selangor and Langkawi Island were clearly distinguished with a high accuracy of correct classification rate by LDA and the rate is also comparable to the soil of origin based on ten elements. Rb is one of the indicator elements for Langkawi rice that has an absolute relationship with the soil and shows considerable bioavailability differences between the cultivation regions. Kelly et al (2002) acknowledged the influence of Rb in discriminating premium long rice from Europe, the United States of America and India/Pakistan. Moreover, the concentrations of Mn in soil were inconsistent, unlike the concentrations in rice, which ultimately led to a significant difference in the bioavailability of Mn between the regions. In contrast to Mn between SAR, Al is the main element in the clay content of tropical areas (Wada et al, 1981) that shows a significant difference in rice from the studied regions (Salim et al, 2020). Therefore, Al serves as a crucial element in the traceability of rice because of its capability to correlate several elements in the soil matrix and between rice.
High and similar correlations of elements, including As, Zn, K and Mg, were observed between SAR, particularly in samples from Kedah and Selangor. Concurrently, the geographical traceability of rice showed that Na, Zn, As, Br, K and Cl predominantly distinguished Selangor rice from Kedah and Langkawi (Salim et al, 2020),while for the LDA of soil, Br, Cl, Na and Zn were among the elements that discriminated Selangor soil from the other regions. The observations of Br and Cl presence in SAR had made an essential contribution for selected areas in Japan (Yuita et al, 1982a, b; Yuita, 1983), but for rice geographical traceability, Kukusamude and Kongsri (2018) marked a significant difference of both elements in rice from five Thailand cultivation regions.
Related studies on the geographical origin of rice recently conducted on Brazilian rice based on ten elements, including As, Br, Co, Cs, Fe, K, Mo, Na, Rb and Zn, showed the potential grouping of four cultivars from four distinct geographic regions of Rio Grande do Sul State, Brazil, by PCA and cluster analysis (Kato et al, 2018). Besides, in a separate study, rice from China and Thailand is discriminated from the regions of interest by more than 82% correct classification rate by LDA based on multi-element (Qian et al, 2019a; Kongsri et al, 2021). Nonetheless, no study has associated the elements in rice with the soil of origin. Zinicovscaia et al (2017) and Lagad et al (2014) investigated the association of multi-element in agricultural products with the soil, which enabled the evaluation of wine and tea, that correlates to soil elements, respectively. However, their studies were limited to only using the BAF and correlation methods to examine the individual relationships between the soil elemental composition and the product. Hence, a comprehensive evaluation through chemometrics is necessitated to prove evidence of the correspondence and an integrated overview of both links between SAR matrixes and differences between studied regions.
The evaluation by the chemometrics approach of GPA and CCA provides reliable evidence that links the SAR to their geographical origin. Previously, the combination of the analyses was shown to be effectively used to assess the relationship between agricultural products. A high correlation with a significant level was observed between wine, honey, milk and their soil of origin (Di Paola-Naranjo et al, 2011; Baroni et al, 2015; Griboff et al, 2019). Additionally, an assessment of grain-based products from Argentina revealed that contents of Eu, Ba and K/Rb in the soil as well as Mn, Cu and Rb in wheat mainly contribute to the correlation between soil and wheat (Podio et al, 2013). Variability of the profile of elements with a substantial influence on the soil-grain interaction, such as rice and wheat, could reflect the effect of plant growing environment as well as species or variety differences. Consequently, the distinctive profile of elements, which denotes a close connection between the soil of origin and grains, was successfully evaluated by GPA and CCA, which also allows for geographical discrimination and establishes the provenance.
The paddy soil from Kedah, Selangor and Langkawi can be distinguished based on the elemental characteristic profiles. The chemometrics approach assists in the classification model of paddy granaries regions. The inter-relationship of Al, As, Br, Cl, K, Mg, Mn, Na, Rb and Zn in the soil-rice system demonstrated profound evidence that associates the rice with the provenance soil. These elements are potentially beneficial to assess the geographical traceability of rice. This study signifies the importance of food product investigation, as well as effectively comprehending and modeling the interaction between food and local soil. This study is the first in Malaysia to demonstrate the correspondence between soil and rice samples by appropriate chemometric methods. This indicates that the composition of rice is highly associated, and its origin can be proved based on soil composition. In the future, the composition of soil parameters can be scientifically used to assist the paddy field-specific management and fertilization strategies as well as to establish the methodology of geographical profiling of the rice originating from Malaysia. Additionally, the work model will also be beneficially implemented for other valuable agricultural commodities for geographical traceability, such as oil palm, vanilla, cocoa and pepper.
METHODS
Study area
Samplings of SAR were conducted in three granary regions of Kedah, Selangor and Langkawi Island. The geographic coordinate of all sampling points is indicated in Table S2. In Kedah, the sampling was done at 27 points. Kedah has the largest paddy field in Peninsular Malaysia, which produces approximately 41.5% of total rice production (Mohamed et al, 2016). A total of 20 sampling points were identified in Selangor granaries, which is known as the second-highest rice production region in Malaysia (Department of Agriculture Malaysia, 2019). Both granaries are situated on a coastal alluvial plain on the west coast of Peninsular Malaysia that received the same monsoon season annually. Langkawi Island with 6 sampling points is located approximately 100 km from Kedah. It is the only inhabited island in the country that has paddy cultivation activity. The sampling locations were cultivated with MR220CL cultivar and applied the same fertilizer and pesticide management practices.
Soil collection and preparation
A total of 53 soil samples, which consist of 27 samples from Kedah, 20 samples from Selangor and 6 samples from Langkawi Island were collected from the granary and analyzed to characterize the geochemical signature. A simple random sampling was conducted at a depth of 0–20 cm from the ground using a soil auger during harvesting season when the soils were not flooded (Rendana et al, 2019). All soil samples (1 kg each) were collected at least 2 m away from the field boundary to avoid any unexpected contamination from roads. The soil samples were kept in polyethylene-sealed bags. These samples were dried in the air-circulating oven (SMO28-2, Shel Lab, USA) at 60 ºCfor 7 d. Roots, stones, pebbles, twigs and other impurities present in the dried soil samples were manually removed before mixing and homogenizing in an agate ball mill grinder (Pulverisette, Fritsch, German) until they became powdered prior to the analysis.
Rice data set
Rice data set from 53 samples that consist of 10 elements (Al, As, Br, Cl, K, Mg, Mn, Na, Rb and Zn) was obtained from Salim et al (2020). The samples were collected simultaneously in paired with soil at a similar point of sampling. The elements from SAR were further evaluated for inter-relationship patterns.
Neutron activation analysis procedure
The element concentration of the soil was determined based on Salim et al (2013). Briefly, approximately 100 mg of soil were sealed in small polyethylene vials before undergoing irradiation and γ-ray counting procedures. The irradiations of all samples and RMs were performed with the PUSPATI TRIGA Mark II Reactor at a thermal neutron flux of 1.1012n/(cm2·s). For short-lived nuclides (Al, Ca, Cl, K, Mg, Mn, Na, Ti and V), samples were irradiated at the pneumatic transfer system for 1 min. After a cooling period of 10 min and 24 h, samples were counted at high-purity germanium (HPGe) detector in a fixed position for 300 and 1200 s, respectively. The irradiation procedure of the long-lived nuclides (As, Ba, Br, Co, Cr, Cs, Eu, Fe, Ga, Hf, La, Lu, Rb, Sb, Sc, Sm, Th, U, Yb and Zn) took place at a rotary rack for 5 h and counted for 3600 s after two decay times of 3 and 21 d. An HPGe detector with a resolution of 2.0 at 1332 keV (60Co) and relative efficiency of 40% was used to count γ-ray activities. Then, theγ-ray spectrum was processed with a digitalγ-ray spectrometer (DSPEC jr 2.0 model, ORTEC, USA) and GammaVision Gamma Spectroscopy software (Version 6.1; ORTEC, USA) for peak area evaluation.
Quality control
The quality of the sample analysis was checked with four RMs for soil, including PACS-2 Marine Sediment [National Research Council (NRC), Canada], NIST 1646a Estuarine Sediment [National Institute Science and Technology (NIST), USA], IAEA-SL-2 Lake Sediment, and IAEA Soil-7 [International Atomic Energy Agency (IAEA), Austria] for quality assurance in terms of accuracy, percent recovery and percent relative standard deviation (%RSD). RMs were irradiated simultaneously with a sample under the same condition.
Bioaccumulation factors
BAF is an indicator of the ability of a plant to accumulate an element in comparison to the element in the soil matrix. It is determined using the equation=Tissue/Soil.
The ratio of element concentrations in the edible parts of the plants and total concentration in the soil are represented by CTissueand CSoil, respectively. When the BAF is ≤1, the plant only absorbs but does not accumulate any element, and BAF >1 implies that the plant accumulates elements (Alrawiq et al, 2014).
Statistical analysis
Univariate and correlation analyses were performed using the freeware PAST3 (ver. 3.23, Hammer et al, 2001). Data were checked for normal distribution using the Shapiro-Wilk test. Non-parametric data were log-transformed. Analysis of variance by the Kruskal-Wallis test and Dunn-Bonferroni posthoc test were carried out to determine the differences in median element concentration and BAF between the samples of three regions. The significant values of< 0.05 and< 0.01 were applied throughout the analysis. The soil profile was further investigated using PCA for pattern recognition with 28 elemental variables after excluding the Ca element from the data set since the content of Ca from Langkawi was indicated below the detection limit (<300 mg/kg). The visualization of three-dimensional PCA was created using Veusz (ver. 3.5.3, Boston, USA). A classification model of the soil region group was then developed by LDA. The probability estimation of misclassification in the discriminant analysis was observed by the Jackknife method.
Pearson correlation coefficients were calculated to determine the relationship of element concentration between soil properties and rice. Further evaluation of the relationship of variables between the SAR matrix was performed by GPA and CCA. This analysis was performed using InfoStat software (ver. 2014, National University of Cordoba, Argentina). Specifically, GPA creates the consensus configuration of a group of data sets by superimposing them using data transforms. In this work, the Gower algorithm was used to construct a-dimensional average configurationthat minimizes within-sample variation by applying translation, scaling, and rotation. Following this, a-dimensional group average space (≤) is constructed fromby PCA (Wu et al, 2003). Consequently, GPA theory and algorithms can be applied to match rice elemental data to the corresponding soil data. Conversely, CCA was employed to evaluate the relationships between data sets of SAR. This analysis verified the relationship between SAR studied during this work by GPA.
ACKNOWLEDGEMENTS
This study was supported by the Universiti Kebangsaan Malaysia research grant (Grant No. GGP-2020-012). The authors thank the Muda Agricultural Development Authority and Integrated Agricultural Development Area, Barat Laut, Selangor, and the Department of Agricultural Pulau Langkawi, Malaysia, for the logistic assistance during sampling activities. We also gratefully acknowledge the technical assistance by the NAA Group for the multi-element determination at the Malaysian Nuclear Agency.
SUPPLEMENTAL DATA
The following materials are available in the online version of this article at http://www.sciencedirect.com/journal/rice-science; http://www.ricescience.org.
Table S1. Mean values and standard deviations of multi- element concentrations of soil.
Table S2. Coordinates of sampling points in region of Kedah, Selangor and Langkawi.
Aguzzoni A, Bassi M, Robatscher P, Scandellari F, Tirler W, Tagliavini M. 2019. Intra- and intertree variability of the87Sr/86Sr ratio in apple orchards and its correlation with the soil87Sr/86Sr ratio, 67(20): 5728–5735.
Ali W, Mao K, Zhang H, Junaid M, Xu N, Rasool A, Feng X B, Yang Z G. 2020. Comprehensive review of the basic chemical behaviours, sources, processes, and endpoints of trace element contamination in paddy soil-rice systems in rice-growing countries., 397: 122720.
Alrawiq N, Khairiah J, Talib M L, Ismail B S, Anizan I. 2014. Accumulation and translocation of heavy metals in paddy plant selected from recycled and non-recycle water area of MADA Kedah, Malaysia., 6(4): 2347–2356.
Arunakumara K K I U, Walpola B C, Yoon M H. 2013. Current status of heavy metal contamination in Asia’s rice lands., 12(4): 355–377.
Aziz R A, Rahim S A, Sahid I, Idris W M R. 2015a. Speciation and availability of heavy metals on serpentinized paddy soil and paddy tissue., 195: 1658–1665.
Aziz R A, Rahim S A, Sahid I, Idris W M R, Bhuiyan M A R. 2015b. Determination of heavy metals uptake in soil and paddy plants., 15(2): 161–164.
Baroni M V, Podio N S, Badini R G, Inga M, Ostera H A, Cagnoni M, Gautier E A, García P P, Hoogewerff J, Wunderlin D A. 2015. Linking soil, water, and honey composition to assess the geographical origin of Argentinean honey by multielemental and isotopic analyses., 63(18): 4638–4645.
Chai Y J, Li Y, Chen X L, Zhang J, Christie P, Lai Chow K, Ai C, Shan S D. 2019. Potential sources and associated risk assessment of potentially toxic elements in paddy soils of a combined urban and rural area., 26(23): 23615–23624.
Chowdhury M T A, Deacon C M, Jones G D, Imamul Huq S M, Williams P N, Manzurul Hoque A M, Winkel L H E, Price A H, Norton G J, Meharg A A. 2017. Arsenic in Bangladeshi soils related to physiographic region, paddy management, and mirco- and macro-elemental status., 590/591: 406–415.
Cocks L R M, Fortey R A, Lee C P. 2005. A review of Lower and Middle Palaeozoic biostratigraphy in west peninsular Malaysia and southern Thailand in its context within the Sibumasu Terrane., 24(6): 703–717.
Department of Environment Malaysia. 2009. Contaminated land management and control guidelines No. 1: Malaysian recommended site screening levels for contaminated land. Department of Environment Malaysia. [2019-8-1]. https://www.doe.gov.my/portalv1/wp-content/uploads/Contaminated-Land-Management-and-Control-Guidelines-No-1_Malaysian-Recommended-Site-Screening-Levels-for-Contaminated-Land.pdf.
Di Paola-Naranjo R D, Baroni M V, Podio N S, Rubinstein H R, Fabani M P, Badini R G, Inga M, Ostera H A, Cagnoni M, Gallegos E, Gautier E, Peral-García P, Hoogewerff J, Wunderlin D A. 2011. Fingerprints for main varieties of Argentinean wines: Terroir differentiation by inorganic, organic, and stable isotopic analyses coupled to chemometrics., 59(14): 7854–7865.
Domingo L E, Kyuma K. 1983. Trace elements in tropical Asian paddy soils., 29(4): 439–452.
FAO. 1972. FAO Soil Bulletin 17: Trace elements in soils and agriculture. Rome.
Fu Y R, Chen M L, Bi X Y, He Y S, Ren L M, Xiang W, Qiao S Y, Yan S, Li Z G, Ma Z D. 2011. Occurrence of arsenic in brown rice and its relationship to soil properties from Hainan Island, China., 159(7): 1757–1762.
Griboff J, Baroni M V, Horacek M, Wunderlin D A, Monferran M V. 2019. Multielemental + isotopic fingerprint enables linking soil, water, forage and milk composition, assessing the geographical origin of Argentinean milk., 283: 549–558.
Hammer Ø, Harper D A T, Ryan P D. 2001. PAST: Paleontological statistics software package for education and data analysis., 4: 1–9.
Hang X S, Wang H Y, Zhou J M, Ma C L, Du C W, Chen X Q. 2009. Risk assessment of potentially toxic element pollution in soils and rice () in a typical area of the Yangtze River Delta., 157: 2542–2549.
Harun N S, Hanafiah M M, Nizam N U M, Rasool A. 2020. Water and soil physicochemical characteristics of different rice cultivation areas., 18(5): 6775–6791.
Hashim M M, Yusop M K, Othman R, Wahid S A. 2015. Characterization of nitrogen uptake pattern in Malaysian rice MR219 at different growth stages using15N isotope., 22(5): 250–254.
Hossain M B, Jahiruddin M, Panaullah G M, Loeppert R H, Islam M R, Duxbury J M. 2008. Spatial variability of arsenic concentration in soils and plants, and its relationship with iron, manganese and phosphorus., 156(3): 739–744.
Huang H B, Lin C Q, Yu R L, Yan Y, Hua G R, Wang Q. 2019. Spatial distribution and source appointment of rare earth elements in paddy soils of Jiulong River Basin, Southeast China., 200: 213–220.
Huang Y, Wang L Y, Wang W J, Li T Q, He Z L, Yang X E. 2019. Current status of agricultural soil pollution by heavy metals in China: A meta-analysis., 651: 3034–3042.
Jamil H, Theng L P, Jusoh K, Razali A M, Ali F B, Ismail B S. 2011. Speciation of heavy metals in paddy soils from selected areas in Kedah and Penang, Malaysia. ,10(62): 13505–13513.
Kabata-Pendias A. 2013. Trace Elements in Soils and Plants. 4th edn. Boca Raton: CRC Press.
Kato L S, De Nadai Fernandes E A, Bacchi M A, Sarriés G A. 2018. Elemental composition of Brazilian rice grains from different cultivars and origins., 318(1): 745–751.
Kawaguchi K, Kyuma K. 1974a. Paddy soils in Tropical Asia: Part 1. Description of fertility characteristics., 12(1): 3–24.
Kawaguchi K, Kyuma K. 1974b. Paddy soils in Tropical Asia: Part 2. Description of material characteristics., 12(2): 177–192.
Kelly S, Baxter M, Chapman S, Rhodes C, Dennis J, Brereton P. 2002. The application of isotopic and elemental analysis to determine the geographical origin of premium long grain rice., 214(1): 72–78.
Khairiah J, Habibah H J, Anizan I, Maimon A, Aminah A, Ismail B S. 2009. Content of heavy metals in soil collected from selected paddy cultivation areas in Kedah and Perlis, Malaysia., 5(12): 2179–2188.
Khairiah J, Ramlee A R, Jamil H, Ismail Z, Ismail B S. 2013. Heavy metal content of paddy plants in Langkawi, Kedah, Malaysia., 7(2): 123–127.
Kong X Y, Liu T, Yu Z H, Chen Z, Lei D, Wang Z W, Zhang H, Li Q H, Zhang S S. 2018. Heavy metal bioaccumulation in rice from a high geological background area in Guizhou Province, China., 15(10): 2281.
Kongsri S, Sricharoen P, Limchoowong N, Kukusamude C. 2021. Tracing the geographical origin of Thai Hom Mali rice in three contiguous provinces of Thailand using stable isotopic and elemental markers combined with multivariate analysis., 10(10): 2349.
Kukusamude C, Kongsri S. 2018. Elemental and isotopic profiling of Thai jasmine rice (Khao Dawk Mali 105) for discrimination of geographical origins in Thung Kula Rong Hai area, Thailand., 91: 357–364.
Kyuma K, Kawaguchi K. 1973. A method of fertility evaluation for paddy soils: I. First approximation: Chemical potentiality grading., 19(1): 1–9.
Lagad R A, Dasari K B, Alamelu D, Acharya R, Aggarwal S K. 2014. Evaluation of soil to tea plant elemental correlation using instrumental neutron activation analysis., 302(3): 1507–1512.
Lagad R A, Singh S K, Rai V K. 2017. Rare earth elements and87Sr/86Sr isotopic characterization of Indian Basmati rice as potential tool for its geographical authenticity., 217: 254–265.
Li X X, Yu M, Ma J, Luo Z B, Chen F, Yang Y J. 2018. Identifying the relationship between soil properties and rice growth for improving consolidated land in the Yangtze River Delta, China., 10(9): 3072.
Liu H Y, Wei Y M, Zhang Y Q, Wei S, Zhang S S, Guo B L. 2017. The effectiveness of multi-element fingerprints for identifying the geographical origin of wheat., 52(4): 1018–1025.
Liu Z, Zhang Y Z, Zhang Y, Yang G L, Shao S Z, Nie J, Yuan Y W, Rogers K M. 2019. Influence of leaf age, species and soil depth on the authenticity and geographical origin assignment of green tea., 33(7): 625–634.
Mohamed Z, Terano R, Shamsudin M N, Abd Latif I. 2016. Paddy farmers’ sustainability practices in granary areas in Malaysia., 5(2): 17.
Mu T T, Wu T Z, Zhou T, Li Z, Ouyang Y N, Jiang J P, Zhu D, Hou J Y, Wang Z Y, Luo Y M, Christie P, Wu L H. 2019. Geographical variation in arsenic, cadmium, and lead of soils and rice in the major rice producing regions of China., 677: 373–381.
Payus C, Talip A F A, Hsiang T W. 2015. Heavy metals accumulation in paddy cultivation area of Kompipinan, Papar district, Sabah., 10(1): 76–86.
Podio N S, Baroni M V, Badini R G, Inga M, Ostera H A, Cagnoni M, Gautier E A, García P P, Hoogewerff J, Wunderlin D A. 2013. Elemental and isotopic fingerprint of Argentinean wheat. Matching soil, water, and crop composition to differentiate provenance., 61(16): 3763–3773.
Qian L L, Zuo F, Liu H Y, Zhang C D, Chi X X, Zhang D J. 2019a. Determination of geographical origin of Wuchang rice with the geographical indicator by multielement analysis., 2019: 1–7.
Qian L L, Zhang C D, Zuo F, Zheng L N, Li D, Zhang A W, Zhang D J. 2019b. Effects of fertilizers and pesticides on the mineral elements used for the geographical origin traceability of rice., 83: 103276.
Rendana M, Idris W M R, Rahim S A, Ali Rahman Z, Lihan T, Jamil H. 2019. Field investigation of soil organic carbon and soil respiration rate from paddy cultivation area of Alor Senibong Kedah, Malaysia., 2111(1): 060021.
Salim N A A, Hamzah M S, Elias M S, Siong W B, Rahman S A, Hashim A, Shukor S A. 2013. Instrumental neutron activation analysis of marine sediment in-house reference material., 10(1): 1–7.
Salim N A A, Mostapa R, Othman Z, Daud N M, Harun A R, Mohamed F. 2020. Geographical identification of‘MR220CL’ from Peninsular Malaysia using elemental and isotopic profiling., 110: 106967.
Satpathy D, Reddy M V, Dhal S P. 2014. Risk assessment of heavy metals contamination in paddy soil, plants, and grains (L.) at the east coast of India., 2014: 545473.
Sebastian A, Prasad M N V. 2015. Trace element management in rice., 5(3): 374–404.
Seeprasert P, Anurakpongsatorn P, Laoharojanaphand S, Busamongkol A. 2017. Instrumental neutron activation analysis to determine inorganic elements in paddy soil and rice and evaluate bioconcentration factors in rice., 51(3): 154–157.
Shamshuddin J, Panhwar Q A, Shazana M A R S, Elisa A A, Fauziah C I, Naher U A. 2016. Improving the productivity of acid sulfate soils for rice cultivation using limestone, basalt, organic fertilizer and/or their combinations., 45(3): 383–392.
Shen S G, Xia L Y, Xiong N, Liu Z H, Sun H W. 2013. Determination of the geographic origin of rice by element fingerprints and correlation analyses with the soil of origin., 5(21): 6177–6185.
Sun H W, Xia L Y, Liang S Z, Shen S G. 2014. The correlation of inorganic anion contents in rice and its soils based on four geographical origin., 7(9): 1791–1797.
Tsukada H, Hasegawa H, Takeda A, Hisamatsu S. 2007. Concentrations of major and trace elements in polished rice and paddy soils collected in Aomori, Japan., 273(1): 199–203.
Tsukada H, Takeda A. 2008. Concentration of chlorine in rice plant components., 278(2): 387–390.
Wada K, Kakuto Y, Yamada Y, Vacharotayan S. 1981. Clay mineralogy of paddy soils in Thailand and Malaysia., 25(4): 223–239.
Wang Z J, Erasmus S W, Dekker P, Guo B L, Stoorvogel J J, van Ruth S M. 2020. Linking growing conditions to stable isotope ratios and elemental compositions ofRican bananas (spp.)., 129: 108882.
Wu W, Roberts S L L, Armitage J R, Tooke P, Cordingley H C, Wildsmith S E. 2003. Validation of consensus between proteomic and clinical chemistry datasets by applying a new randomisation F-test for generalised Procrustes analysis., 490(1/2): 365–378.
Yamada Y. 1968. Occurrence of bromine in plants and soil., 15(11): 1135–1141.
Ying H S, Wasli M E B, Perumal M. 2018. Soil characteristics under intensified shifting cultivation for upland rice cultivation in upland Sabal, Sarawak, Malaysia., 25(1): 72–83.
Yoshida S. 1981. Fundamentals of Rice Crop Science. Los Baños, Laguna, the Philippines: International Rice Research Institute: 269.
Yuita K. 1983. Iodine, bromine and chlorine contents in soils and plants of Japan:III Iodine, bromine and chlorine contents in the andosols and in plants of Central Honshu., 29(4): 403–428.
Yuita K, Nobusawa Y, Shibuya M, Aso S. 1982a. Iodine, bromine and chlorine contents in soils and plants of Japan:I Iodine, bromine and chlorine contents in soils and plants of the basin of the Miomote River., 28(3): 315–336.
Yuita K, Akabe S, Shibuya M, Aso S. 1982b. Iodine bromine and chlorine contents in solls and plants of Japan:II Iodine, bromine and chlorine contents in soils and plants of the basin of the Nagara River., 28(4): 499–515.
Zarcinas B A, Ishak C F, McLaughlin M J, Cozens G. 2004. Heavy metals in soils and crops in Southeast Asia: 1. Peninsular Malaysia., 26(4): 343–357.
Zhao H Y, Guo B L, Wei Y M, Zhang B. 2013. Multi-element composition of wheat grain and provenance soil and their potentialities as fingerprints of geographical origin., 57(3): 391–397.
Zhang C M, Tanaka N, Dwiyanti M, Shenton M, Maruyama H, Shinano T, Chu Q N, Xie J, Watanabe T. 2022. Ionomic profiling of rice genotypes and identification of varieties with elemental covariation effects., 29(): 76–88.
Zheng R L, Sun G X, Zhu Y G. 2013. Effects of microbial processes on the fate of arsenic in paddy soil., 58(2): 186–193.
Zinicovscaia I, Duliu O G, Culicov O A, Sturza R, Bilici C, Gundorina S. 2017. Geographical origin identification of Moldavian wines by neutron activation analysis., 10(11): 3523–3530.
Zulkafflee N S, Mohd Redzuan N A, Hanafi Z, Selamat J, Ismail M R, Praveena S M, Abdull Razis A F. 2019. Heavy metal in paddy soil and its bioavailability in rice usingdigestion model for health risk assessment., 16(23): 4769.
Copyright © 2023, China National Rice Research Institute. Hosting by Elsevier B V
This is an open access article under the CC BY-NC-ND license (http://creativecommons.org/licenses/by-nc-nd/4.0/)
Peer review under responsibility of China National Rice Research Institute
http://dx.doi.org/10.1016/j.rsci.2023.04.004
1 November 2022;
23 April 2023
Norlida Mat Daud(norlida.daud@ukm.edu.my)
(Managing Editor: Fang Hongmin)
- Rice Science的其它文章
- Water Extract of Rice False Smut Balls Activates Nrf2/HO-1 and Apoptosis Pathways, Causing Liver Injury
- Effect of GW8 Gene Editing on Appearance Quality of Erect-Panicle Type (dep1) Japonica Rice
- Transcriptome Analysis of oserf922 Mutants Reveals New Insights into Rice Blast Resistance
- ORYZA SATIVA SPOTTED-LEAF 41 (OsSPL41) Negatively Regulates Plant Immunity in Rice
- LHD3 Encoding a J-Domain Protein Controls Heading Date in Rice
- Effects of Zinc Oxide Particles with Different Sizes on Root Development in Oryza sativa