
Dietary Exposure to Benzyl Butyl Phthalate in China*
2016-08-15 03:25ZHANGLeiJIANGDingGuoSUIHaiXiaWUPingGuLIUAiDongYANGDaJinLIUZhaoPingSONGYanandLINingKeyLaboratoryofFoodSafetyRiskAssessmentNationalHealthandFamilyPlanningCommissionofthePeopleRepublicofChinaChinaNationalCenterf
ZHANG Lei, JIANG Ding Guo, SUI Hai Xia, WU Ping Gu, LIU Ai Dong,YANG Da Jin, LIU Zhao Ping, SONG Yan,#, and LI Ning. Key Laboratory of Food Safety Risk Assessment, National Health and Family Planning Commission of the People's Republic of China (China National Center for Food Safety Risk Assessment), Beijing 000, China; . Zhejiang Provincial Center for Disease Control and Prevention, Hangzhou 3005, Zhejiang, China
Original Article
Dietary Exposure to Benzyl Butyl Phthalate in China*
ZHANG Lei1, JIANG Ding Guo1, SUI Hai Xia1, WU Ping Gu2, LIU Ai Dong1,YANG Da Jin1, LIU Zhao Ping1, SONG Yan1,#, and LI Ning1
1. Key Laboratory of Food Safety Risk Assessment, National Health and Family Planning Commission of the People's Republic of China (China National Center for Food Safety Risk Assessment), Beijing 100022, China; 2. Zhejiang Provincial Center for Disease Control and Prevention, Hangzhou 310051, Zhejiang, China
Abstract
Objective Benzyl butyl phthalate (BBP) is a plasticizer used in food contact materials. Dietary exposure to BBP might lead to reproduction and developmental damages to human. The present paper was aimed to assess the health risk of BBP dietary exposure in Chinese population.
Methods The BBP contents were detected in 7409 food samples from 25 food categories by gas chromatography-mass spectrometry operated in selected ion monitoring (SIM) mode. The dietary exposures of BBP in different age and sex groups were estimated by combining the content data with food consumption data derived from 2002 China National Nutrient and Health Survey, and evaluated according to the tolerable daily intake (TDI) of BBP established by European Food safety Agency.
Results It was found that BBP was undetectable in most samples and the highest level was 1.69 mg/kg detected in a vegetable oil sample. The average dietary exposure of BBP in people aged ≥2 years was 1.03 µg/kg bw per day and the highest average exposure was found in 2-6 years old children (1.98 µg/kg bw per day). The BBP exposure in 7-12 months old children excessed 10% of tolerable daily intake (TDI) in worst scenario.
Conclusion The health risk of BBP dietary exposure in Chinese population is low and, considering BBP alone, there is no safety concern.
Benzyl butyl phthalate; Dietary exposure; Risk assessment; China
www.besjournal.com (full text) CN: 11-2816/Q Copyright ©2016 by China CDC
INTRODUCTION
Benzyl butyl phthalate (BBP) is an ester of phthalic acid, benzyl alcohol and n-butanol, mainly used as plasticizer in polyvinyl chloride and other polymers used in adhesives, paints and pigments[1-2]. Its largest use is in vinyl tiles. BBP is also present in food conveyor belts, artificial leather, toy and food packaging[1,3]. As a plasticizer, BBP is not tightly bound to plastic, and tends to leach from plastic products to the environment. It has been found in food, water, air,and soil[2,4]. Human could expose to BBP through oral,inhalation and skin contact.
Studies in rat and mice have shown that BBP might have reproduction and developmental toxicity[4-8]. These effects have been also observed in several human studies[9-12]. Generally, males are more susceptible than females to adverse developmental effects on the reproductive tract. Young children are considered a potentially susceptible population[13]. Recent epidemiologicalstudies suggested childhood exposure to BBP might increase the risk of allergic diseases, such as asthma and eczema[14]. There is no sufficient evidence to suggest the genotoxic and carcinogenic effects of BBP in animals and human[15-16].
Several tolerable dietary intakes (TDI) have been estabilished based on different toxicological end-points in experimental animals. In 1988, the United States Environmental Protection Agency (USEPA) established a TDI of 0.2 mg/kg bw per day based on a significant increase of liver-body ratio and liver-brain ratio of rat with the no-observed-adverse-effect-level (NOAEL) of 159 mg/kg bw and an uncertainty factor of 1000[17]. In 1995, the European Commission's Scientific Committee on Food (SCF) set a temporary TDI of 0.1 mg/kg bw per day based on the end-point of peroxisome proliferation in rodent liver[18]. However,the international agency for research on cancer (IARC) has reported that liver peroxisome proliferation in rodents is not relevant for human risk assessment[19]. Based on the scientific consensus and newly available toxicological evidence, the European Food Safety Authority (EFSA) concluded that the effects on reproduction and development are the most sensitive end-points for assessing of the effect of BBP through dietary exposure. Based on testicular toxicity and on the presence of reduced anogenital distance (AGD) in F1 and F2 males at birth,EFSA set a TDI of 0.5 mg/kg bw per day in 2005,derived from a NOAEL of 50 mg/kg bw with an uncertainty factor of 100[8,20].
Although humans may be exposed to BBP through the oral, inhalation and dermal routes, food is still the most important source of BBP exposure[3,20]. As the biggest producer and consumer in the world, China is also facing the environmental and food contamination of BBP[21-23]. However, there has been no comprehensive study on the content levels of BBP in most food categories and dietary BBP exposure in the Chinese population. This paper reports the contents of BBP in food (including drinking water) and age/sex specific dietary exposure levels in the Chinese population.
MATERIALS AND METHODS
BBP Contents of Food
Food samples in 25 food categories, including rice, wheat flour, leafy vegetable, cucurbit & fruiting vegetable, root & stalk vegetable, livestock, poultry, packaged meat products, freshwater fish, seawater fish, shrimp, egg, fruit, milk, instant noodle,seasoning oil for instant noodle, soft drink, drinking water, distilled spirit, yellow wine, vegetable oil, jelly,jam, infant formula and child food, were collected from supermarkets and local markets in all of 31 provinces, autonomous regions and municipalities of China from 2012 to 2013. The total sample size was 7409, and the sample size in each province, or autonomous region and municipality ranged from 30 to 1114. All the samples were collected by using glass containers and segregated from plastic materials to avoid contamination with phthalates.
Food samples of vegetable oil, soft drink, alcohol,drinking water, jam and jelly were analyzed according to China national standard (GB/T 21911-2008: Determination of phthalate esters in foods)[24]. Other food samples were also analyzed according to China national standard (GB/T 21911-2008) with minor modifications developed by an expert committee on the analysis of phthalate acid esters[25]. In brief, about 0.4-2.0 g samples were spiked with deuterated phthalates and homogenized. BBP in fat free food samples, such as soft drink,alcohol and drinking water, were extracted with n-hexane and centrifuged at 4000 rpm for 5 min. BBP in vegetable oil was extracted with ethyl acetate:cyclohexane (1:1) and were cleaned up by using gel permeation chromatography system. Other food samples were added with petroleum ether for the extraction of fat first, then the fat were extracted with acetonitrile and cleaned up by using silica/PSA -mixed SPE. After concentration, the extracts were analyzed with gas chromatography-mass spectrometry (GC-MS) fitted with DB-5ms capillary column (30 m long, 0.25 mm in diameter, and with a 0.25 µm film thickness) and operated in selected ion monitoring (SIM) mode.
In the analysis, special attention was paid to sources of contamination. All laboratory glassware was washed carefully and heated at 300 °C or rinsed with redistilled n-hexane before use. Blank test sample were analyzed following same procedure for each batch of samples. Only when the BBP content of the blank sample was lower than 0.02 mg/kg (conversion according sample weight), the analysis results were accepted. To ensure the accuracy of analysis, a recovery test sample spiked with 0.2 mg/kg BBP were analyzed for each batch of samples and the recovery should be in 70%-120%. All the data were vertified by an expert panel of analysts before the use for exposure estimation.
The limits of detection(LOD)of BBP were 0.01‐0.3 mg/kg for instant noodle,0.01‐0.5 mg/kg for vegetable oil and soft drink,0.001 mg/kg for drinking water,0.007‐0.1 mg/kg for egg and fruit,0.01‐0.2 for jelly and jam,0.01‐0.1 mg/kg for aquatic products,milk,alcohol,and 0.03‐0.1 mg/kg for other food categories.All the samples with results below the LOD were assigned a value equal to LOD by following the approach recommended by the World HealthOrganisation'sglobalenvironment monitoring system-food contamination monitoring and assessment programme(GEMS/Food)[26].
Food Consumption Data
Food consumption data of Chinese aged≥2 years were sourced from Chinese National Nutrition and Health Survey(CNNHS)conducted by former National Institute for Nutrition and Food safety in 2002.In that survey,a total of 68,959 study subjects were selected through stratified multi‐stage cluster sampling from 31 provinces,autonomous regions,and municipalities in China.Food consumption data of every subject were collected with 24 h dietary recall method in 3 consecutive days.In this study,the consumption of individual food was classified into corresponding food categories and summed up tomatchtheBBPcontaminationdata.Daily consumption data for every food category in general population are shown in Table 1(raw data is not published).The consumption data of seasoning oil for instant noodle was assigned a unit package weight of 10 g.
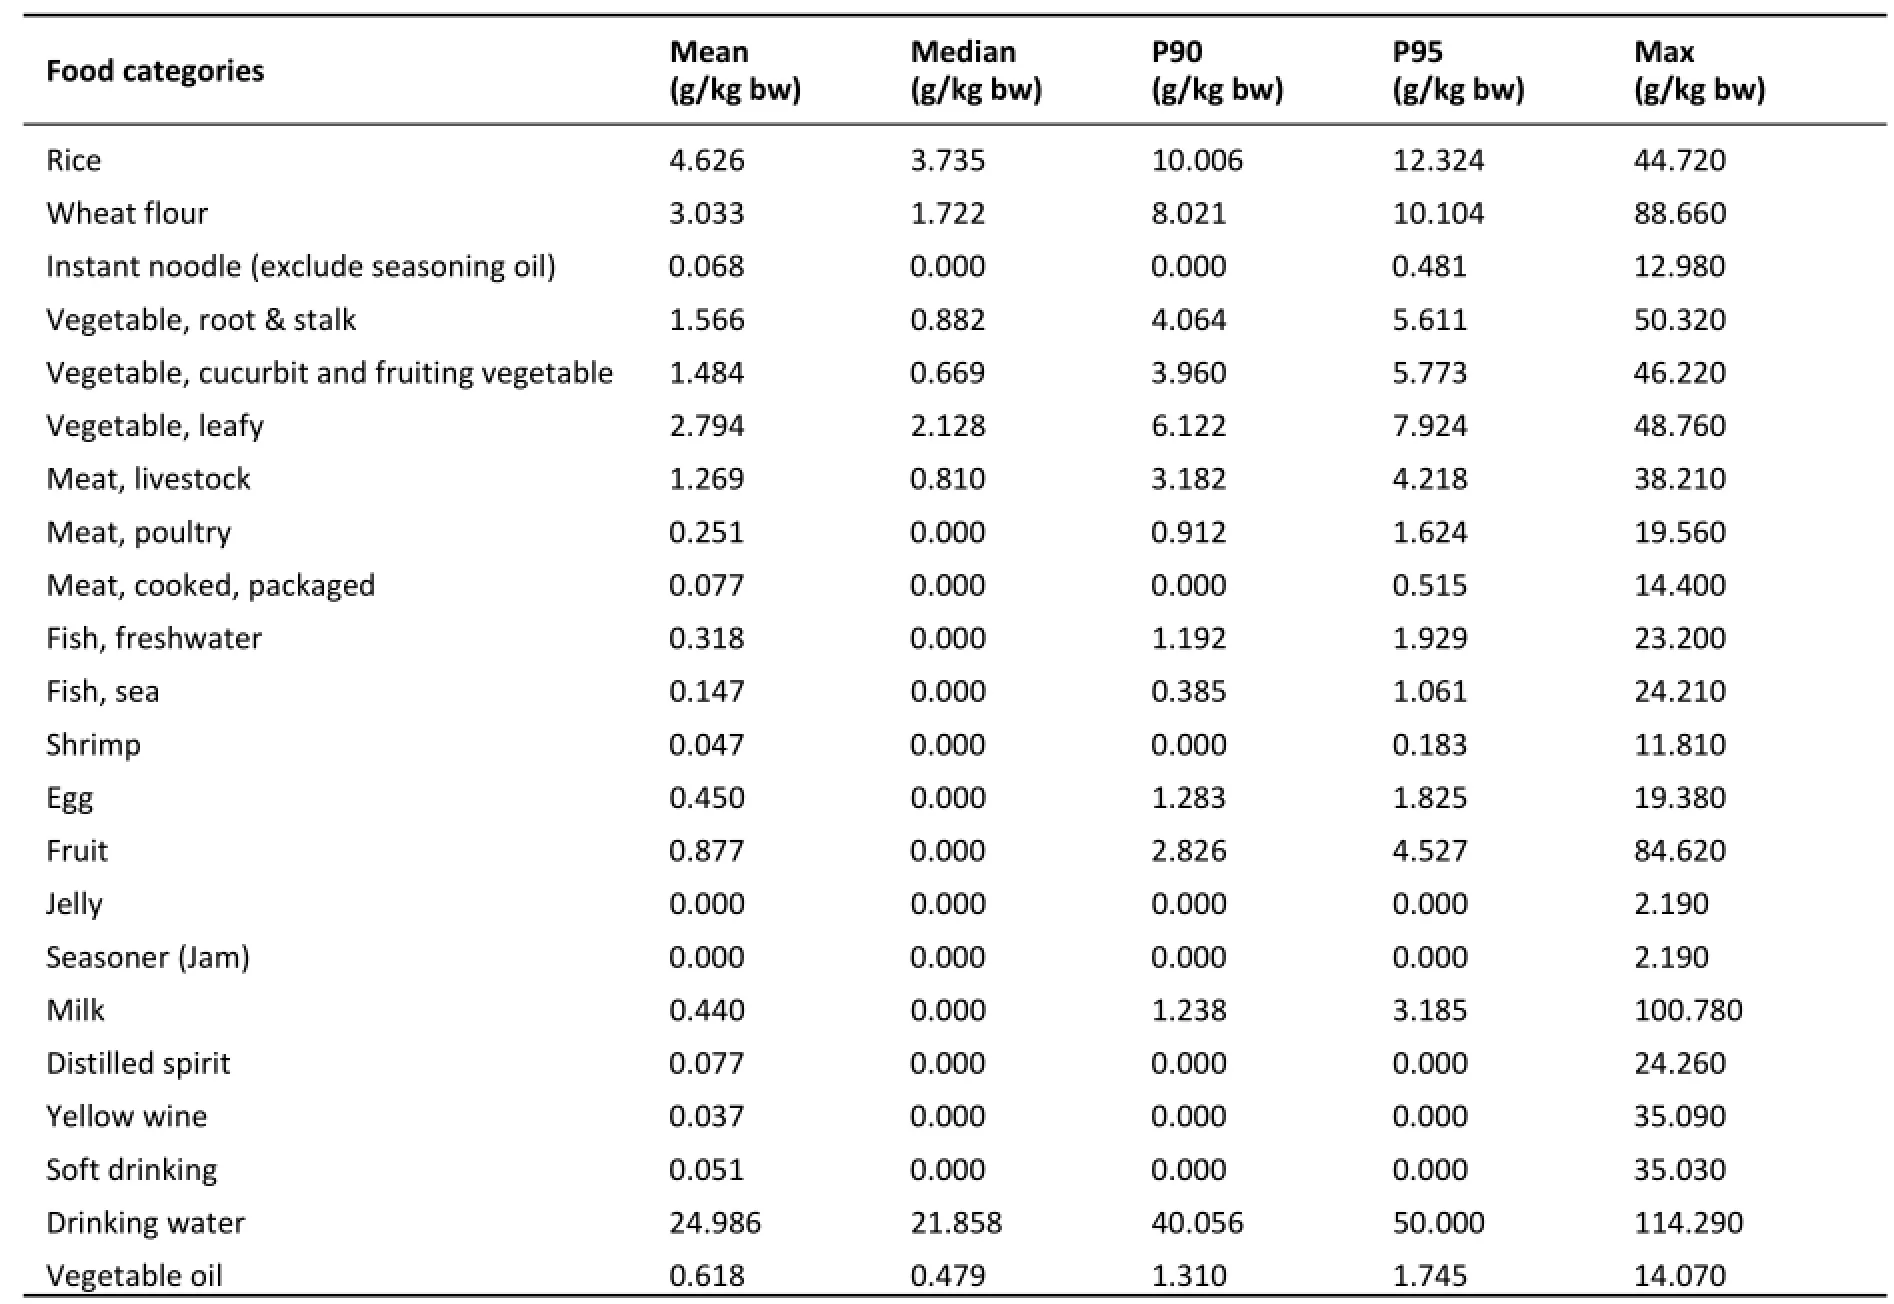
Table 1.Daily Food Consumption of General Population in China(≥2 years of age)
To estimate the BBP exposure in infants and toddlers aged 0‐24 months through infant formula and child food,the maximum intakes of infant formula and child food recommended by major food manufactures in markets in China were used,i.e.the daily consumption of infant formulae were 27.0 g/kg bw,20.0 g/kg bw and 13.2 g/kg bw for 0‐6 months old infants,7‐12 months old toddlers and 13‐24 monthsoldtoddlers,respectively.Thedaily consumption of child food was 17.3 g/kg bw and 18.0 g/kg bw for 7‐12 months old toddlers and 13‐24 months old toddlers,respectively.
Estimation of Dietary BBP Exposure
The daily BBP exposure of each subject in 2002 CNNHS was calculated according to the following formula:
WhereExpidenotesBBPdietaryexposureof consumeri(μg/kgbwperday);Fjdenotes consumption amount of consumer i from food category j(g/day);Cjdenotes content of BBP in food category j(mg/kg);Wirefers to body weight of consumer i(kg);n refers to the number of food categories used to derived Expifor consumer i.
The BBP exposures from all the food categories were summed up to obtain the total BBP exposure for each of the 68,959 study subjects.Then the mean,median and 95th percentile exposures of BBP were statistically derived for whole study population and sub‐population groups.The population was divided into eight age and sex sub‐groups,i.e. children(2‐6 years),adolescent(7‐12 years),young people(13‐17 years,male and female),adults(18‐59 years,male and female)and adults(≥60 years,male and female).
As for the BBP exposures in infants and toddlers via infant formula and child food,simple point estimations were conducted by multiplying the recommended maximum intakes per body weight of infant formula or child food with the corresponding BBP content.Two exposure case scenarios were assumed:general case scenario and worst case scenario.For the general case scenario,mean levels of BBP in infant formula and child food were used.In the worst case scenario,the maximum levels of BBP were used.
The health risk of BBP exposure for different population groups were assessed by comparing the exposure with the TDI of 0.5 mg/kg bw,i.e.500 µg/kgbw[20].

Table 2.BBP Contents in Foods
RESULTS
BBP Contents in Foods
As shown in Table 2,the levels of BBP in most food categories were undetectable except egg.BBPwas detected in 17% of egg samples. The average content of BBP in all the food samples was 0.06 mg/kg. Except instant noodle (including its seasoning oil) and infant formula, the levels of BBP in all the food categories sampled were lower than 0.10 mg/kg. The highest mean level of BBP among the 25 food categories was found to be 0.20 mg/kg in seasoning oil in instant noodle packages. The mean BBP contents of instant noodle and infant formula were slightly higher than 0.10 mg/kg. The highest individual level of BBP was found in a vegetable oil sample at 1.69 mg/kg, followed by a child food sample (1.50 mg/kg), and an infant formula sample (1.26 mg/kg).
BBP Exposure in Different Age and Sex Groups
The mean dietary BBP exposure level in Chinese aged ≥2 years was estimated to be 1.03 µg/kg bw/day, equivalent to 0.21% of the TDI (Table 3). The maximum dietary exposure to BBP in Chinese aged ≥ 2 years was estimated to be 10.10 µg/kg bw per day. This represents 2.02% of the TDI. Dietary exposure to BBP decreased with age in different sub groups. The highest mean dietary exposure was found to be 1.98 µg/kg bw per day in 2-6 years old children,representing approximately 0.40% of the TDI. Data presented in Table 3 indicate that no dietary BBP exposure level >500 µg/kg bw (TDI) was observed in all the age and sex sub groups.
Dietary exposures to BBP in infants and toddlers via infant formula and child food are shown in Figure 1. In both general case scenario and worst case scenario, the dietary exposures to BBP were all well below the TDI. Dietary exposure to BBP via infant formula declined with age. However, when taking into consideration of the additional exposure from consumption of child food after age of 6 months,dietary BBP exposure level in 7-12 months old children was higher than the other two groups and exceeded 10% of TDI in the worst case scenario.

Table 3. Dietary BBP Exposure in Different Age and Sex Groups (≥2 years of age)
Food Contribution to BBP Intake
For the Chinese aged ≥2 years, rice and wheat flour were the first two most important sources to the dietary exposure to BBP, ranging from 24.8% to 28.7% and from 13.1% to 16.8%, respectively,
in different age and sex sub-groups (Table 4). For people aged ≥7 years, leafy vegetable was the third most important source to dietary BBP exposure. For the children aged 2-6 years, instant noodle, including seasoning oil, caused more dietary exposure to BBP than leafy vegetable. The contribution of milk to dietary BBP exposure in the 2-6 years old children was significantly higher than that in other sub-groups. In addition, the contribution of distilled spirit and yellow wine in the male adults was significantly higher than that in other sub-groups.

Table 4. Food Contributions to BBP Exposure in Different Age and Sex Groups (≥2 years of age)
DISCUSSION
The results showed that dietary exposure to BBP in Chinese was well below the TDI of 0.5 mg/kg bw per day, suggesting that the risk of dietary exposure to BBP for Chinese is low. Although BBP might co-exist with other phthalates, there is still lack of authorized method to evaluate their cumulative risk. Therefore, considering BBP exposure alone, there is no safety concern. Further researches on the cumulative effect of BBP with other phthalates are necessary.
Studies have shown that BBP in foods might migrate from packaging material or be from environment[2]. Because BBP is fat soluable, fat-rich foods tend to contain more BBP, especially when these foods are packaged with plastic materials in which BBP is used as plasticizer. Our results and another survey in China[27]also show this regularity. The highest mean BBP content was found in seasoning oil for instant noodle and the maximum individual level of BBP was found in vegetable oil samples, which are usually packaged in plastic container. Further evidences are needed to confirm that the BBP in highly contamined samples are mainly from packaging materials. The BBP contents in infant formula and child food found in this study were higher than results from most of other studies. In this study, the mean and maximum BBP contents for infant formula were 0.11 mg/kg and 1.26 mg/kg,respectively, and 0.09 mg/kg and 1.5 mg/kg for child food. Meanwhile, BBP levels found in other studies ranged from <0.004 to 0.001 mg/kg (infant formula)and 0.005 mg/kg (child food), but in the range of <0.004-0.25 mg/kg for infant formula reported by MAFF in 1996[28].
Rice, wheat flour and vegetable are the three most important food contributors to BBP exposure for the general population in China. Considering the BBP in most samples are undetectable, the differences in contribution among these food categories are mainly due to their relatively higher food consumption. It is notable that instant noodle is an important exposure source in 2-12 years old children and teenagers partly due to the higher BBP contents in instant noodle and its seasoning oil.
The mean exposure to BBP in 18-59 years old adults observed in this study was 0.91 µg/kg bw per day, which was significantly higher than that reported by another study in China. In that study,the dietary exposure to BBP for Chinese adults was estimated to be 0.022 µg/kg bw per day based on the analysis of 78 food samples of 8 food categories collected from two cities in China[29]. Moreover,the content below limit of quantitation (LOQ) was assigned a value of zero in that study, which was significantly different from our study and most of other studies[20,30-31], and might lead to underestimate of BBP exposure.
In comparison with values of dietary exposure to BBP reported in studies in foreign countries, the dietary BBP exposure in Chinese adults (18-59 years of age) was lower than the estimate of 2.0 µg/kg bw per day in a Canadian survey of 100 food items purchased in supermarkets between 1985 and 1988[1], and also lower than an estimate of 11.98 to 29.19 µg/kg bw per day in a survey conducted in India[32]. Meanwhile, our findings were similar to the estimate of dietary exposure to BBP at 0.97 µg/kg bw per day reported by a Danish study based on estimated levels of BBP in various foodstuffs[33]. In an earlier Danish study[34], however, a lower dietary exposure level of 0.29 to 0.43 µg/kg bw per day in adults was estimated. Some other European countries also reported lower dietary exposures. For example, mean and 97.5thpercentile BBP exposures were reported to be at 0.1 and 0.3 µg/kg bw per day respectively in British adults in 1993. An upper bound value of 0.5 µg/kg bw per day of the 97.5thpercentile of dietary exposure has been found in a 2007 UK total diet study based on BBP levels in 20 common foodstuffs[20,35-36]. A median dietary exposure to BBP of 0.06 µg/kg bw per day was estimated in Belgian adults (≥15 years old) based on the BBP content of over 550 food products sold in Belgian markets[31]. A study in the urban center of Paris reported a dietary exposure to BBP of 0.164 µg/kg bw per day in French adults[37].
There are also some studies of daily exposure to BBP by analyzing human urinary metabolite data[38]. These studies estimated that the mean or median exposure levels to BBP in adults were 0.093, 0.26,0.5-0.7 and 0.88 µg/kg bw per day in Japan,Germany, Danmark and USA, respectively[39-42]. A study in Gemany indicated that the median level of exposure to BBP in 2-14 years old children were 0.42 (0.06-13.9) µg/kg bw per day or 0.77 (0.05-31.3)µg/kg bw per day based on two different models[43]. A recent survey reported a lower estimate of 0.3 µg/kg bw per day in 5-6 years old children[44]. Other studies reported average daily BBP exposure level of 0.96-0.97 µg/kg bw for 6-10 years Danish children[45]. These results were all lower than that estimated in this study. Studies have shown that food-based indirect estimate of BBP exposure is more similar to biomarker-based estimate[46]. Given that several studies have indicated that food and drinking water are the most important sources of human exposure to phthalates, and dietary exposure is more predictive of the total exposure to BBP[20,33,39], these results derived from urinary data, to a certain extent,are comparable to estimates via combining food consumption with BBP residue levels in food.
Many factors might influence the comparison among BBP exposure studies, including the number of foods involved, food consumption pattern, exposure estimation method, assessment strategy and so on. But it can be found from studies mentioned above that BBP dietary exposure level in general population in different countries worldwide were usually below 1.0 µg/kg bw per day (0.2% of TDI) except a study in India and earlier study in Canada. The BBP exposure level in Chinese was about 1.0 µg/kg bw per day for different age and sex groups.
Infants and toddlers are considered to have much higher BBP intakes because of their relatively higher food requirements per unit body mass. They are prone to be affected by the exposure to BBP because they are in postnatal development stage of life. Based on our estimate, the maximum level of BBP found in infant formula in this survey would lead to dietary BBP exposure levels of 34.02 µg/kg bw per day (worst case scenario) in 0-6 months old infants and 25.20 µg/kg bw per day in 7-12 months old toddlers (Figure 1). These estimates were significantly lower than the TDI, but were higher than those estimated in Europe. EFSA estimated that dietary exposure to BBP through intake of infant formula was 1.6 µg/kg bw per day in infants aged ≤6 months and 0.7 µg/kg bw per day in toddlers aged>6 months based on the maximum levels of BBP (0.01mg/kg) found in 11 infant formula products by a Denmark study[20,34]. The UK Ministry of Agriculture,Fisheries and Food (MAFF) reported that the levels of BBP in infant formula ranged from 0.003 to 0.015 mg/kg, which would result in an average dietary BBP exposure level of 0.2 µg/kg bw per day in newborns and 0.1 µg/kg bw per day in infants aged 6 months[47].
Taking the consumption of child food into account, the overall dietary BBP exposure level in toddlers aged 7-24 months ranged from 43.67 to 51.20 µg/kg bw per day in worst case scenario according to this study. Under the same scenario,EFSA reported an much lower estimated exposure to BBP at level of only 0.9 µg/kg bw per day[21].
There are some uncertainties in this study. For example, certain foods, such as soy bean, was not included in the analysis despite 25 categories of main food consumed by Chinese were surveyed. The absence of certain foods might result in the underestimation of the true dietary exposure to BBP. In addition, the food consumption data were collected more than 10 years ago, and the changes in Chinese dietary pattern due to the rapid development of economy in China were not taken into consideration in this study. All of these might influence the findings of this study. The high undetectable rate of BBP in most food was another important factor influencing study results. When different strategies were applied to deal with the content lower than LOD, the estimate results might be different significantly. In this situation, the value of LOD is used. This strategy was adopted by most of present studies to make relatively ‘safe' assessment of risk (reasonable overestimate). Sometimes, both ‘0' and ‘LOD' were used to obtain an exposure range[20,30-31].
In conclusion, this study found that overall and age/sex specific dietary BBP exposure levels in Chinese were much lower than the TDI. However,the dietary exposure levels to BBP in certain population groups, such as infants and toddlers,were higher than those found in some developed countries. Rice, wheat flour and vegetables were three most important contributors to BBP dietary exposure in general population in China.
AUTHOR CONTRIBUTIONS
ZHANG Lei analyzed the data, conducted the exposure assessment, drafted the manuscript, critically reviewed the manuscript, and approved the final manuscript submitted. SONG Yan conducted exposure assessment, critically reviewed the manuscript, and had primary responsibility for final content. LI Ning and LIU Zhao Ping designed the study, critically reviewed the manuscript, and approved the final manuscript submitted. SUI Haixia,LIU Ai Dong conducted the data analysis and exposure assessment; JIANG Ding guo, WU Ping Gu and YANG Da Jin contribute to the food sample collection and BBP detection. All authors have read and approved the final manuscript.
ACKNOWLEDGE
The authors thank LI Shu Guang, DING Gang Qiang, CHU Xiao Gang, LI Jian Guo, ZHANG Li Shi,CAO Hong, ZHONG Qi Ding and PENG Shao Jie for technical assistance and valuable comments with the survey and data collection. We would like to extend our sincere thanks to all colleagues and participates involved in this projects.
Accepted: April 26, 2016
REFERENCES
1. International Programme on Chemical Safety. Concise international chemical assessment document 17, butyl benzyl phthalate. Geneva: World Health Organization, 1999.
2. European Chemicals Bureau. European Union Risk Assessment report-benzyl butyl phthalate (BBP). 3rd Prioity List. Vol 76. Luxebourg: European Communities, 2007.
3. Kavlock R, Boekelheide K, Chapin R, et al. NTP Center for the Evaluation of Risks to Human Reproduction: phthalates expert panel report on the reproductive and developmental toxicity of butyl benzyl phthalate. Reprod Toxicol, 2002; 16, 453-87.
4. National Industrial Chemicals Notification and Assessment Scheme. Existing Chemical Hazard Assessment Report, 2008. Butyl benzyl Phthalate. 2008. Available: http://www.nicnas. gov.au/_data/assets/pdf_file/0009/4959/BBP-hazard-assessm ent.pdf. [2014-10-30].
5. Kay VR, Chambers C, Foster WG. Reproductive and developmental effects of phthalate diesters in females. Crit Rev Toxicol, 2013; 43, 200-19.
6. Moral R, Wang R, Russo IH, et al. The plasticizer butyl benzyl phthalate induces genomic changes in rat mammary gland after neonatal/prepubertal exposure. BMC Genomics, 2007; 8,453.
7. Aso S, Ehara H, Miyata K, et al. A two-generation reproductive toxicity study of butyl benzyl phthalate in rats. J Tox Sci, 2005;50, 39-58.
8. Tyl RW, Myers CB, Marr MC, et al. Reproductive toxicity evaluation of dietary Butyl Benzyl Phthalate (BBP) in rats. Reproductive Toxicology, 2004; 18, 241-64.
9. Whyatt RM, Liu X, Rauh VA, et al. Maternal prenatal urinary phthalate metabolite concentrations and child mental,psychomotor, and behavioral development at 3 years of age. Environmental health perspectives, 2012; 120, 290-5.
10. Frederiksen H, Sorensen K, Mouritsen A, et al. High urinary phthalate concentration associated with delayed pubarche in girls. Int J Androl, 2012; 35, 216-26.
11. Suzuki Y, Yoshinaga J, Mizumoto Y, et al. Foetal exposure to phthalate esters and anogenital distance in male newborns. International journal of andrology, 2012; 35, 236-44.
12. Swan SH. Environmental phthalate exposure in relation to reproductive outcomes and other health endpoints in humans. Environ Res, 2008; 108, 177-84.
13. McKee RH, Butala JH, David RM, et al. NTP center for the evaluation of risks to human reproduction reports on phthalates: addressing the data gaps. Reprod Toxicol, 2004; 18,1-22.
14. Braun JM, Sathyanarayana S, Hauser R. Phthalate Exposure and Children's Health. Curr Opin Pediatr, 2013; 25, 247-54.
15. Barber ED, Cifone M, Rundell J, et al. Results of the L5178Y mouse lymphoma assay and the Balb/3T3 cell in vitro transformation assay for 8 phthalate esters. J Appl Toxicol,2000; 20, 69-80.
16. Kohno H, Suzuki R, Sugie S, et al. Lack of modifying effects of 4-tert-octylphenol and benzyl butyl phthalate on 3,2'-dimethyl-4-aminobiphenyl-induced prostate carcinogenesis in rats. Cancer Scienc, 2004; 95, 300-5.
17. Environmental Protection Agency. Butyl benzyl phthalate (CASRN 85-68-7). 1988. Available: http://www.epa.gov/iris/ subst/ 0293.htm. [2015-5-15].
18. Scientific Committee for Food. First report of the Scientific Committee for Food on certain additives used in the manufacture of plastic materials intended to come into contact with foodstuffs. Report 33rd serie. 1995.
19. International Agency for Research on Cancer. Peroxisome Proliferation and its role in Carcinogenesis, views and expert opinions of an IARC Working Group Lyon, 7-11 Dec 1994, IARC Technical Report No.24 Lyon. 1995.
20. European Food safety Agency. Opinion of the Scientific Panel on Food Additives Flavourings, Processing Aids and Material in Contact with Food (AFC) on a request from the Commission related to Butylbenzylphthalate (BBP) for use in food contact materials. EFSA J, 2005; 241, 1-14.
21. Huang Y, Lu WW, Chen B, et al. Phthalates in commercial chinese rice wines: concentrations and the cumulative risk assessment to adult males in shanghai. Biomed Environ Sci,2014; 27, 819-23.
22. Ji Y, Wang F, Zhang L, et al. A comprehensive assessment of human exposure to phthalates from environmental media and food in Tianjin, China. J Hazard Mater, 2014; 279, 133-40.
23. Liu X, Shi J, Bo T, et al. Occurrence of phthalic acid esters in source waters: a nationwide survey in China during the period of 2009-2012. Environ Pollut, 2014; 184, 262-70.
24. Standardization Administration of China. Determination of phthalate esters in foods. GB/T 21911-2008. Beijing: The Standardization Administration of China, 2008. (In Chinese)
25. Wu P, Yang D, Zhang L, et al. Simultaneous determination of 17 phthalate esters in edible vegetable oils by GC-MS with silica/PSA-mixed solid-phase extraction. J Sep Sci, 2012; 35,2932-9.
26. World Health Organization. Second workshop on reliable evaluation of low-level contamination of food. Report on a workshop in the frame of GEMS/Food-EURO,GEMS/Food-EURO, World Health Organization Regional Office for Europe, Kulmbach, Rome, 1995.
27. Fan JC, Huang XH, Ren R, et al. Investigation of 20 phthalates esters pollution in foods in Hangzhou. Chin J Health Lab Tec,2014; 24, 1474-6. (In Chinese)
28. Cao XL. Phthalate Esters in Foods: Sources, Occurrence, and Analytical Methods. COMPR REV FOOD SCI F, 2010; 9, 21-43.
29. Guo Y, Zhang Z, Liu L, et al. Occurrence and Profiles of Phthalates in Foodstuffs from China and Their Implications for Human Exposure. J Agric Food Chem, 2012; 60, 6913-9.
30. Huang Y, Lu WW, Chen B, et al. Phthalates in Commercial Chinese Rice Wines: Concentrations and the Cumulative Risk Assessment to Adult Males in Shanghai. Biomed Environ Sci,2014; 27, 819-23.
31. Sioen I, Fierens T, Van Holderbeke M, et al. Phthalates dietary exposure and food sources for Belgian preschool children and adults. Environ int, 2012; 48, 102-8.
32. Das MT, Ghosh P, Thakur IS. Intake estimates of phthalate esters for South Delhi population based on exposure media assessment. Environ Pollut, 2014; 189, 118-25.
33. Müller AK, Nielsen E, Ladefoged O. Human exposure to selected phthalates in Denmark. F?devareRapport 2003; 15. Available:http://www.foedevarestyrelsen.dk/Publikationer/Alle%20publi kationer/2003015.pdf. [2015-5-30]
34. Petersen JH, Breindahl T. Plasticizers in total diet samples,baby food and infant formulae. Food addit contam: Part A,2000; 17, 133-41.
35. Ministry of Agriculture, Fisheries and Food. Survey of plasticiser levels in food contact materials and in foods. Food Surveillance Papers No 21. 1996.
36. Committee on Toxicity of Chemicals in Food, Consumer Products and the Environment. COT statement on dietary exposure to phthalates-data from the total diet study (TDS). 2011. Available: http://cot.food.gov.uk/sites/default/files/ cot/cotstatementphthalates201104.pdf. [2014-12-15]
37. Martine B, Marie-Jeanne T, Cendrine D, et al. Assessment of adult human exposure to phthalate esters in the urban centre of Paris (France). Bull Environ Contam Toxicol, 2013; 90,91-6.
38. Wittassek M, Koch HM, Angerer J, et al. Assessing exposure to phthalates - The human biomonitoring approach. Mol Nutr Food Res, 2011; 55, 7-31.
39. Iton H, Yoshida K, Masunaga S. Quantitative identification of unknown exposure pathways of phthalates based on measuring their metabolites in human urine. Environ Sci Technol, 2007; 41, 4542-7.
40. Wittassek M, Wiesmuller GA, Koch HM, et al. Internal phthalate exposure over the last two decades - a retrospective human biomonitoring study. Int J Hyg Envrion Health, 2007;210, 319-33.
41. Kranich SK, Frederiksen H, Andersson AM, et al. Estimated daily intake and hazard quotients and indices of phthalate diesters for young Danish men. Environ Sci Technol, 2014;48,706-12.
42. Kohn MC, Parham F, Masten SA, et al. Human exposure estimates for phthalates. Environ Health Perspect, 2000; 108,A440-2.
43. Koch HM, Becker K, Wittassek M, et al. Di-n-butylphthalate and butylbenzyl -phthalate - urinary metabolite levels and estimated daily intakes: pilot study for the German environmental survey on children. J Expo Sci Environ Epidemiol,2007; 17, 378-87.
44. Koch HM, Wittassek M, Brüning T, et al. Exposure to phthalates in 5-6years old primary school starter in Germany-A human biomonitoring study and a cumulative risk assessment. Int J Hyg Environ Health, 2011; 214, 188-95.
45. Frederiksen H, Aksglaede L, Sorensen K, et al. Urinary excretion of phthalate metabolites in 129 healthy Danish children and adolescents: estimation of daily phthalate intake. Environ Res,2011; 111, 656-63.
46. Clark KE, David RM, Guinn R, et al. Modeling human exposure to phthatlae Esters: A comparison of indirect and Biomonitoring. Hum Ecol Risk Assess, 2011; 17, 923-65.
47. Ministry of Agriculture, Fisheries and Food. Phthalates in Infant Formulae-F ollow-up Survey. Food Surveillance Information Sheet no. 168. 1998.
Biomed Environ Sci, 2016; 29(5): 365-373 10.3967/bes2016.047 ISSN: 0895-3988
*This work was partially supported by China's Ministry of Science & Technology (No.2014ZX09304307).
#Correspondence should be addressed to SONG Yan, E-mail: songyan@cfsa.net.cn
Biographical note of the first author: ZHANG Lei, male, born in 1973, PhD, Associated Researcher, majoring in food safety risk assessment.
September 8, 2015;
 Biomedical and Environmental Sciences2016年5期
- Biomedical and Environmental Sciences的其它文章
- Development of a Novel PmpD-N ELISA for Chlamydia psittaci Infection*
- Evaluation of Six Recombinant Proteins for Serological Diagnosis of Lyme Borreliosis in China*
- Viral Etiology Relationship between Human Papillomavirus and Human Breast Cancer and Target of Gene Therapy
- Whole Genome Sequencing and Comparisons of Different Chinese Rabies Virus Lineages Including the First Complete Genome of an Arctic-like Strain in China*
- The Status and Associated Factors of Successful Aging among Older Adults Residing in Longevity Areas in China*
- Cognitive Training in Older Adults with Mild Cognitive Impairment